stats exam 2
1/44
There's no tags or description
Looks like no tags are added yet.
Name | Mastery | Learn | Test | Matching | Spaced | Call with Kai |
|---|
No analytics yet
Send a link to your students to track their progress
45 Terms
Scatterplot
shows relationship between 2 variables
central tendency
value that represents similarities within the group
variance
value that represents differences within the group
when is mean relavent
when data seem to follow a normal pattern
when is mode relavent
when there are only a small number of possible answers
when is median relavent
when there is a huge range of numbers with some being very far from others
choose mode when
there are only a few answer possibilities
variance
measure of variability
core of statistics
variety
measurements of variance
range and standard deviation
is range grounded by the scale of the variable
no
should mean be used for uneven distribution
no
standard deviation tells us the _____ of variability, not the_______ of variability
amount, pattern
if data is unevenly distributed, should mean be used for central tendency
no
when distribution is normal, are mean meadian and bode all equal
yes
central tendency + variability =
full picture
what graph is for one continuous variable only
histogram
are bars in a histogram all the same color
yes
x axis in a histogram is the
bin
y axis on a histogram is the
frequency
influential outlier
adds bias
if an outlier is >3 sd from the mean
discard it
histogram
only one continuous variable, y axis is count/frequency, individual level data
scatterplot
one continuous variable plus one categorical ORRRR continuous variable, individual data
line graph
two continuous variables, group level data
bar graph
one continuous and one categorical variable, compares group level data

what is this
scatterplot
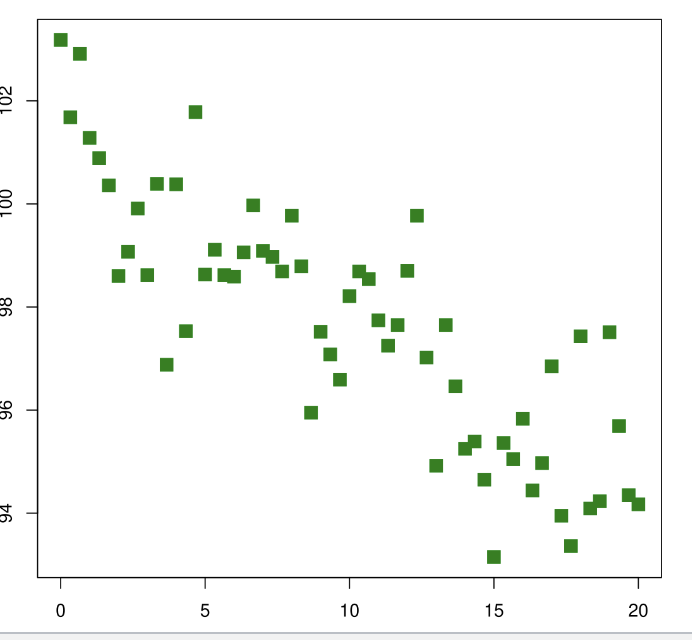
what are the variables in this scatterplot
2 continuous

what is this
scatterplot
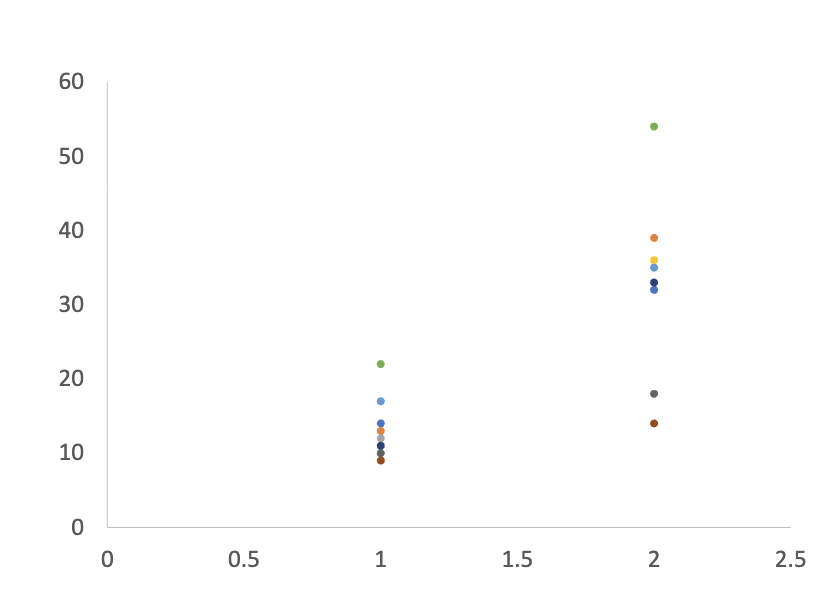
what are the variables in this scatterplot
one categorical and one continuous
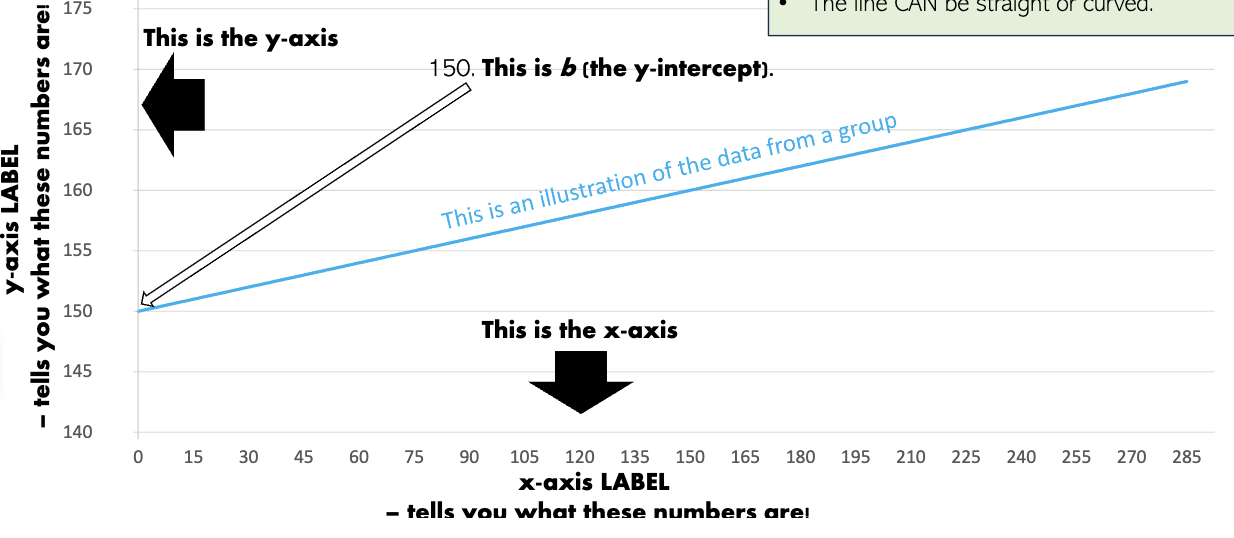
what is this
line graph
line graphs are only used for
continuous variables
line graphs measure if things are _____ and if theyre _____
changing different
does the line in a line graph show central tendency
yes
does the line in a line graph show variance
no
visual represention of the standard deviation
error bars
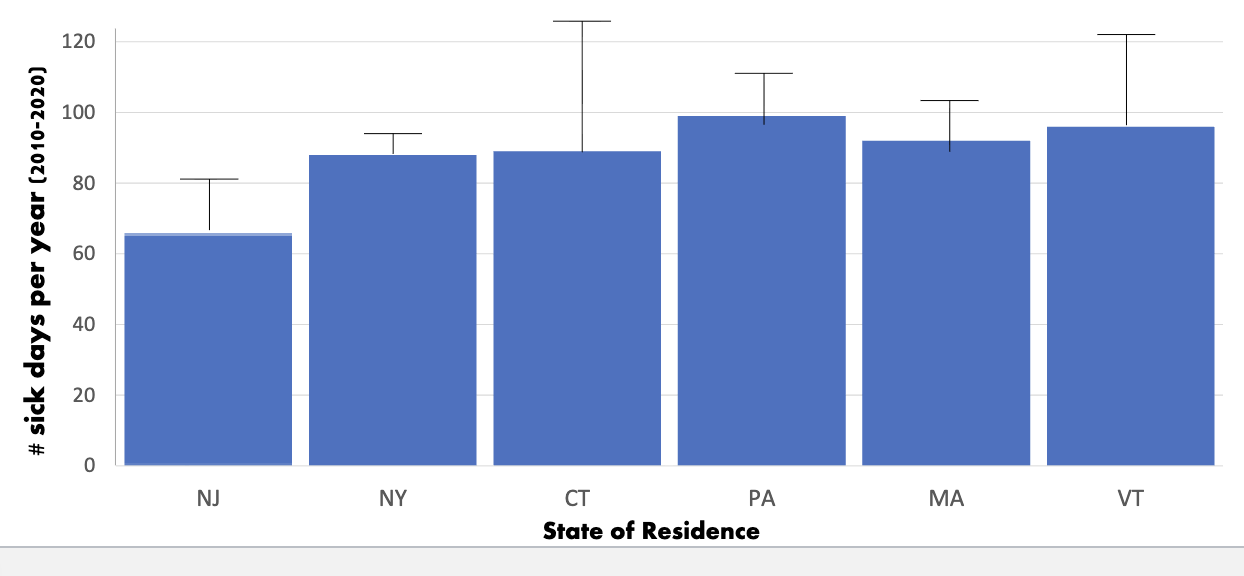
what is this
bar gaph

what type of variable is on the x axis
categorical

what type of variable is on the y axis
continuous
what do descriptive statistics do
describe data
types of descriptive statistics
central tendency and variance
graph si pointy or flat, central tendency is ok
kurtosis
central tendencies are unequal,
skewed