Unit 2
5.0(1)
Card Sorting
1/59
Last updated 1:05 AM on 4/25/23
Name | Mastery | Learn | Test | Matching | Spaced | Call with Kai |
|---|
No analytics yet
Send a link to your students to track their progress
60 Terms
1
New cards
Distribution influencing factors \[**Economy**\]
**Areas with developed markets and skilled workers bring in high populations**
Ex. India has a huge economy and a higher population density
Ex. India has a huge economy and a higher population density
2
New cards
Distribution influencing factors \[**Culture**\]
Cultural practices and ethnic relationships can influence settlement
3
New cards
Distribution influencing factors \[**History**\]
**Ancient settlement locations and colonialism have impacted pop. distribution.**
Ex. Nigeria, the US, and India, all former colonies, have a higher population densities
Ex. Nigeria, the US, and India, all former colonies, have a higher population densities
4
New cards
Distribution influencing factors \[**Climate**\]
**Extreme areas have a lower population density**
EX. Europe's temperate climate attracts many people
EX. Europe's temperate climate attracts many people
5
New cards
Distribution influencing factors \[**Water Bodies**\]
**River valleys may also promote human settlements due to resources**
EX. Egypt - 95% of the population lives within 5 miles of the Nile River.
EX. Egypt - 95% of the population lives within 5 miles of the Nile River.
6
New cards
Distribution influencing factors \[**Landforms**\]
**Landforms: rugged terrain restricts the concentration of population in any area**
Ex. Himalayans Mts. have a lower population density
Ex. Himalayans Mts. have a lower population density
7
New cards
Distribution influencing factors \[**Politics**\]
**Stable/fair governments have a t high pop. density**
Ex. Sudan has an unstable gov't and lower population density
Ex. Sudan has an unstable gov't and lower population density
8
New cards
Population Density
Population density is the pressure a population exerts on the land
9
New cards
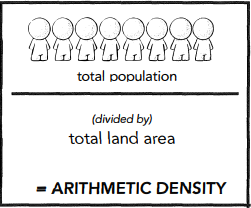
ARITHMETIC DENSITY
Number of people living in a given unit of land
10
New cards
AGRICULTURAL DENSITY
Number of farmers per unit of arable land, will be lower in areas where there is more commercial agriculture
11
New cards
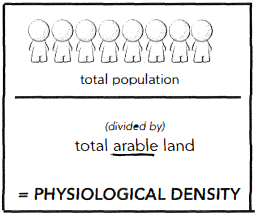
PHYSIOLOGICAL DENSITY
Number of people per unit of arable land
12
New cards
Arable land
Land that can be used for agriculture
13
New cards
Consequences of Population Distribution
* Population distribution is the way that people are clustered across the globe
* Population is mainly clustered in cities
* 55% of the world’s population now lives in urban areas
* Population is mainly clustered in cities
* 55% of the world’s population now lives in urban areas
14
New cards
Social and Economic Consequences
* Ageing population in rural areas as young people go to cities for jobs leads to high age-dependency ratio
* Especially in LDCs, lack of housing compared to rate of migration leads to the creation of slums and shantytowns
* Diseases are easily spread in urban areas
* Especially in LDCs, lack of housing compared to rate of migration leads to the creation of slums and shantytowns
* Diseases are easily spread in urban areas
15
New cards
Environmental Consequences
* Large population density puts a strain on environmental resources in the area
* Carrying Capacity is the largest population an area can support
* High concentration of manufacturing plants and other buildings leads to large amounts of pollution and water contamination
* Carrying Capacity is the largest population an area can support
* High concentration of manufacturing plants and other buildings leads to large amounts of pollution and water contamination
16
New cards
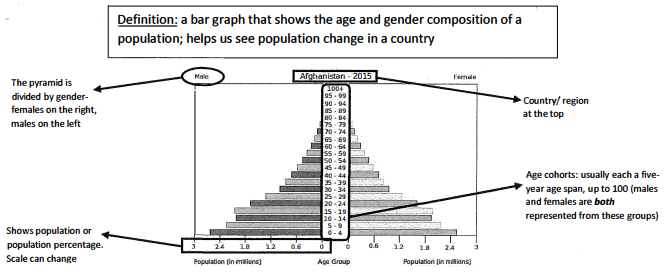
Population pyramids
A bar graph that shows the age and gender composition of a population; helps us see population change in a country
17
New cards
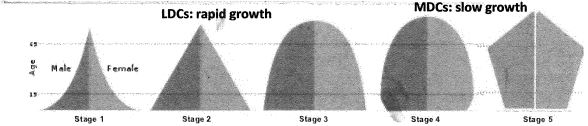
Population Pyramids and the DTM
18
New cards
Factors contribute to population growth and decline \[**Fertility**\]
Fertility is measured using Crude Birth Rate(CBR). Crude Birth Rate- is the number of births per 1000 people per year.
19
New cards
Factors contribute to population growth and decline \[**Migration**\]
The movement of people to a new area. Doesn’t change the total number of people on the planet but does change the people living in a specific area.
20
New cards
Factors contribute to population growth and decline \[**Mortality**\]
Mortality is measured using Crude Death Rate(CDR). Crude Death Rate- is the number of deaths per 1000 people per year.
21
New cards
Factors contribute to population growth and decline \[**Total fertility rate(TFR)**\]
Average number of kids a woman will have in her life
22
New cards
Factors contribute to population growth and decline \[**Immigration**\]
* Is the movement of a person into a country
* Usually into a MDC.
* Usually into a MDC.
23
New cards
Factors contribute to population growth and decline \[**Emigration**\]
* Is the movement of a person out of a country
* Usually out of a LDC
* Usually out of a LDC
24
New cards
Factors contribute to population growth and decline \[**Infant Mortality Rate**\]
Number of deaths under 1 year per 1000 people
25
New cards
Rate of natural increase(RNI)
**The percentage of population growth in an area excluding migration**
* RNI= (CBR-CDR)/10
* The RNI is High in LDCs due to their CBR being high and Low in MDCs due to their CDR being high and CBR being low
* RNI= (CBR-CDR)/10
* The RNI is High in LDCs due to their CBR being high and Low in MDCs due to their CDR being high and CBR being low
26
New cards
Doubling time
**Amount of time it will take for a population to double in size.**
Doubling time= 71 / RNI
Doubling time= 71 / RNI
27
New cards
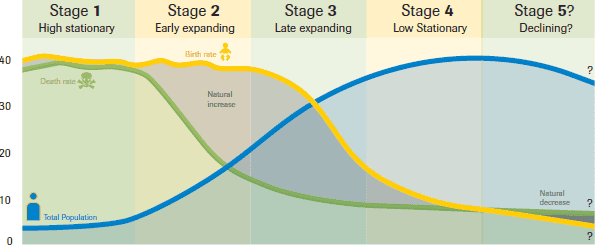
Demographic Transition Model
**Shows population change over time**
o Based off population trends in Europe
o Observed by Warren Thompson
o Relates changes in RNI to social change as a result of urbanization and industrialization
o Describes a shift from high birth and death rates to low birth and death rates over time
o Based off population trends in Europe
o Observed by Warren Thompson
o Relates changes in RNI to social change as a result of urbanization and industrialization
o Describes a shift from high birth and death rates to low birth and death rates over time
28
New cards
![Demographic Transition Model \[**Stage 1**\]](https://knowt-user-attachments.s3.amazonaws.com/af529c8290ff4aba8d2ab0dec12c0726.jpeg)
Demographic Transition Model \[**Stage 1**\]
**Pre industrial -(until 1750)**
* Birth Rate: High (because)
* Children needed for farming
* Children die at an early age
* No family planning
* Death Rate: High (because)
* Disease
* Famine
* Poor medical knowledge
* Natural increase or decrease
* stable or very slow increase
* Example Countries
* no example countries
* Amazon Tribe Basin
29
New cards
Demographic Transition Model \[**Stage 2**\]
**Early industrial - (1750-1880)**
* Birth Rate: High
* Children needed for farming
* Children die at an early age
* No family planning
* Death Rate: Falls Rapidly (because)
* Contagious diseases
* But improvements in
* Medical care
* Water Supply
* Sanitation
* Natural Increase or decrease
* very rapid increase
* Example Countries
* Egypt
* Ethiopia
* Kenya
30
New cards
Demographic Transition Model \[**Stage 3**\]
**Late industrial - (1880-1970)**
* Birth Rate: Falling (because)
* Improved medical care
* Improved diet
* Industrialized
* **Natural increase or decrease**
* increases moderately
* Example Countries
* Brazil
* India
* Birth Rate: Falling (because)
* Improved medical care
* Improved diet
* Industrialized
* **Natural increase or decrease**
* increases moderately
* Example Countries
* Brazil
* India
31
New cards
Demographic Transition Model \[**Stage 4**\]
**Post industrial - (1970-Present)**
* Birth Rate: Low (because)
* Family planning
* Good health
* Improving status of women
* later marriages
* Death Rate: Low
* Chronic diseases
* Better health care
* Reliable food supply
* Natural increase or decrease
* Stable or very slow increase
* Example Countries
* USA
* France
* UK
* Birth Rate: Low (because)
* Family planning
* Good health
* Improving status of women
* later marriages
* Death Rate: Low
* Chronic diseases
* Better health care
* Reliable food supply
* Natural increase or decrease
* Stable or very slow increase
* Example Countries
* USA
* France
* UK
32
New cards
Demographic Transition Model \[**Stage 5**\]
**Declining (Future)**
* Birth Rate: Very Low (because)
* Family planning
* Good health
* Improving status of women
* Later marriages
* Death Rate: Low
* Chronic diseases
* Better health care
* Reliable food supply
* Natural increase or decrease
* Slow decrease
* Example Countries
* Germany
* Russia
* Japan
* Birth Rate: Very Low (because)
* Family planning
* Good health
* Improving status of women
* Later marriages
* Death Rate: Low
* Chronic diseases
* Better health care
* Reliable food supply
* Natural increase or decrease
* Slow decrease
* Example Countries
* Germany
* Russia
* Japan
33
New cards
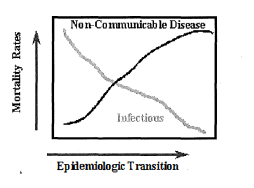
The Epidemiological Transition
**The shift from infectious diseases to chronic diseases.**
* Aligns with the demographic transition model (DTM).
* Shows most common causes of death in each stage of the DTM.
* As a country develops more, the main cause of death shifts towards chronic diseases.
* The main cause of death in LDCs are due to infectious diseases
* The main cause of death in MDCs are due to chronic diseases
34
New cards
Infectious Diseases
* Spread from human to human
* Often temporary -Caused by bacteria and/ or viruses
* Prominent in LDCs -More common due to poor sanitary regulations
* Occurs in stages 1 and 2 of the DTM
* Examples include measles and influenza
* Often temporary -Caused by bacteria and/ or viruses
* Prominent in LDCs -More common due to poor sanitary regulations
* Occurs in stages 1 and 2 of the DTM
* Examples include measles and influenza
35
New cards
Chronic Diseases
* Is not spread from human to human, instead develops over time as the body becomes weaker
* Prominent in MDCs
* More common due to higher life expectancy
* Can not be cured or prevented usually
* Examples include multiple sclerosis and arthritis.
* Prominent in MDCs
* More common due to higher life expectancy
* Can not be cured or prevented usually
* Examples include multiple sclerosis and arthritis.
36
New cards
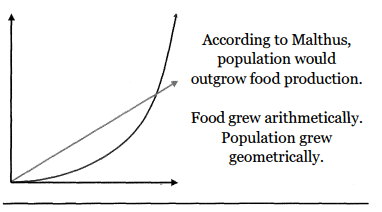
Malthusian Theory
* **THOMAS MALTHUS** English Economist
* Population growth leads to poverty and misery.
* Environmental Determinist
* Did not consider technological advancements
* **Positive Checks**- Reduce population; famine, disease, etc.
* **Preventative Checks**- Actions to prevent population growth; postponing marriage, less sex, etc.
* Population growth leads to poverty and misery.
* Environmental Determinist
* Did not consider technological advancements
* **Positive Checks**- Reduce population; famine, disease, etc.
* **Preventative Checks**- Actions to prevent population growth; postponing marriage, less sex, etc.
37
New cards
NED-MALTHUSIANS
**People who share similar ideas to Malthus**
* World space and resources were limited, but the environment was not the determinant.
* Carrying Capacity- The maximum number of people that can live on Earth comfortably
* Want strict population control
* World space and resources were limited, but the environment was not the determinant.
* Carrying Capacity- The maximum number of people that can live on Earth comfortably
* Want strict population control
38
New cards
ESTER BOSERUP
Danish Economist & Main Critic of Malthus
* As the population grows, there would be more technologies to produce more food.
* Possibilist
* Argued food production could be increased
* As the population grows, there would be more technologies to produce more food.
* Possibilist
* Argued food production could be increased
39
New cards
CORNUCOPIANS
**"Necessity is the mother of invention."**
* Cornucopian Theory- Humans can innovate ways to expand the food supply
* People are a valuable resource.
* Cornucopian Theory- Humans can innovate ways to expand the food supply
* People are a valuable resource.
40
New cards
Women and Population \[**Education**\]
* Women typically have much less access to education than men
* This trend is strongest in LDCs, and among impoverished areas
* Ex: Somalia- 95% of poorest females aged 7- 16 have never attended school
* In recent decades, rates of higher education in women have increased (mainly in MDCs)
* Increased education leads to decreased fertility rates but increased participation in the work force
41
New cards
Women and Population \[**Economic Roles**\]
* Women have uneven participation in different sectors of the economy
* Concentrated in the service sector, in careers such as teaching and health care
* Underrepresented in jobs requiring higher education, such as STEM jobs including architecture or engineering
* Gender Wage Gap- a global trend in which women are paid less than men
* Ex: In the United States, women earned just 79 cents for every dollar men made in 2019.
42
New cards
Women and Population \[**Fertility**\]
* Fertility- the births within a given population
* Lower in MOCs
* Women's increased education and participation in politics and the economy cause them to wait to have children
* Ex: Japan- fertility rates are decreasing as more women pursue careers rather than have children
* Higher in LDCs
* Earlier marriage and children due to lack of education or career o
* Ex: Niger- highest total fertility rate of 6.62 (almost 7 children per woman)
* Gender roles provide many women with a low status, and they do not have access to contraceptives or the opportunity for family planning
43
New cards
Women and Population \[**Political Roles**\]
* Women participate less in political affairs than men
* Ex: 2016- only 22.8% of parliament members were female
* Similar to education and economy, this significant gap has been lessened in recent decades (mainly in MDCs)
* More educated women leads to greater political participation
* Ex: 2016- only 22.8% of parliament members were female
* Similar to education and economy, this significant gap has been lessened in recent decades (mainly in MDCs)
* More educated women leads to greater political participation
44
New cards
Women and Population \[**Mortality**\]
* Mortality- the deaths within a given population
* Educated women have a lower mortality rate, as they can pursue careers to financially support themselves and have access to healthcare
* Ex: Sub-Saharan Africa- maternal deaths would be reduced by 70% if all women had a primary education
* Women are often responsible for the nutrition of the family, especially the children
* Women's prenatal health impacts Infant Mortality Rates
* Better prenatal healthcare = lower IMR
45
New cards
Age-dependency Ratio
Number of people under 15 and over 65 + Number of people between 15 and 65 (working age)
46
New cards
Blue Zones
**Areas that have populations with substantially long lives**
* **Okinawa, Japan**
* **Loma Linda, California**
* **Ikaria, Greece**
* **Okinawa, Japan**
* **Loma Linda, California**
* **Ikaria, Greece**
47
New cards
Push Factors
**Negative conditions that push people away and encourage migration.**
* Ex: natural disasters, lack of jobs, lack of transportation, war, poverty.
* Ex: natural disasters, lack of jobs, lack of transportation, war, poverty.
48
New cards
Pull factors
**Positive conditions of a place that attract migrants.**
* Ex: lots of job opportunities, lots of transportation, religious freedom.
* Ex: lots of job opportunities, lots of transportation, religious freedom.
49
New cards
Voluntary migration
Migration that occurs by choice
50
New cards
Forced migration
When migration of people occurs not by choice but is insisted upon by some entity
51
New cards
Human Trafficking
Women and children forced to move into and work in exploitative conditions such as prostitution with violence and force.
52
New cards
IDPs
Internally displaced persons, people who are forced out of one part of their country to another part of their country
53
New cards
Asylum
A granting of protection from a country to a refugee fleeing persecution
54
New cards
Asylum Seekers
A person who has left their country over fear of persecution and hopes to be granted status as a refugee.
55
New cards
Refugees
Refugees are people who flee their country and arrive in another country over fear of safety or persecution.
56
New cards
Ravenstein's Laws of Migration
1. Most migrants travel short distances and do not cross international borders.
2. Migration to and between cities and towns creates gaps filled by migrants that move from more distant places.
3. There are two processes: dispersion (departure) and absorption (arrival)
4. Counterflows result from migration flows
5. Long distance migration is often RURAL to URBAN
6. People that live in urban places are less likely to migrate than those who live in rural places.
7. Men are more likely to migrate internationally than women who are more likely to migrate within their country
57
New cards
Unauthorized Immigrant
**People who come to a country, but either don’t enter or don’t remain legally; most often they enter LEGALLY with a temporary visa, but remain after their visa expires.**
(Also known as undocumented or illegal immigrants)
(Also known as undocumented or illegal immigrants)
58
New cards
Transnationalism
The process of immigrants developing ties to more than one country
* Shows that migration demonstrates a system of circulation
* Migration is not just one way, there are counterflows
* Migration is part of the reason for the diffusion of different cultural ideas. For example, English spread in part through settler colonies established by England.
* Historical ties via migration can impact modern political ties between governments, business connections, etc.
59
New cards
Brain Drain
**The emigration of people who are considered skilled workers**
* **Loss of skilled workers and therefore innovations and ideas in an area; Harms the economy of the home/ source country**
* **Can help the country if the skilled workers return to the home country with new skills**
* **Occurs most often in Less Developed Countries(LDCs)**
* **Loss of skilled workers and therefore innovations and ideas in an area; Harms the economy of the home/ source country**
* **Can help the country if the skilled workers return to the home country with new skills**
* **Occurs most often in Less Developed Countries(LDCs)**
60
New cards
Remittances
The money, goods, or services sent by immigrants to their home countries
* Example of transnationalism
* Creates a strong positive impact in the migrant’s home country (Ex: some of rural Mexico’s communities are supported solely by the remittances)
* Sending countries are mostly More Developed Countries(MDCs), while most of the receiving countries are LDCs
* Example of transnationalism
* Creates a strong positive impact in the migrant’s home country (Ex: some of rural Mexico’s communities are supported solely by the remittances)
* Sending countries are mostly More Developed Countries(MDCs), while most of the receiving countries are LDCs