CPSY0900: Distributions & Z Scores
1/27
There's no tags or description
Looks like no tags are added yet.
Name | Mastery | Learn | Test | Matching | Spaced |
|---|
No study sessions yet.
28 Terms
Distribution
How data is spread out over a range
What are the three types of common distributions?
Unimodal: one peak, most of the data clusters around one mode
bimodal: 2 peaks, indicates data comes from 2 different groups
uniform: all datapoints have the same frequency of occurrence
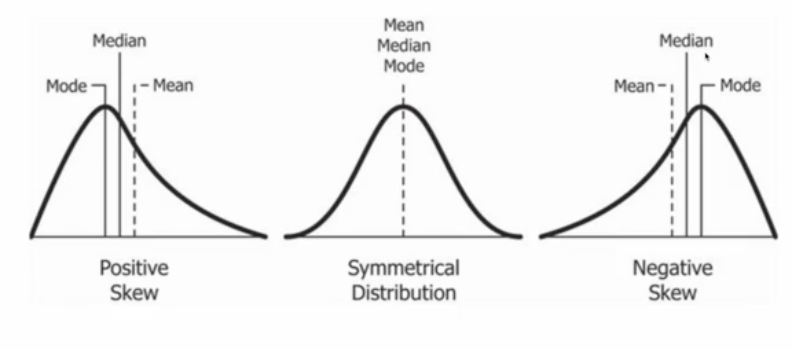
What are the three different types of skews?
Positive skew: tail to the left, mode < median > mean
symmetrical skew: no tail, mode = median = mean
negative skew: tail to the right, mean < median > mode
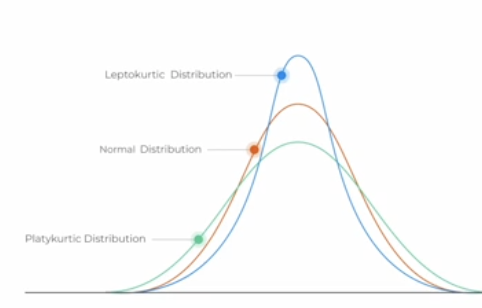
What is kurtosis?
statistical measure that tells us whether a distribution is more or less peaked than the normal distribution
<3: leptokurtic (more peaked)
=3: mesokurtic (normal distribution)
<3: platykurtic (less peaked)
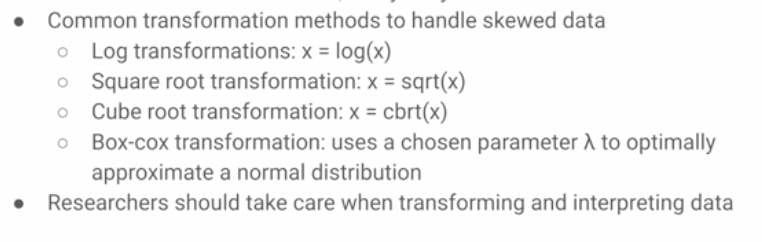
Why do researchers transform raw data?
When a distribution is skewed, statistical tests given invalid results because many statistical models rely on the assumption of distribution symmetry
What are the common data transformations?
What are the other names for a normal distribution?
Gaussian or bell shaped
What are the unique properties of a normal distribution?
no skew; data is symmetric around the mean
mean = mode = median
area under the normal curve = 1
denser in the center around the mean, less dense at the tails
defined by:
mean (determines the center)
standard deviation (determines the spread)
What is the 68-95-99.7 rule regarding the spread of a normal distribution’s data?
~68% of all data is within 1 SD from the mean
~95% of all data is within 2 SD from the mean
~99.7% of all data is within 3 SD from the mean
What is the standard normal distribution?
the mean = 0, and the SD = 1
it is used to compare data from different normal distributions by converting values into standardized z-scores
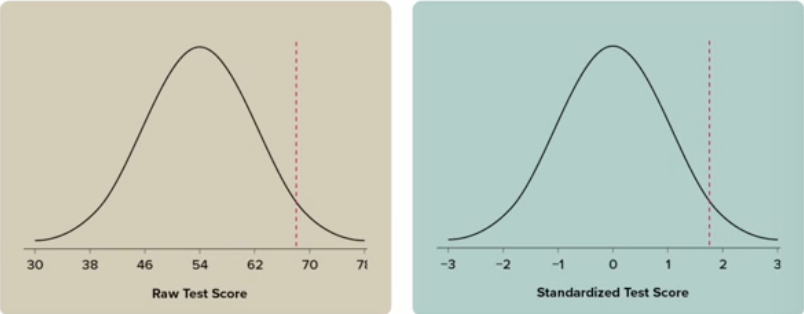
How to convert raw data to standardized data?
converting each data point into a z-score
only the scale/values of the datapoints is adjusted; the trend of the curve looks the same
Z-score
number of SD a particular datapoint is from its mean
converts raw to standardized metrics
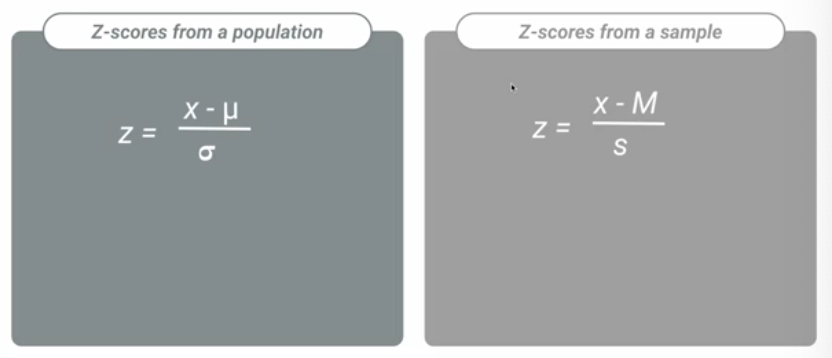
How do you calculate z-scores?
subtracting the mean from the value of interest, then dividing by the distributions SD
Interpreting z-scores: list the two variables you can consider and what each type of variable means about the given z-score
Sign
positive z-score = the score is above the mean (right tail)
negative z-score = the score is below the mean (left tail)
Magnitude
how far away (in units of SD) the score is from the mean
Why is the magnitude of z-scores most often between -3 and 3?
68-95-99.7 rule; most data falls between 3 SD of this range; z-scores outside of this range represent outliers
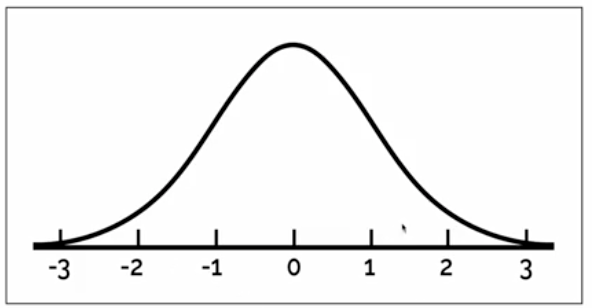
Where would the following datapoints be on this graph based on their z-score?
z-score of…
1.5
-1.5
-0.5
2.9
1.5 units above the mean (in between 1-2)
1.5 units below the mean (in between -1 and -2)
between 0 and -1
way out in the tail (near 3)
What if these values represented the age of dogs in a sample?
ex. 1.5 SD older than the average age of dogs in the sample
Converting raw scores to z-scores
calculate the mean
calculate the SS for variance and SD
calculate the z score: z = X - u(mean) / SD
X = the value in the dataset whose z-score you’re trying to find
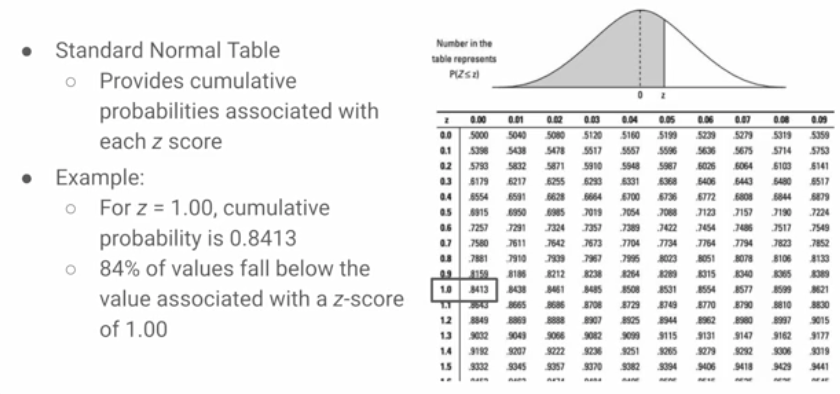
What does the standard normal table do?
provides cumulative probabilities associated with each z-score
tells what proportion of the data falls below that z-score
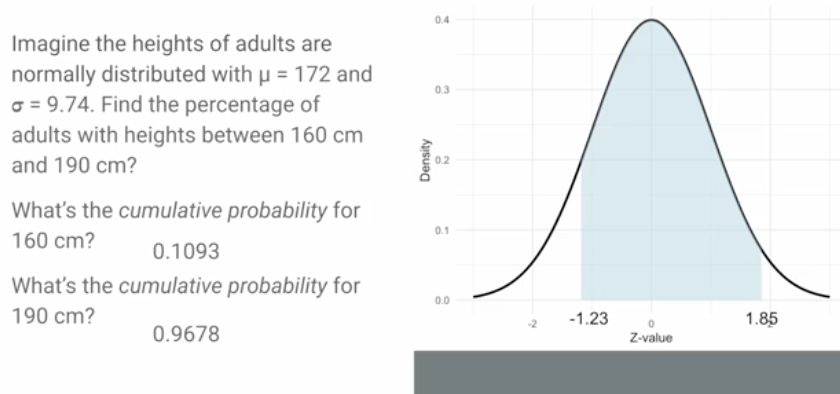
Understand this example regarding finding probabilities using Z-scores
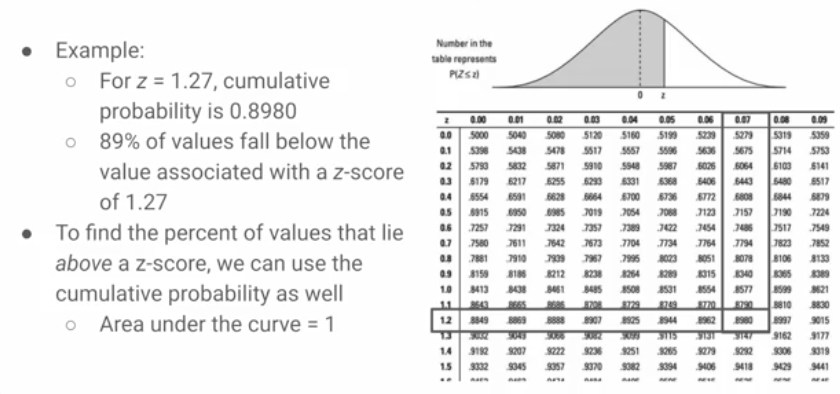
Finding the % of values that fall between 2 z-scores
subtract the cumulative prob of 160 cm from cumulative prob of 190 cm = % of the population with a height between 160-190 cm
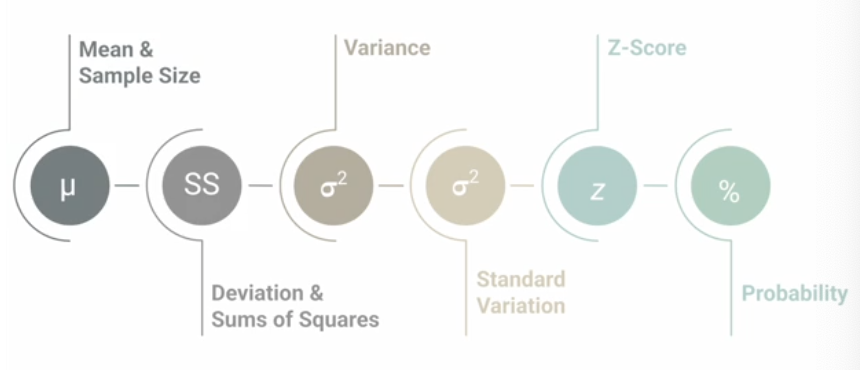
Step-by-Step approach to calculating Z-scores
mean and sample size of data (calculate deviations and sum of squares)
find variance and SD
calculate the z-score for the datapoint of interest
use the standard normal table (provided on canvas) to find the cumulative prob and interpret the area under the curve
also helpful to sketch the distribution while doing these problems
mark the mean and z-score of interest
shade the area under the curve that represents the probability you’re calculating
gives you a clearer picture of how the data is distributed
Why are populations and samples different?
parameter vs. statistic
parameter: numerical value that describes a population
statistic: numerical value that describes a sample
sample is a portion of the population selected for a study
used to make inferences about the population being studied
sampling methods can do their best to minimize bias
ensure the sample stats accurately reflect the population
Describe how the variance, SD, and z-score calculations differ for populations and samples
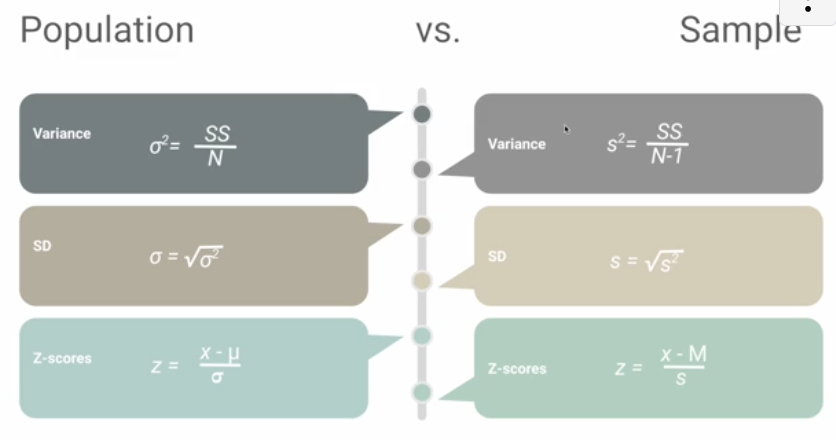
Why are degrees of freedom a factor when calculating sample values?
the N-1 adjustment compensates for the fact that samples tend to slightly underestimate the population variance
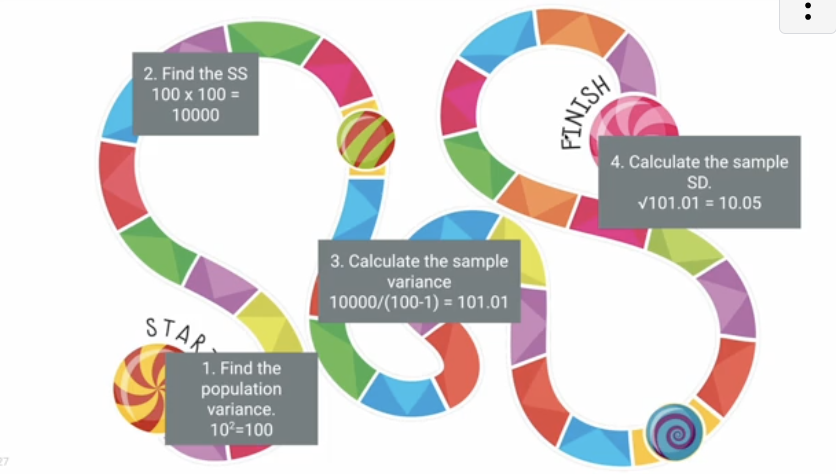
How do the SS for population and samples relate?
the SS is always the same for the sample and population
What is the effect of the N-1 adjustment when calculating variance for samples compared to that of populations?
the sample variance is always larger than the population variance due to the denominator adjustment (N-1)
as sample size increases, the effect of subtracting (N-1) becomes smaller
larger sample sizes bring estimates of sample variance closer to that of the population variance
aka: larger samples tend to reflect the population better