Chpater 3 - interrogation tools for consumers of research
1/33
There's no tags or description
Looks like no tags are added yet.
Name | Mastery | Learn | Test | Matching | Spaced |
|---|
No study sessions yet.
34 Terms
variable
a measure that changes or varied
Has at least two levels or values
Ex. height, happiness score, hours of sleep
Constant
a measure that stays the same
May be naturally invariable, or held constant
Ex. grade when looking at a single class
Measured variables
variables that are controlled by the researcher
Called independent variables in experiments
Conceptual variables (constructs)
abstract, concepts that are being investigated
Ex. happiness, enjoyment, scariness
Need turn them into operational definitions to study abstract concepts
Operational definition
description that specifies exactly how a term will be measured
Definition must be precise and quantifiable (what are you measuring and how?)
Definition must be objective and unambiguous( what counts and doesn't count as behaviour occurring?)
Definition must be practical and useful (need to be able to measure and be of actual use)
Example: measuring the “mouth wateringness” of food
Label: salivation
Operational definition: number of mg of saliva absorbed by cotton balls (size x) placed in a particular area in the mouth for a specific period of time
Three types research questions
Descriptive
Measure and report
Correlational
Find patterns and potential relationships
Experimental
Determine nature of relationships
Three types of research claims
Frequency claims
One variable
Association claims
Two related variables
Causal claims
Two variables: A causes B
Frequency claims
Describes a particular value of single variable
Involved measuring and reporting interesting degree of a single measured variable
Does not lik this value to any other variable
Related to the term “descriptive research”
Statistics
Using mathematics to organize, summarize, and interpret numerical data
Descriptive statistics: organizing and summarizing data in a useful way
Inferential statistics: interpreting data and drawing conclusions
Reporting frequency claims
Claims typically reported as a central tendency, often with some measure of variance
Ex. mean ± standard deviation
Tells us what the people in the study typically scored for the variable and the measure of noise in the data
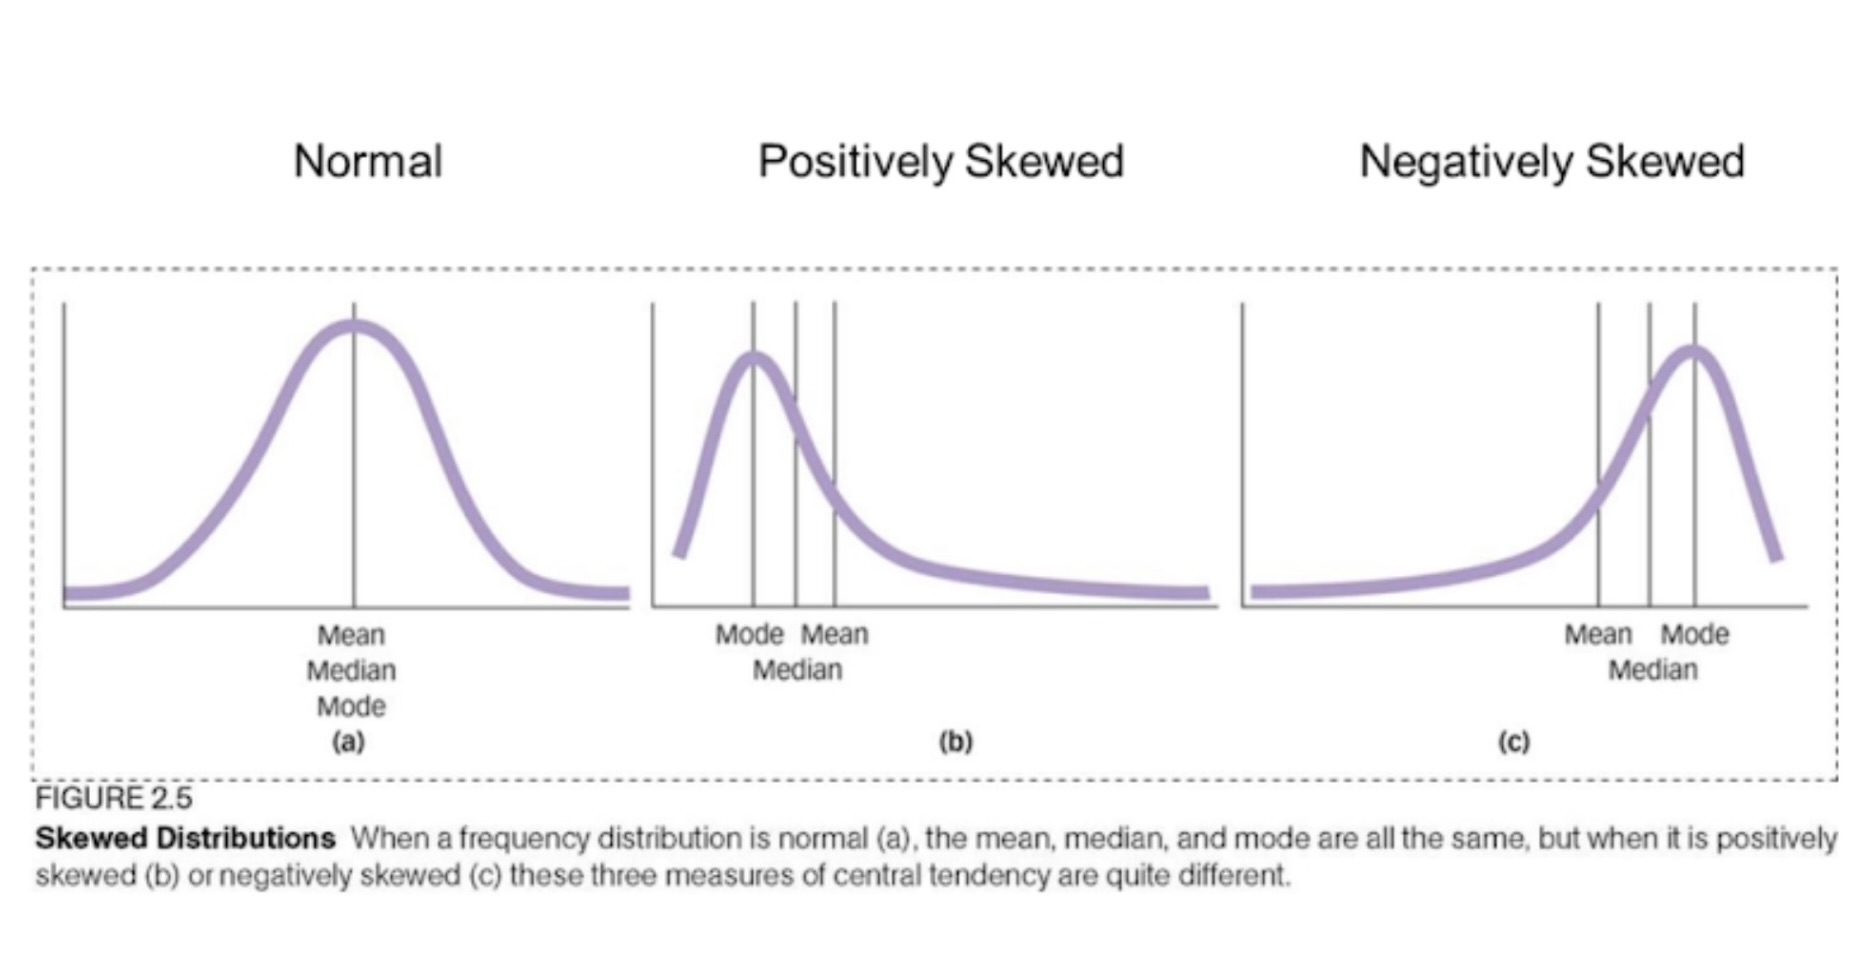
Measure of central tendency
Mean: average
Median: look at the total number of values, divided in half, record value given for middle data point
Mode: most frequent value
skewedness
Variability
How spread out is the data? What is the shape of the data?
Range: subtract the lowest from the highest value
Standard deviation: spread of data around mean (√𝑣𝑎𝑟𝑖𝑎𝑛𝑐)
Variance: average of squared deviation scores; (standard deviation)2
Association claims
Describes how one level of a variable is connected to a level of another variable
Involves finding patterns and potential relationships between 2 measured variables
Does not claim that one causes the other to change
Related to the term “correlational research”
Correlated/covary means variables are associated
Reporting association claims
Typically reported as a correlation between two measured variables
Tells us as one variable changes, how the other variable tends to change along with it
Correlation: look at linear relationship between 2 variables
(ex. Parents and childs height)
Regression: look at linear relationship between a predictor variable and one or more criterion variables
(ex. Risk of violence based on media exposure)
Correlations
Pearson’s correlation coefficient ®
Describes the linear relationship between 2 continuous variables
Ranges from -1.0 to +1.0
Sign indicates direction
Absolute value indicates strength
Positive correlations
As one variable increases, the other also increases
0 < r ≤ +1.0
R is positive
Negative correlations
As one variable increases, the other decreases
-1.0 ≤ r < 0
R is negative
Zero correlations
There is no relationship
Two variables are not correlated with one another
r = 0
There is no linear line
How are associations useful?
Show the strength of present relationships
Identifies “real world” associations
Is x related to y?
Not manipulating → may be a third variable that can affect outcome
Can be used to make predictions about variables
Past and future extrapolation
Stronger correlations give more accurate predictions
Cautions about association claims
Confounding variables can be misleading
Correlations may purely be from coincidence
Causal claims
Describe how one change in variation can produce changes in the level of another variable
Involves determining the nature of the relationships between 2 variables by manipulating the value of one and looking at changes in the other
Has to be at least one measured and one manipulated variable
Related to the term “experimental research”
Almost always look at experiments as an example
Idealistic set up - usually refer as close to a causal claim but never outright state that it is a causal relationship
Reporting causal claims
Claims can be reported in several different ways → usually include a statement of significance
Ex. two groups are slightly different
What its telling us will depend on the relationship investigated and the analysis being carried out
The 4 big validities
Construct validity
External validity
Statistical validity
Internal validity
Construct validity
How well the variables in a study are measured or manipulated
The extent to which the operations variables in a study are a good approximation of the conceptual variables
External validity
The extent to which the results of a study generalize to larger populations, as well as other times or situations
Statistical validity
How well the numbers support the claim – how string the effect is and the precision of the estimate is (the confidence interval)
Also takes into account if the study has been replicated
Internal validity
In a relationship between one variable (A) and another (B) where A is responsible for the changes in B rather than some other variable.
Interrogating frequency claims
Main concerns are construct and external validity
Construct validity
How well was the conceptual variable operationalized
Good operation definition? Used correctly?
External validity
How well do the the results generalize to people, places, times, or context outside those in the study
Generalizability determined by how sample is chosen and how representative that sample is of the population
May care about statistical validity
Statistical validity: how accurate, reasonable and replicable are the conclusions
Point estimate: estimate of some value in a population based on data from a sample
Precision of the estimate reported with confidence intervals (CIs), margin of error, or similar
Replication improves confidence
Interrogating association claims
Similar to frequency claims, concerns are construct, external and statistical validity
Main differences:
Construct validity applies to multiple variables
External validity looks at generalizability of the association being claimed
Statistical validity concerned with strength and significance of association as well as accuracy
Statistical validity in associations
Focus on strength, precision, and significance
Strength reported using correlation coefficients (or similar)
Precision of the association can still be reported with confidence intervals (CIs), margin of error, or similar
Significance needs to be calculated using techniques beyond our scope
Replication improves confidence
2 types of errors in conclusions
Claims of statistical significance relies on probability estimated which leads to two possible errors
Type I error: false positive
Assume an association when one does not exist
Type II error: a “miss” or false negative
Assume no association when there is one
Interrogating causal claims
Focus is on providing evidence for causal relationship
Three criterion for establishing causation:
Covariance - “study shows that as A changes, B changes”
Temporal precedence - “study’s methods ensure that A comes first in time, then B”
Internal validity - “study’s method ensures that there is no plausible alternative explanation for the change in B; A is the only explanation
Still care about construct validity, external validity, and statistical validity
Experiments can support causal claims
First manipulate the independent variable (manipulated variable), then see the dependant variable change afterward (measured variable)
Controlling for other variables ensures that changes are due to manipulations → gives internal validity
Ex. controlling variables through random assignment
Prioritizing validities
Which of the 4 validities are most important?
Depends on what kind of claim the researcher is making and the researcher’s priorities