3.3.1 THE EFFECT OF BIOTIC AND ABIOTIC FACTORS ON POPULATIONS
1/285
There's no tags or description
Looks like no tags are added yet.
Name | Mastery | Learn | Test | Matching | Spaced | Call with Kai |
|---|
No analytics yet
Send a link to your students to track their progress
286 Terms
Define a population.
A group of organisms of the same species, living in the same area (habitat) at the same time, that can potentially interbreed
Define a habitat.
Part of an ecosystem where a community of organisms lives (within each habitats there can be smaller units called microhabitats)
Define a community.
All the populations of different species living in the same area (habitat) at the same time
Define a ecosystem.
Populations of different species and the non-living components / all the (interacting) biotic and abiotic factors
Define species richness.
The number of different species in a community
Define species diversity.
The relationship between the number of different species in a community and the number of individuals in each species.
What is a species?
A group of similar organisms that can reproduce to produce fertile offspring / interbreed
Define distribution.
Where a species is found in an ecosystem
Define ecology.
The study of inter-relationships between organisms and their environment
Ecosystems are _______ systems of interacting ________ and _________ features, and can range in size from the very small to the very large.
dynamic, biotic, abiotic
Define abundance.
Number of individuals of a single species in an ecosystem/habitat = population size
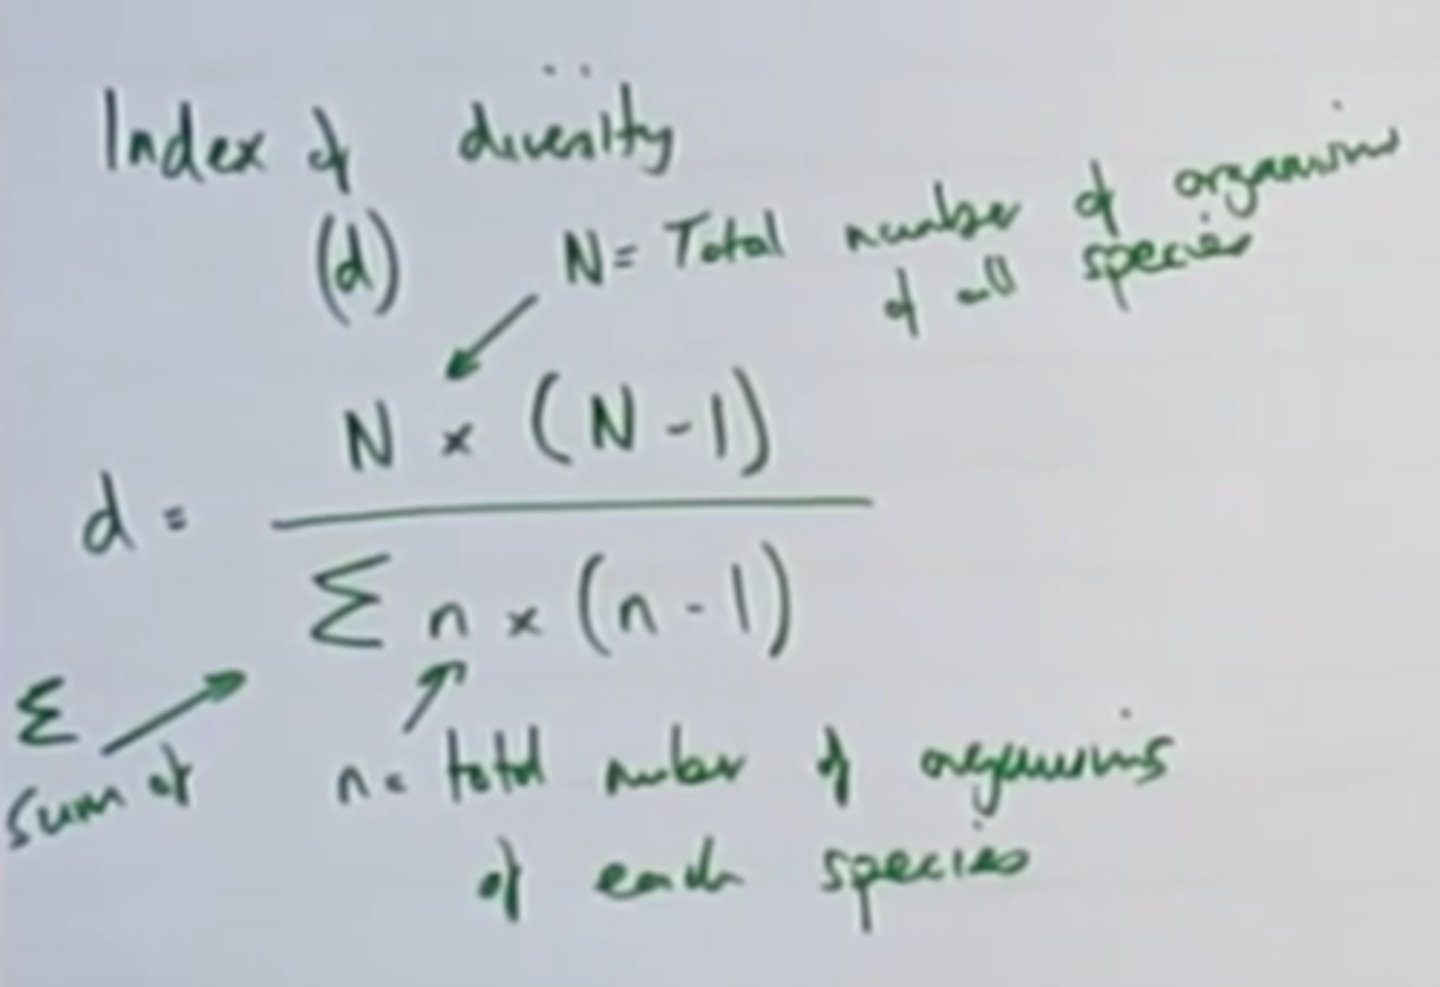
State the equation for index of diversity.
N = total number of organisms of all species present
n = total number of organisms of each individual species
Weird looking sign = sum of..
Within a habitat, a species occupies a different niche, governed by...
adaptation to abiotic and biotic conditions
What is a niche?
The role of a species within its ecosystem / community / environment, including their position in the food web and habitat, e.g. what it eats, where and when it feeds.
TIP!
Each species has its own unique niche; if two species try to occupy the same niche, one will outcompete the other as a niche can only be occupied by one species
What is a fundamental niche?
Where an organism could live
What is a realised niche?
Where an organism does live
What is the difference between a realised niche and a fundamental niche?
Realised niche is smaller than a fundamental niche due to competing biotic factors
What are abiotic conditions?
The non-living features of the ecosystem.
What are biotic conditions?
The living features of the ecosystem.
What are examples of abiotic conditions?
- temperature: enzyme action, affect photosynthesis
- pH: enzyme action
- water and humidity: affect transpiration
- light: rate of photosynthesis
- shade a tree creates
- O2 that it uses / CO2 that it makes
- Use of minerals eg nitrates
What are examples of biotic conditions?
e.g. predation, food supply, disease, competition, interspecific competition for resources
TIP!!
The less harsh the abiotic factors, such as plenty water and light, the larger the range of species and the larger the population size
If two species had exactly the same niche they would _______ for everything.
compete
What happens when species have similar niches?
Overlap of niches causes interspecific competition (eg blue tits + great tits compete for food and resting sites)
The abundance of species in an ecosystem will depend on how much ________ for resources exists
competition
The distribution of a species will vary because an organism can only exist where its...
niche exists
Define carrying capacity.
Maximum stable population size an ecosystem can support; vary with biotic and abiotic factors
E.g.: biotic is competition for food, abiotic is nesting sites.
How can the abundance of a species be measured?
- Local frequency: Likelihood (%) of a species occurring in a quadrat (e.g. if it occurs in 10/20 quadrats then it's occurrence is 50%.)
- Percentage Cover: Estimate of the area that a species covers within a quadrat.
What are the advantages and disadvantages of using frequency to measure species abundance
+ Quick method to sample large area
-No information on density or detailed distribution of species.
- Poor accuracy as doesn't consider overlapping plants or size of plant
What are the advantages & disadvantages of using percentage cover to measure species abundance.
+ Quicker method than density, useful if too difficult to identify individual organism
+ Individuals don't need to be counted
- Subjective limiting accuracy, doesn't consider overlapping plants or the size of the plant
Population size varies due to a variety of factors such as:
- Abiotic factors
- Biotic factors
- Interspecific competition
- Intraspecific competition
- Predation
Define interspecific competition.
Competition between species
Define intraspecific competition.
Competition within a species.
Describe how interspecific competition causes population size to vary.
- The abundance of one species will affect the other
- Species with a similar niche will compete for resources (eg blue tit and great tit)
- Reduces resources available to both → limits both populations
- If one species is better adapted, it will out-compete the others
Describe how intraspecific competition causes population size to vary.
- Occupy the same niche → compete for everything (eg food / mates)
- Smaller population = less competition → better for growth and reproduction → larger population = more competition → less growth and reproduction → smaller population…
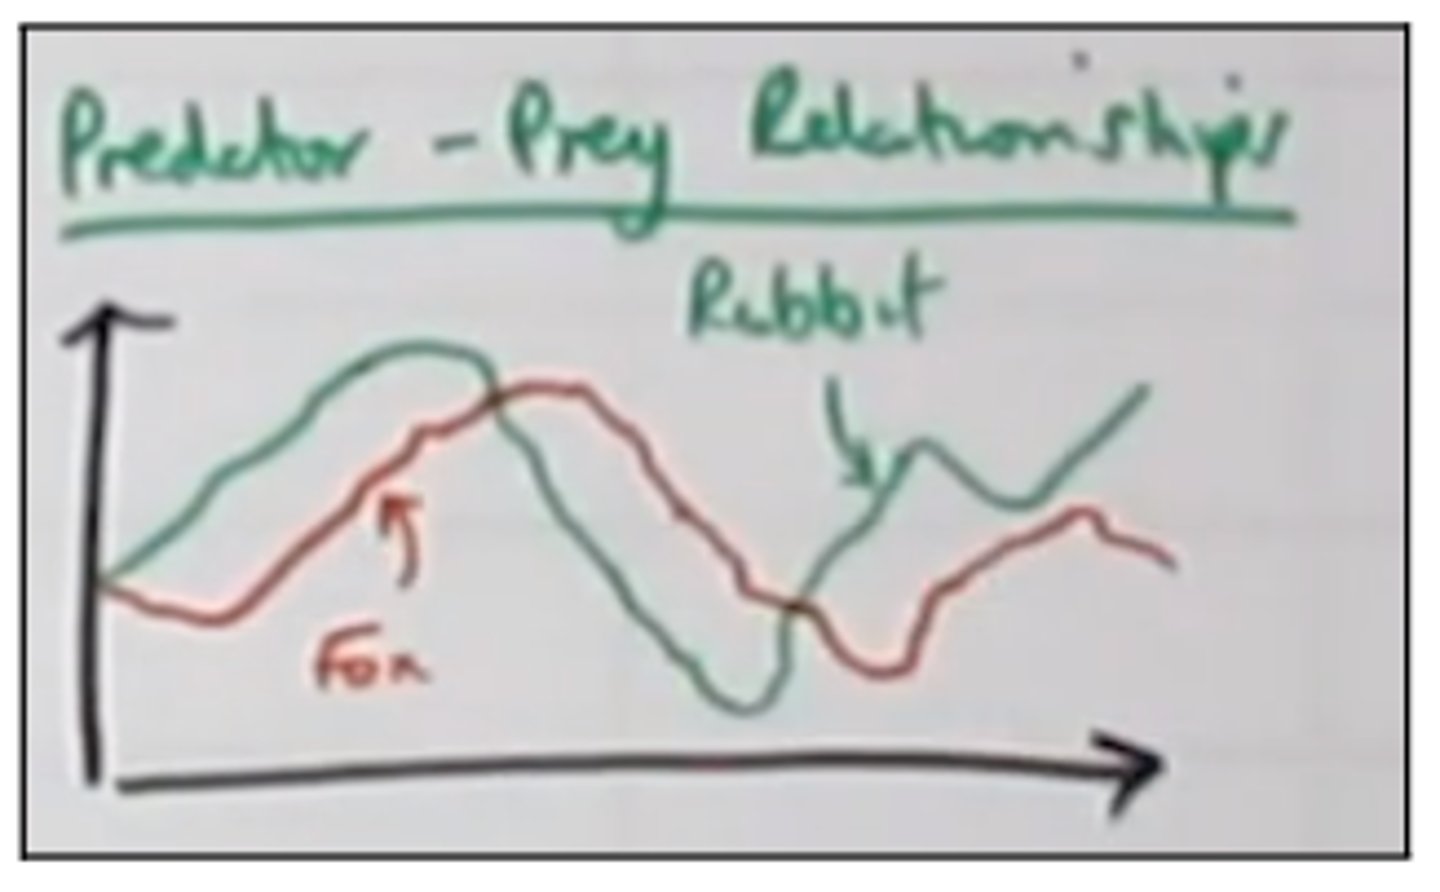
Describe how predation (predator - prey relationships) causes population size to vary.
Population sizes of predators and prey are interlinked:
- Increased predator population size → more prey eaten → prey population falls → less food for predators → predator population size falls → prey population rises → predator population rises again...

Describe the features of a predator - prey relationship.
- there will always be more prey than predators,
- the size of the population will always change in the prey then the predators (lag time),
- the size of the predator and the prey both fluctuate
Predation is not the only reason for fluctuations in population, so is...
- Disease
- Climatic factors
- Both create a selection pressure whereby only individuals who are able to escape predators or withstand disease or adverse climate, will survive and reproduce, causing evolution.
What is a predator?
An organism that feeds on another organism (prey)
Predators have evolved to catch prey by...
- faster movement
- more effective camouflage
- better means of detecting prey
Preys have evolved to be more adept at avoiding predators by...
- better camouflage
- more protective features (eg spines)
- concealment behaviour
Define predation.
When an organism is consumed by another.
How is the distribution of organisms affected?
- Interspecific competition and predation will affect an organisms distribution
- Organisms will only exists where they can survive
- Eg no penguins in the Carribean
Why is sampling used when investigating populations?
- Impossible to count all the organisms of a species
- Want samples to be representative of the whole habitat / ecosystem → repeats
- Use sample data to estimate the total no. of individuals in the ecosystem.
Why is random sampling used?
-avoid bias
-be representative
-produce statistically significant results
When is random sampling used?
When a uniform distribution + abundance is expected
How many samples are used when conducting experiments? Why?
- Want data to be representative
- Large number = more reliable
- Too many is a waste of time and resources
- Enough to carry out a statistical test
When is a population size estimated using quadrats?
For slow-moving or non-mobile organisms... (eg plants, snails)
What are the assumptions made when estimating the size of a population using quadrats?
- Assuming population is evenly distributed when it isn't
- Abiotic factors cannot be controlled in a field
What are factors that need to be considered when using quadrats to estimate the size of a population?
- Size of the quadrat: depend on the size of the species
- The number of sample quadrats to record within the study: the larger the number the more reliable
- The position of each quadrat within the study area (sampling at random)
Describe a method of estimating the size of a population using randomly placed quadrats (uniform distribution only).
- Use a grid / split area into squares using a tape measure at a right angle to create gridded area
- Obtain random coordinates using a random number generator – place quadrats here to collect data
- Deciding the number of quadrats to use to collect representative data: (10% of area given)
- Enough to calculate running mean
- When enough quadrats, this shows little change
- Count frequency of species in quadrat
- OR Calculate density / per quadrat
- OR Calculate percentage cover: → if a square is more than 50% covered with a species
→ faster → dont count all individuals
- Repeat at least 30 times and calculate a mean → reliable, not due to chance
- Calculate population size by multiplying the mean by the number of quadrats that would cover the habitat
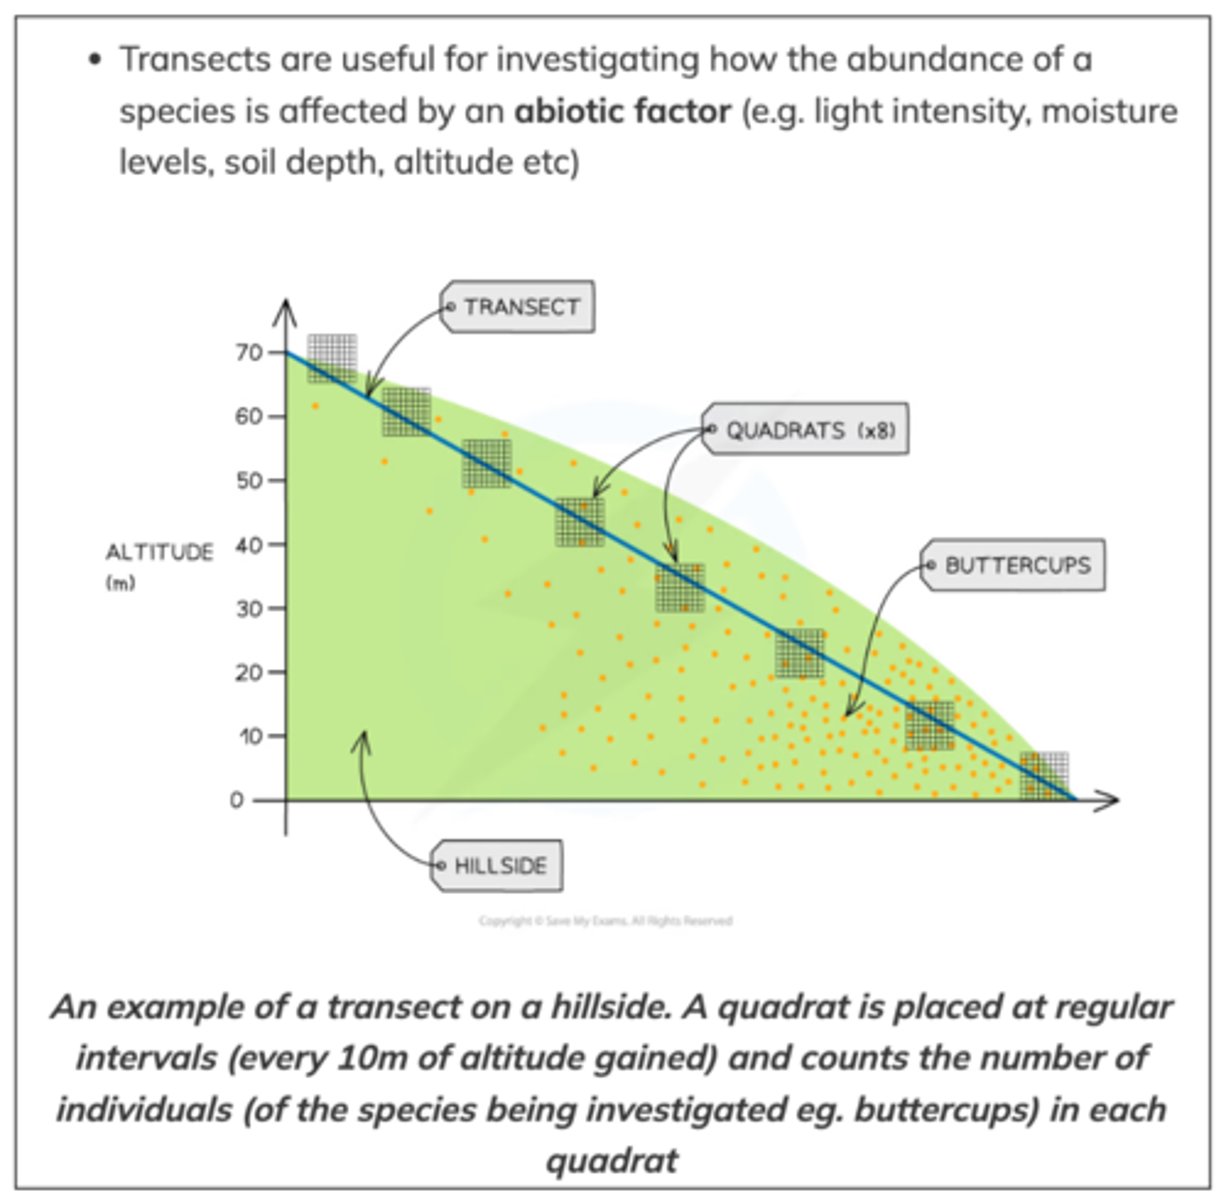
When are transects used to estimate the size of a population?
Uneven distribution (systematic sampling), used to look at changes in distribution, e.g.: sandy / rocky shores, across a path or river.

Describe a method of using quadrats along a belt transect to look at changes in distribution of population size.
- Lay down 3 transect belts / measuring tape from one place to another (two points) at a right angle to the shore line
- Place quadrats at regular intervals along the line of transect (e.g. every 5 metres)
- Record the data (frequency distribution of plant species changes in a line by counting percentage cover in quadrats as well as your chosen abiotic factor)
- Eg away from a high tide line
- And repeat by placing another 30 transects along the areas at right angles
- You can then present data on a scatter graph and perform a spearman’s rank correlation coefficient to determine if your results are statistically significant
Describe a line transect.
- Run a tape measure between two points
- Record all the species that touch the tape
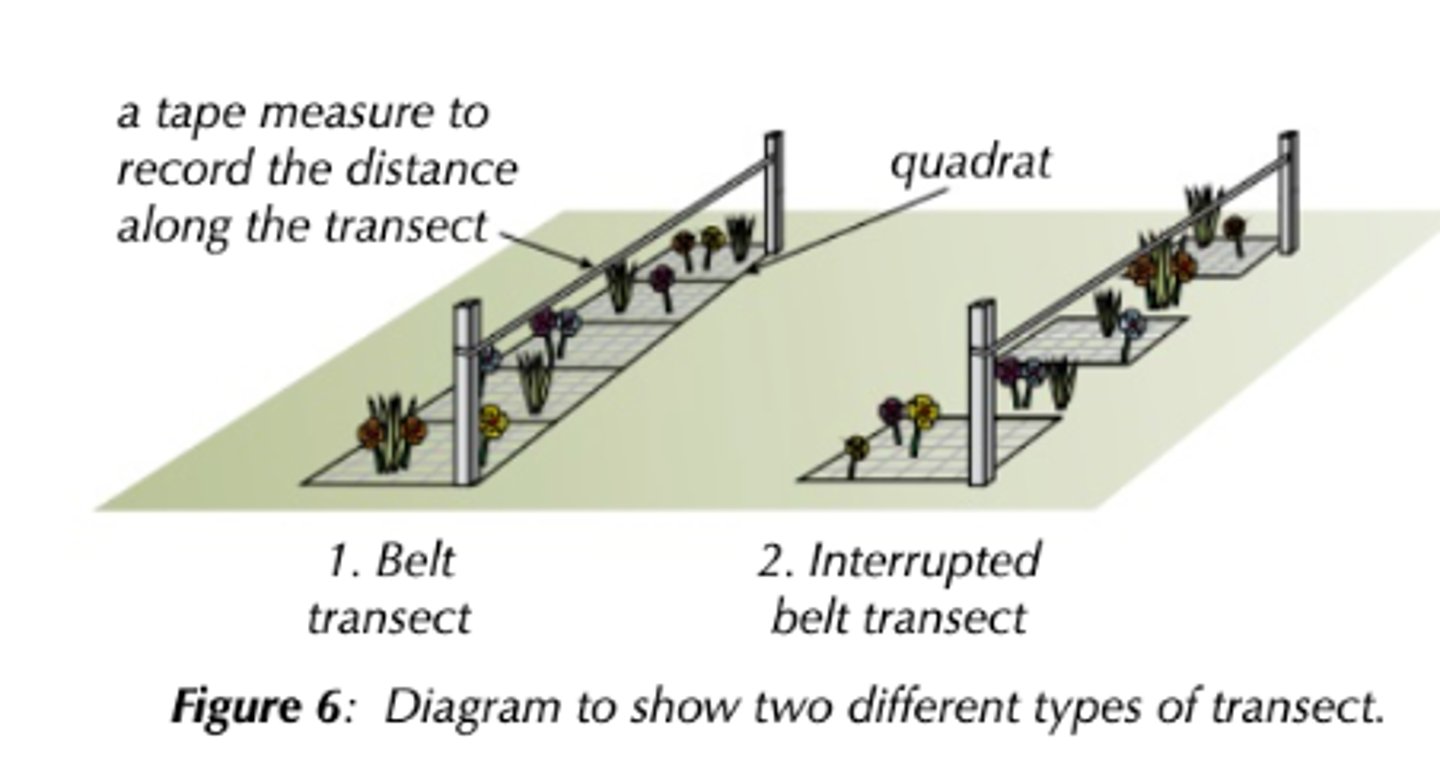
Explain the difference between a belt transect and an interrupted belt transect.
- Belt transects: quadrats placed next to each other along transect to work species frequency and percentage cover along transect
- Interrupted belt transects: instead of investigating whole transect you can take measurements using a quadrat placed at regular intervals, e.g. every two metre. This can make it easier to cover a large distance. (faster but give you less information than a belt transect)
When is mark-release-recapture used?
To estimate the size of a population of a mobile organism.
Describe the mark-release-recapture method.
1. Capture initial sample of species → appropriate method
2. Mark harmlessly and record number caught → doesnt affect their ability to feed or increase their chance of predation
3. and release
4. Leave enough time for organisms to randomly distribute before collecting second sample using same method as the first sample
Time = not too long → births / deaths, immigration / emmigration
5. Use equation, to estimate population size:
6. The more this is repeated, the more reliable
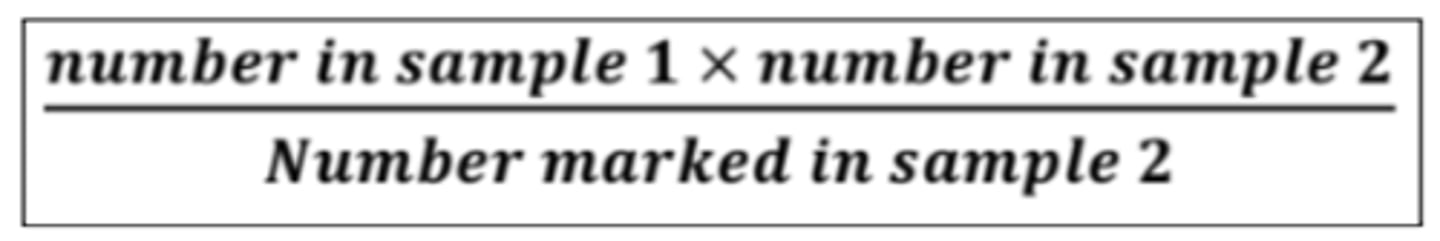
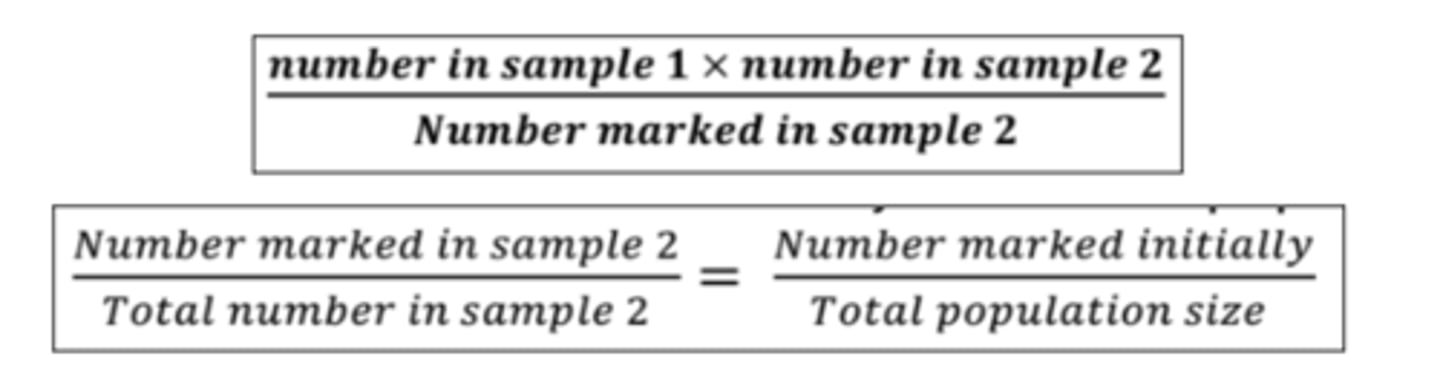
State the equation for estimating the population using the mark-release-recapture method.
It’s easier to remember this equation if you actually understand it:
- Based on the principle that the proportion of marked individuals in the second sample would be the same as was marked initially in the total population.
- This can be rearranged to form the equation for population size
What are the assumptions made when using the mark-release-recapture method:
1. Sufficient time for marked individuals to mix within the population (redistrubute evenly)
2. Marking not removed and doesn’t affect chances of survival e.g. more visible to predators
3. No immigration/emigration
4. No births/deaths/breeding / No losses to predation (or birth rate and death rate are equal)
5. Same sampling method
Why might some people think the mark-release-recapture method is unethical?
- Might cause unnecessary stress → reducing chances of survival after release
- Interfering with accuracy of estimates of population sizes
- Minimise stress by treating organisms carefully and handling them as little as possible
What are some considerations that must be taken into account when making the tag for the mark-release-recapture method?
- Colour: should not make it more visible to predators (increasing predation)
- Non toxic
- Must not reduce chances of reproduction
- Design: should not be easily caught or injure other organisms, no sharp edges
- Weight , size and shape: it shouldnt hinder movement
- Material: durable enough to last whole experiment
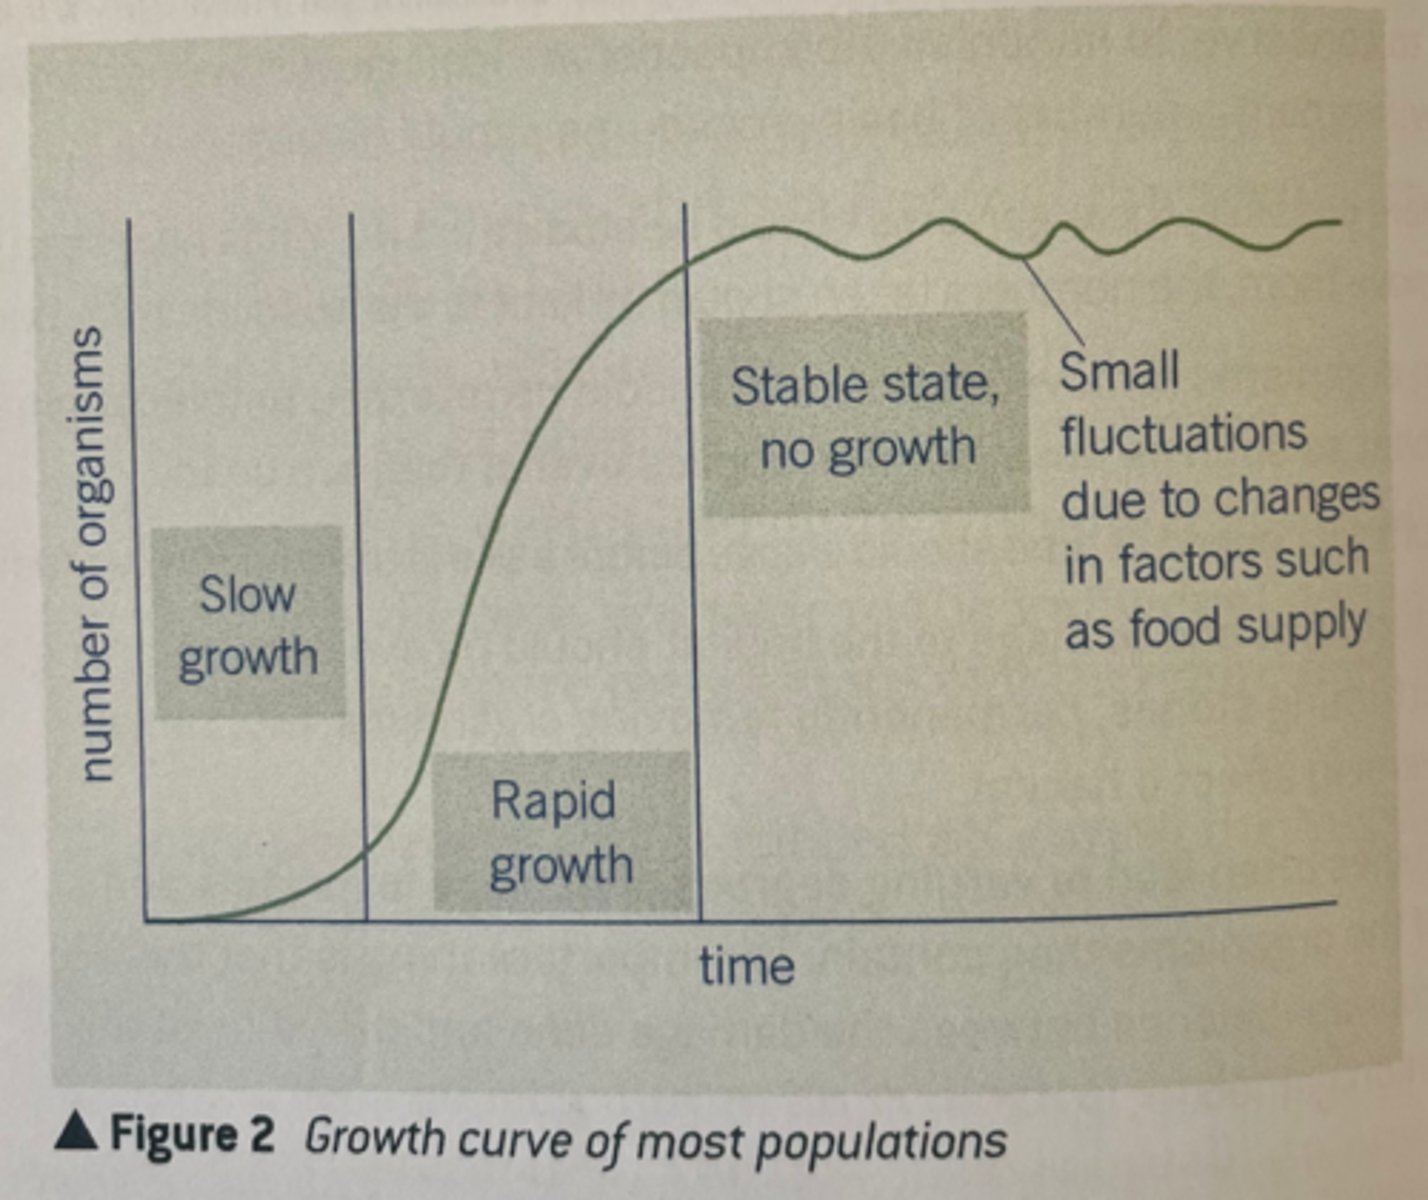
Describe population growth curves.
- Period of slow growth as initial number of individuals reproduce too slowly to build up their numbers
- Period of rapid growth where the ever-increasing number of individuals continue to reproduce. The population size doubles during each interval of time, as seen by the gradient of the curve (steep)
- Period where population growth declines until size remains more or less stable. Decline may be due to limiting food supply, or increased predation. Graph levels out with only cyclic fluctuations due to variations in biotic factors.
Define succession.
Process by which an ecosystem / community changes over time / a series of changes in species composition in a given place over time due to change in environmental / abiotic factors
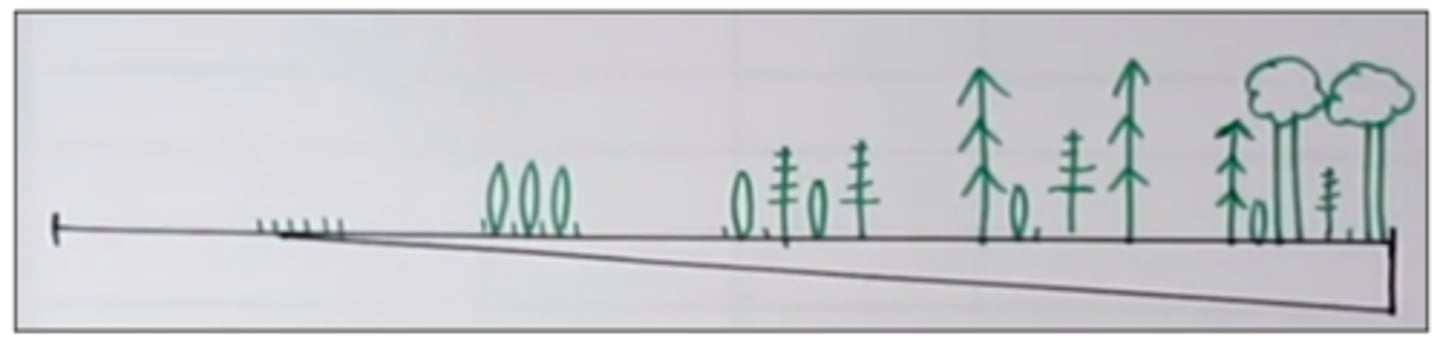
Describe succession.
1. Colonisation by pioneer species in area → usually due to spores and seeds blown in wind begin to grow
2. Pioneer species change the abiotic & environmental conditions and make the environment less hostile + increases stability e.g. die and decompose, forming a thin layer of soil, humus, which retains water OR increase in nutrients
3. These processes contribute to the formation of soil (e.g. decomposed by organisms and adding humus)
4. Environment becomes more suitable / favourable / less hostile for other species with different adaptations & enables them to colonise/survive, and may be less suitable for the previous species – better-adapted species (usually larger) outcompetes previous species
5. Continues and area becomes suitable for larger and more diverse species of plants and animals
6. At initial stages of succession, biodiversity changes + increases during initial stages of succession
7. Continues until climax community: final stage in succession, complex, stable community, few species dominate (dominated by trees)
As succession takes place many things change and increase such as...
- Soil / depth / hummus
- H2O + nutrient availability
- Biodiversity
- Plant height
- Niches
- Light intensity at ground level (DECREASES NOT INCREASES)
Pioneer species are adapted to...
Extremely unfavourable and harsh environments. This is their ecological niche. Due to the fact they can withstand such difficult conditions, they have little to no competition.
Name and describe a successful pioneer species.
Lichen: a composite organism that arises from algae or cyanobacteria living among filaments of multiple fungi species in a mutualistic / symbiotic relationship
- The algae/bacteria photosynthesise and provide the fungi with sugars
- The fungi house the algae.cyanobacteria, providing them with proteccion. The fungal filaments grow through the rock can absorb water and minerals, which are also shared with the algae/cyanobacteria
Define biomass.
The mass of living material in an ecosystem
Describe primary succession.
- Starts from newly formed land → e.g. volcanic rock / sand dune
- Harsh abiotic conditions → e.g. no soil / humus, little h2O / nutrients
- Very slow
- Pioneer species are often smaller than in secondary succession
Describe secondary succession.
- Starts from land where vegetation has been cleared → e.g. human deforestation / forest fire
- Less harsh abiotic conditions → e.g. soil already exists, more H2O / nutrients available
- Much faster
- Pioneer species can be larger
Describe deflected succession.
A community that remains stable only because human activity prevents natural succession from taking place → e.g. mowing / grazing
- Stops succession → tall plants cant grow as their tips are cut off
- Cannot out-compete low growing grass
- Grass land becomes climax community
Define climax community.
Final stage of community that is stable, one dominant species, a few co-dominant species.
- Different ecosystems have different abiotic conditions → they develop into different climax communities
- e.g, tropical rainforest vs temperature deciduous forest
Define climatic climax.
If the factor that is preventing further succession is removed, the ecosystem naturally develops into its climatic climax (secondary succession)
Describe what a plagioclimax is.
Human activities can prevent succession and stop a climax community forming
Define conservation.
Human management of the earths resources and typically involves the managing of succession. For example, the controlled burning of land is done in order to stop the formation of a climax community
State methods of conservation.
1. Management of succession [only one you need to know]
2. Seed banks
3. Captive breeding
4. Fishing quotas
5. Protected areas
Methods of conservation: management of succession. [the ONLY one you need to know]
Preventing succession in order to preserve an ecosystem in its current stage of succession. This is because their habitats have disappear as a result of succession or they have been outcompeted by other species.
- By maintaining earlier stages of succession and preventing climax community, a greater variety of habitats are conserved and so a greater range of species.
- There is conflict between human needs and conservation in order to maintain the sustainability of natural resources.
- E.g.: forests can be coppiced to provide timber for fuel and furniture, whilst still allowing the tree to survive
Methods of conservation: seed banks.
Store seeds from many different species → large numbers can be conserved in a small space and anywhere for long periods (cool and dry), must be regularly tested to see if they are still viable which can be expensive
Methods of conservation: captive breeding.
Breeding animals in controlled environments (endangered animals) to increase their numbers, then reintroduce them into the wild (could bring new diseases)
Methods of conservation: fishing quotas
limit the number of certain fish species that fishermen can catch (conflict between human needs and conservation needs)
Methods of conservation: protected areas
protect habitats and species by restricting urban & industrial development + farming.
State reasons for conservation.
- Ethical: respect for living things
- Economic: genes in living organisms may be valuable in the future
- Cultural and aesthetic: they enrich our lives
Required practical: method: a laboratory-based investigation of the effect of competition on seedling growth (interspecific and intraspecific competition)
• 5 Petri dishes
• Black marker pen and ruler
• Filter papers to fit base of Petri dishes
• Seeds
• Boiled water
• Forceps
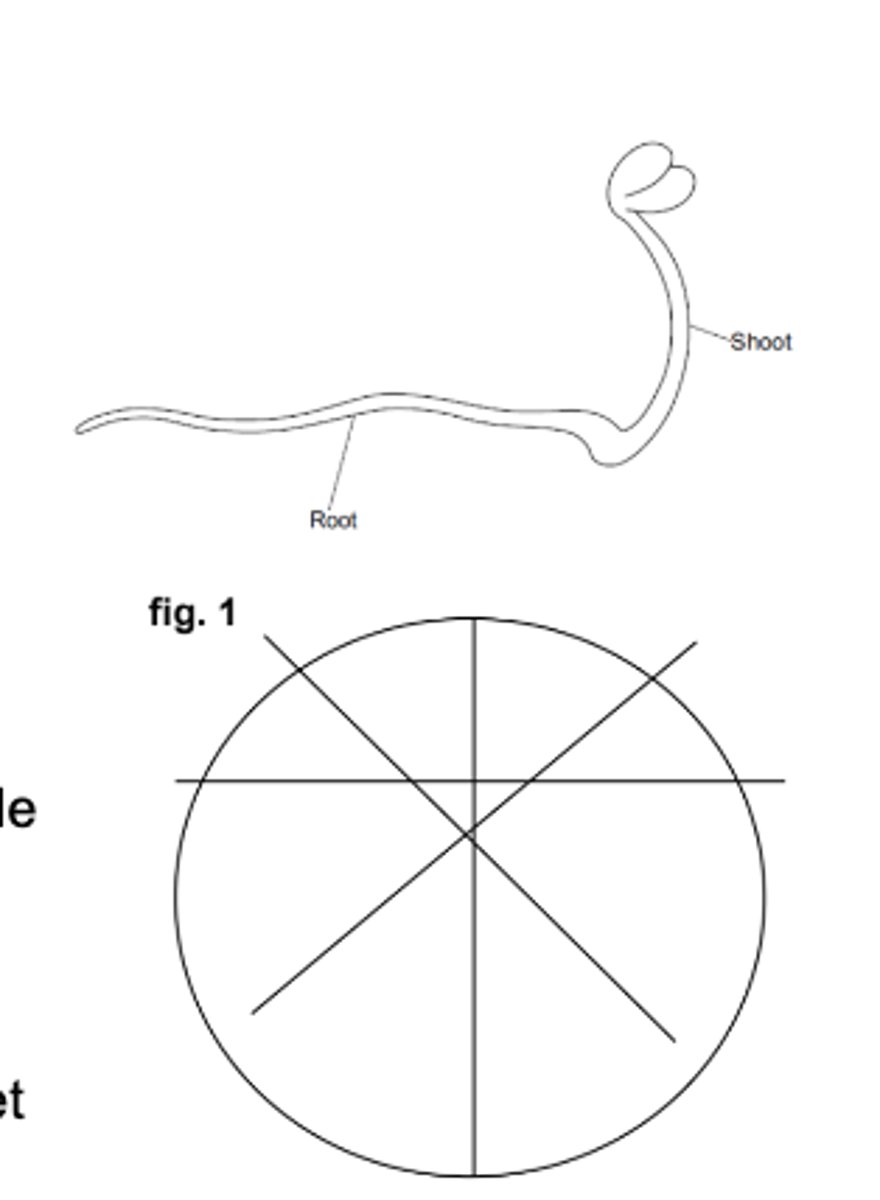
1. Turn the base of the Petri dish over and on the outside of the dish divide the area into segments using the marker pen (figure 1). Do this for each dish.
2. Place a filter paper in each Petri dish base. Add the same amount of water to each dish. This should be enough to ensure the filter paper is wet but there should be no surface water.
3. In the first Petri dish place one seed in the middle of each segment. In the second Petri dish place two seeds in each segment. Continue to place seeds in the remaining dishes increasing the number of seeds in each segment each time, so the last dish has 5 seeds in each segment.
4. Place the lids on each Petri dish. Put all the dishes together in a dark box or cupboard.
5. Observe the seeds at the same time each day and record the number of seeds that have germinated.
6. After about 3 days remove the seedlings and measure the growth of shoot and root.
7. Record your results in a suitable table.
8. Process your data and carry out a statistical test to see if there is a significant difference in germination and initial growth in the seedlings at different densities of sowing.
Q: Ecologists studied a community of fish in a lake. They found that each species of fish had adaptations to its niche. One of these adaptations was the shape of its mouth.
Suggest how the shape of mouth is an adaptation to its niche. (2 marks)
- With different mouth eats different food / has different way of feeding / specific mouth shape for specific food
- Competition between species / interspecific competition is reduced
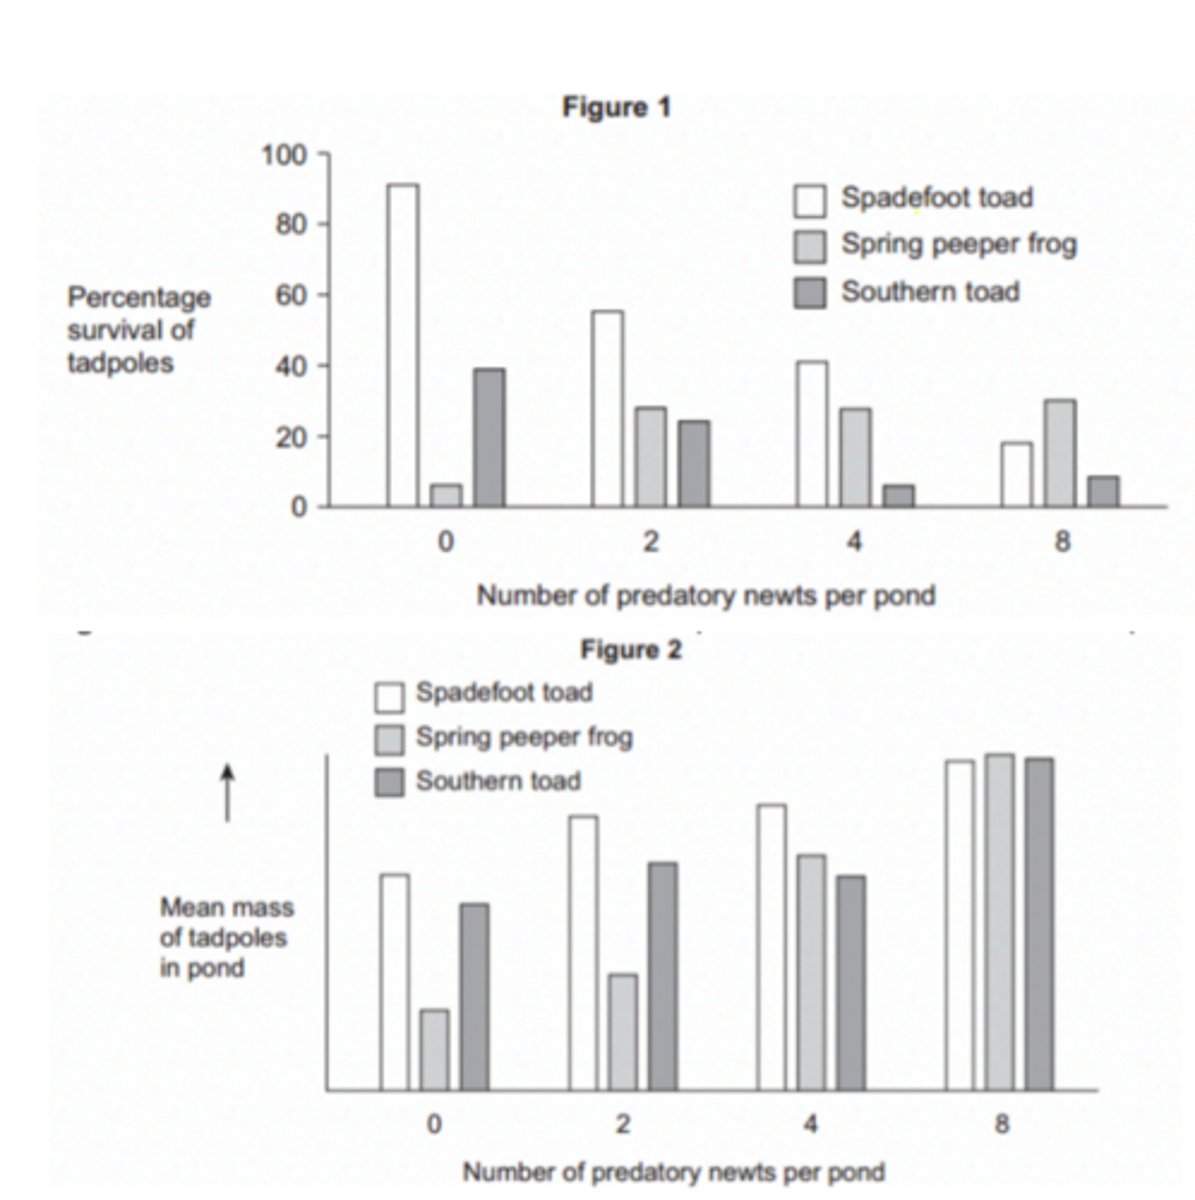
Q: The young of frogs and toads are called tadpoles. Ecologists investigated the effect of predation on three species of tadpole. They set up four artificial pond communities. Each community contained
• 200 spadefoot toad tadpoles
• 300 spring peeper frog tadpoles
• 300 southern toad tadpoles
The ecologists then added a different number of newts to each pond. Newts are predators. Figure 1 shows the effect of increasing the number of newts on the percentage survival of the tadpoles of each species.
(a)(i) Describe the effect of an increase in the number of newts on the percentage survival of the tadpoles of each of the toad species. (2 marks)
(a)(ii) Suggest an explanation for the effect of an increase in the number of newts on the percentage survival of the tadpoles of spring peeper frogs. (2 marks)
(b) Using the information provided in figure 1 explain the results obtained in figure 2. (2 marks)
(a)(i) - Decrease in spadefoot toad
- Decrease in southern toad up to 4 newts per pond, then increase (at 8 newts per pond)
(a)(ii) - Predators/newts eat/feed/prey on toad (tadpoles)
- Less competition / more food/resources / fewer toads feeding on frogs
(b) - Fewer toads/tadpoles (as number of predators increases in figure 1)
- More food, so are larger / grow more / increase in mass
Q: The bluebell is a flowering plant found in woodlands. Global warming has been associated with a change in the population of bluebells. Describe how you could estimate the number of bluebells in a small woodland. (5 MARKS)
- Use a grid / split area into squares
- Method of obtaining random coordinates / numbers, e.g. calculator/computer/random numbers table/random number generator
- Count number/frequency of plants in a quadrat
- Calculate mean/average number (per quadrat/section)
- Valid method of calculating total number of bluebells e.g. mean number of plants per quadrat/section/m2 multiplied by number of quadrats/sections/m2 in wood
Q: A student used the mark-release-recapture technique to estimate the size of a population of sand lizards on an area of moorland. She collected 17 lizards and marked them before releasing them back into the same area. Later, she collected 20 lizards, 10 of which were marked.
Calculate the number of sand lizards on this area of moorland. Show your working. (2 MARKS)
- 17 x 20 / 10
- = 34
Q: Ecologists studied a community of fish in a lake. The ecologists could have used the mark-release- recapture method to estimate the number of one species of fish in the lake. However, this species of fish breeds at a certain time of the year. During this fish-breeding season, the mark-release-recapture technique might not give a reliable estimate. Suggest one reason why. (1 MARK)
- One suitable reason e.g. population increases/changes (between first and second sample)
Q: Blue tits are small birds that live in woods. An ecologist estimated the size of the blue tit population visiting gardens near a wood in November.
• She trapped 28 blue tits. She marked all of these birds with small metal rings on their legs.
• Two weeks later, she trapped another sample of blue tits. Of these birds, 18 were marked and 20 were not marked.
Use the data to estimate the size of the blue tit population. Show your working. (2 MARKS)
- 28 x 38 / 18
- = 59
Q: Blue tits are small birds that live in woods. An ecologist estimated the size of the blue tit population visiting gardens near a wood in November.
• She trapped 28 blue tits. She marked all of these birds with small metal rings on their legs.
• Two weeks later, she trapped another sample of blue tits. Of these birds, 18 were marked and 20 were not marked.
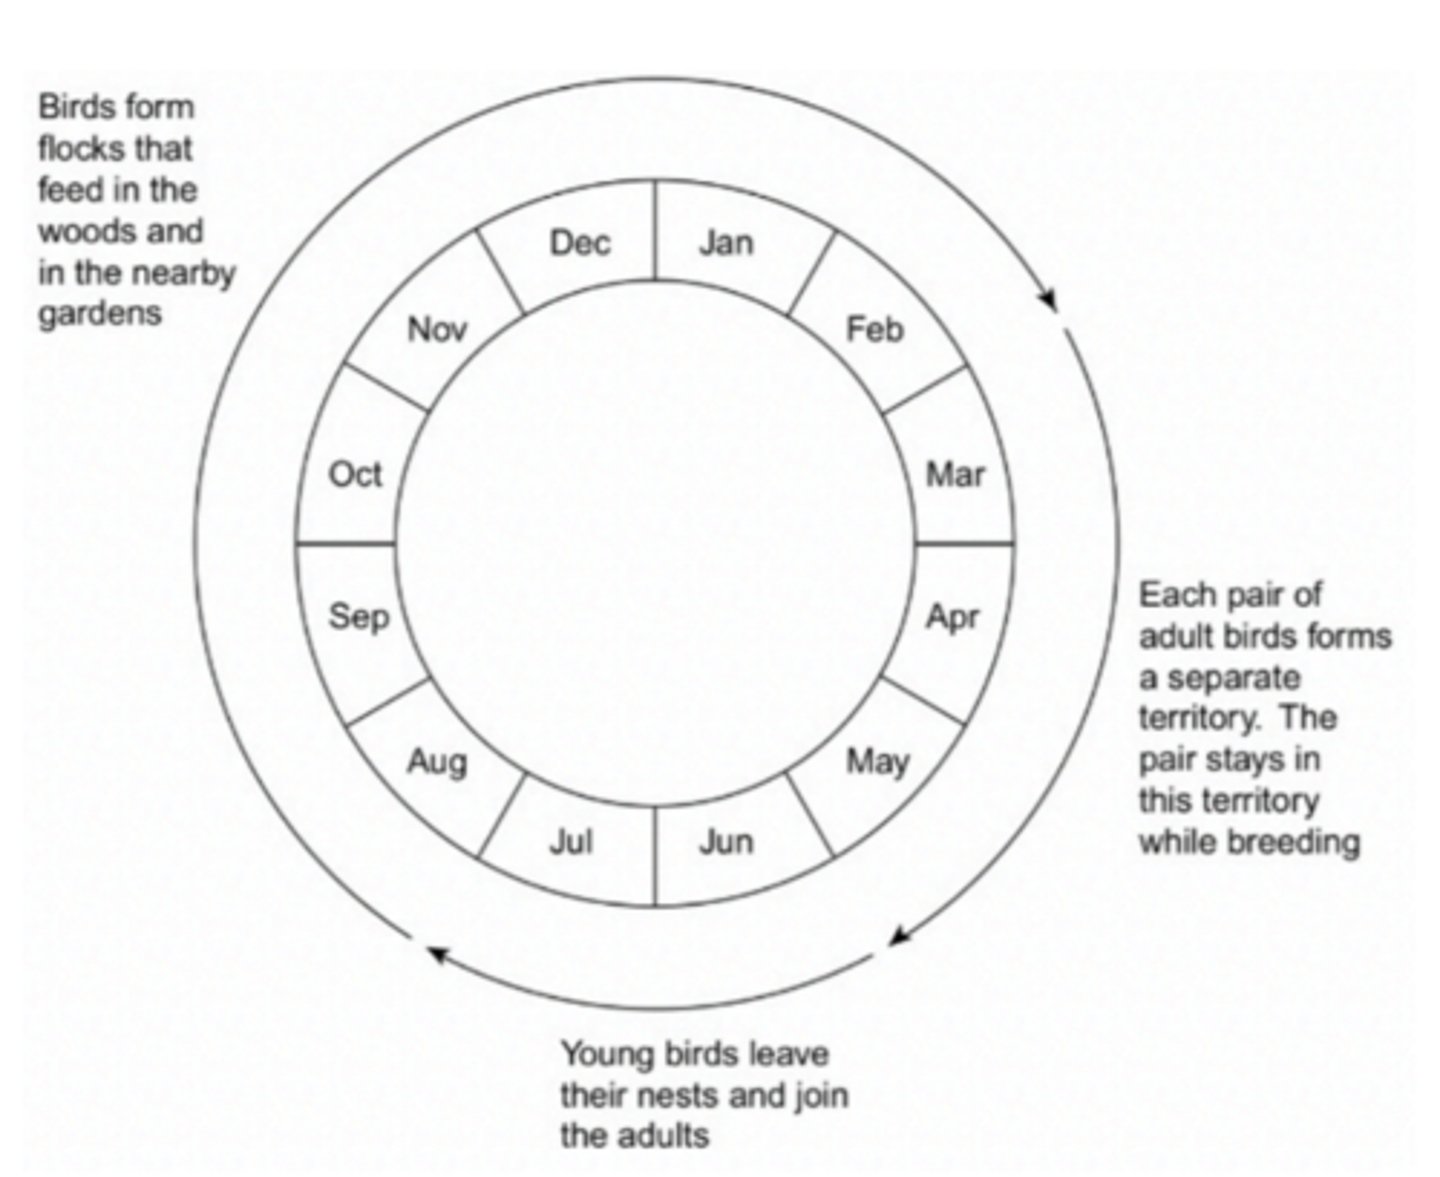
The diagram shows some features of blue tit behaviour at different times of the year.
(b)(i) Using mark-release-recapture to estimate the size of a blue tit population in June would not give reliable results. Explain why. (2 MARKS)
(b)(ii) Using mark-release-recapture to estimate the size of a blue tit population in March would not give reliable results. Explain why. (2 marks)
(b)(i) - Population changes
- As young birds leave nest/join population
(b)(ii) - (would be likely to) catch all birds (again) in second sample / sample sizes are the same
- Birds (in territories and) not mixing with population
- Only estimates number of birds in territories sampled / territory sample not representative (of population)
Q: Blue tits are small birds that live in woods. An ecologist estimated the size of the blue tit population visiting gardens near a wood in November.
• She trapped 28 blue tits. She marked all of these birds with small metal rings on their legs.
• Two weeks later, she trapped another sample of blue tits. Of these birds, 18 were marked and 20 were not marked.
The diagram shows some features of blue tit behaviour at different times of the year.
Whales spend most of their time deep in the sea but they come to the surface to breathe. When they are at the surface, scientists obtain small samples of their skin. The scientists find the base sequence in some of the DNA from these samples. The base sequence is different in each whale.
You could use the information about the base sequence to estimate the size of the whale population by using mark-release-recapture. Explain why. (2 MARKS)
- (Recording) DNA / base sequence is like marking / wouldn't need to mark
- Finding identical / same base sequence would show animal has been caught / recorded before
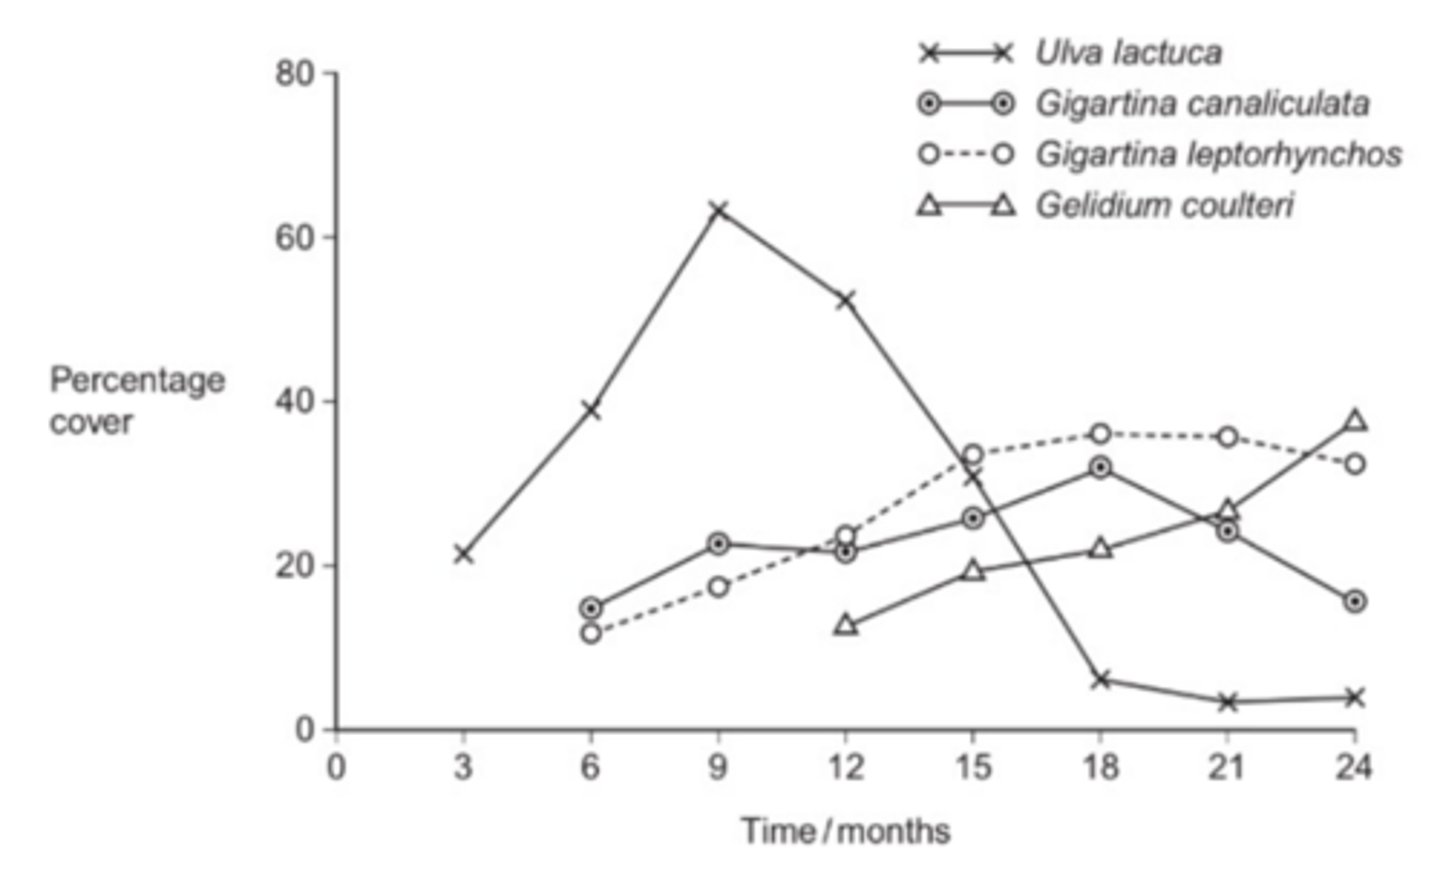
Q: Algae are photosynthesising organisms. Some algae grow on rocky shores. A scientist investigated succession involving different species of algae. He placed concrete blocks on rocky shore. At regular intervals over 2 years, he recorded the percentage cover of algal species on the blocks. His results are shown in the graph.
(a) Name the pioneer species (1 MARK)
(b) Use the results of this investigation to describe and explain the process of succession (4 MARKS)
(a) Ulva lactuca
(b) - Pioneer species / Ulva increases then decreases
- Principle of a species changing the conditions / a species makes the conditions less hostile
- New/named species better competitor / previous/named/pioneer species outcompeted
- G. coulteri increases and other/named species decreases
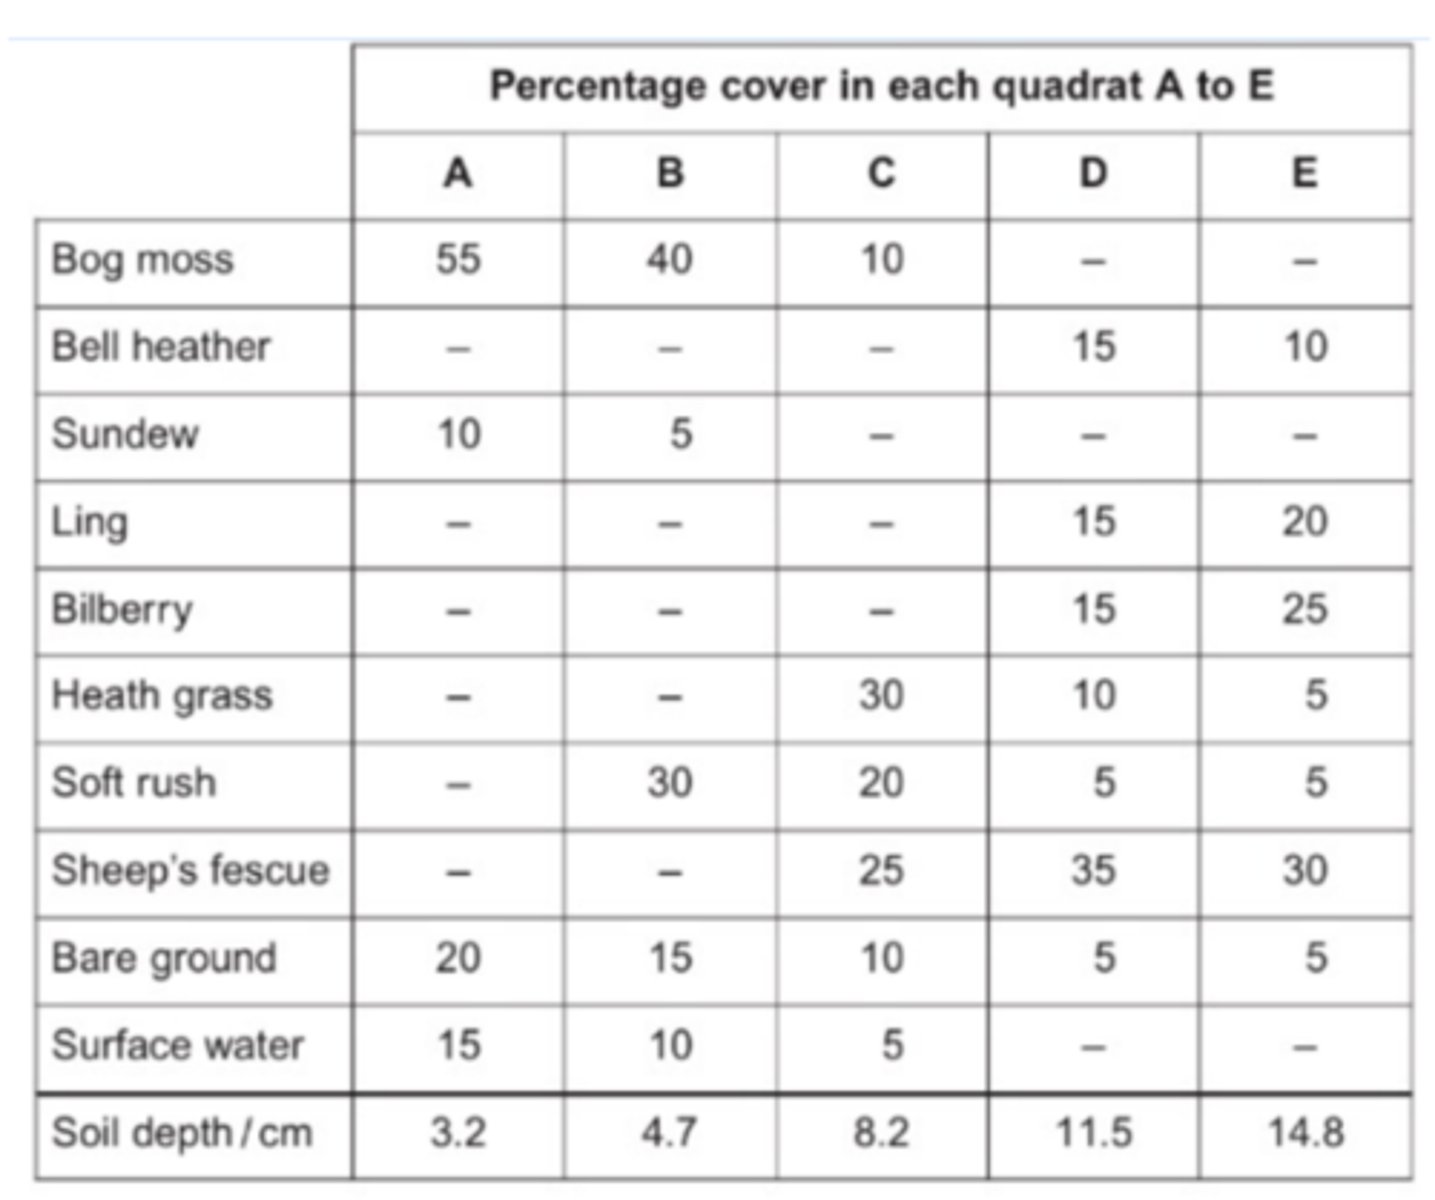
Q: A student investigated an area of moorland where succession was occurring. She used quadrats to measure the percentage cover of plant species, bare ground and surface water every 10 metres along a transect. She also recorded the depth of soil at each quadrat. Her results are shown in the table.
(a) Explain how these data suggest that succession has occurred from points A to E along the transect. (3 MARKS)
(b) The diversity of animal species is higher at E than A. Explain why. (2 MARKS)
(a) - Decrease in (percentage cover) of bare ground/water linked to more plants/species / increase in plant coverage
- Change in diversity / number of plant/species/named(species) as abiotic conditions altered / due to competition / more soil / less hostile
- Increase in depth of soil as plants die / humus formed
(b) - Greater variety of food / more food sources
- More/variety of habitats/niches
Q: Humans introduced rats to New Zealand. These introduced rats affected the numbers of native birds. Rats eat a wide variety of animal and plant food. Suggest two ways in which rats may have affected the numbers of native birds. (2 MARKS)
- Eats same food as native birds
- Eat native birds / eggs / young of native birds
Q: Farmers were offered grants by the government to plant hedges around their fields. Explain the effect planting hedges could have on the index of diversity for animals. (3 MARKS)
- Greater variety of plants
- Another habitat / more habitats / places to lives / niches
- Another food source / more food types
Q: Fur seals live in Antarctic seas. They feed on fish and shrimp-like animals called krill. Scientists suggested that an increase in the fur seal population was due to an increase in commercial whaling. Many species of whale living in Antarctic seas feed on krill. Explain how an increase in whaling might have resulted in an increase in the seal population. (2 MARKS)
- Fewer whales mean more krill OR more krill - feeding fish
- More food for seals
Q: Other than temperature, suggest one abiotic factor that is likely to affect the growth of trees on a mountain. (1 MARK)
Any abiotic factor that may limit photosynthesis/growth (reject altitude/height) e.g. water, light, carbon dioxide (accept oxygen), incline, wind or named soil factor (not soil / weather)
Q: Hydrilla (Hydrilla verticillata) is an aquatic plant which has become a major pest of waterways in parts of the USA. Hydrilla is not a native species of the USA. It was introduced into natural habitats from aquariums. In many freshwater habitats it has rapidly become the dominant plant species. Suggest two reasons why. (2 MARKS)
- No / few consumers / pests / pathogens (accept no / few predators)
- Outcompetes / better competitor for resources / light / CO2 / abiotic factor or ideal niche
Q: Sarawak is an area of tropical rainforest in south-east Asia. Logging has been allowed in 60% of the forest. A study was carried out into the effects of logging on the diversity of mammal species living in the forest.
An area of rainforest was sampled before logging, immediately after logging and then again two years and four years after logging. The results of the investigation demonstrated that the number of small squirrels increases initially, immediately after and two years after logging, but then decreases.
Suggest, using your knowledge of factors affecting population growth, why the small squirrel population in this rainforest does not increase in size indefinitely. (4 MARKS)
- Limiting / density dependent factors OR reaches carrying capacity
- (intraspecific) competition for food / nesting sites
- (interspecific) competition with other animals
- Predation / parasites / diseases