Biostats- Summarizing data & Quantifying disease
1/45
There's no tags or description
Looks like no tags are added yet.
Name | Mastery | Learn | Test | Matching | Spaced |
|---|
No study sessions yet.
46 Terms
Why do smaller/rural countries have highest and lowest kidney cancer rates ?
Due to natural variability
population characteristics, access to healthcare, and environmental factors
How can level of variability/uncertainty in results be accounted for ?
Probability, sampling distributions, confidence intervals, hypothesis testing
What are the two main categories for summarizing data with graphics ?
Categorical & quantitative
What are the two types of categorical graphics ?
Bar charts & pie charts
What are the five types of quantitative graphics ?
Histograms, box plots, scatter plots, bar charts, stem/leaf plots
What are the 3 types of categorical data ?
Nominal, ordinal, and binary
Categorical nominal data
Order of categories is irrelevant/unordered such as colors, brands, or species.
Categorical ordinal data
Order of categories is relevant/ordered/ranked such as socioeconomic status, education level, or satisfaction ratings.
Categorical binary data
Only 2 possible values (dichotomous) such as yes/no or female/male
Quantitative discrete data
Values equal to integers or whole numbers that can be counted such as the number of students in a class or number of cars in a parking lot.
Quantitative continuous data
Values that can take any number within a range and are measurable, such as height or weight.
How can we summarize categorical data with numbers ?
proportions (percent) of observations in each category
using counts/# in each category (frequency)
*IMPORTANT: provide totals such as denominators of percentages
Categorical data: Pie chart
Variable pictorial that displays percentage of whole
requires proportional reasoning so not best form to estimate/summarize data (common in media/non expert reports)
most appropriate when aims to convey relative size of parts of whole (usually around 3-7 categories )
Categorical AND quantitative data: Bar chart
Represents summary measure for each category
X axis indicates category and y is percentage of observations
Alphabetize for easier understanding
What are factors observed in quantitative data ?
most common/average center of data
variability/how spread out is data
outliers/values far from bulk of data
Quantitative data: Histogram
Graphical representation of the distribution of numerical data
X axis corresponds to values of quantitative variable in contiguous series of subintervals
Bars indicate frequency/percentage of observations within interval
Displays variation, shape of distribution, outliers, and approximate freq/percentage in given range
*# of bins = square root of # of observations (to avoid unequal widths)
Quantitative data: Stem & leaf plot
Stem = first digits & Leaf = remaining digits
shows variation, shape of distribution, outliers, actual measurements, and typical values
What is central tendency ?
Way to decribe middle of data in quantitative data
Key differences in mean vs median
Mean is sensitive to extreme values while median is resistant to outliers
sym data means mean = median
for right skew: mean > median
for left skew: mean < median
Standard deviation
A measure of the amount of variation or dispersion in a set of values (indicates how many individual data points differ from the mean) and is calculated as the square root of the variance.
Computing standard deviation
Interquartile range
Upper quartile range - lower quartile range
A measure of statistical dispersion that represents the middle 50% of data.
*IQR less sensitive to outliers
Which two statistical variables are sensitive to outliers ?
Range and SD
Range increases w sample size
How should mean and median be reported ?
Mean = SD
Median = IQR
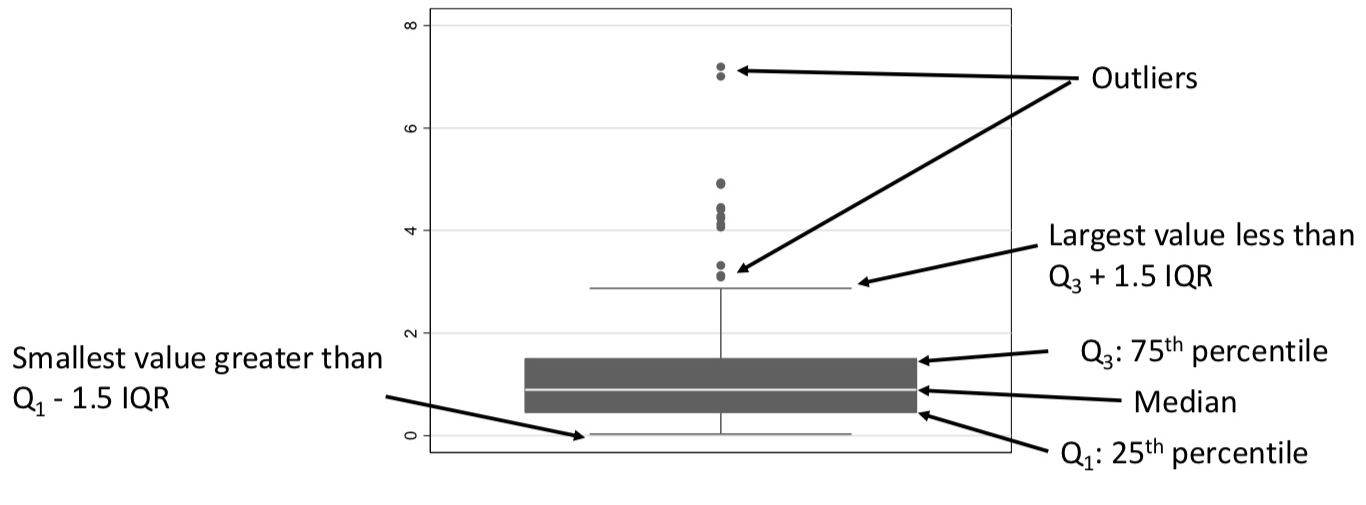
Quantitative data: Box plots
Displays median, quartiles, and range of data
Outer whiskers found by multiply IQR * 3
*anything outside from whiskers = outliers
Quantitative data: Scatter plot
Illustrates relationship between two quantitative variables, where each point represents an observation. It helps identify trends, correlations, and potential outliers in the data.
What is correlation in statistics ?
Numerical description of strength of linear asssociation btwn 2 variables in correlation
-denoted by “r” and ranges btwn -1 to 1
r>0 indicates higher values of one variable correspond to higher of the other
r<0 indicates higher values of one variable corresponds to lower of the other
r +- 1 indicates perfect linear relationship
r=0 indicates no linear association
What is cumulative incidence (CI) ?
Proportion of a population that develops a condition over a specified time period
CI = # of new cases/ # of of pop at risk
What are contingency tables used for ?
For organizing/summarizing categorical data to examine the relationship between two or more variables. They display the frequency distribution of variables, allowing for analysis of associations and testing of independence.
What is placebo ?
A substance with no therapeutic effect used as a control in testing new drugs to compare effects against an active treatment.
What is risk factor ? What can it tell us ?
Variabel that may increase/decrease change of risk for outcome
Guides preventative measures
Does risk (of treated) = risk (of untreated)
Risk (of treated) = CI (of treated) = # of colds/ # of treated
What is relative risk ?
Risk (treated)/ risk (untreated)
0<RR<infinity
if RR < 1, treatment associated w lower risk of outcome
if RR > 1, treatment associated w higher risk of outcome
if RR = 1, no association of treatment w outcome
Examples
• RR = 1.1, treatment associated with a 10% higher risk
• RR = 2.5, treatment associated with a 2.5-fold (or 150%) higher risk
• RR = 0.6, treatment associated with a 40% lower in the risk
Can relative risk be associated with causal interpretations on certain study designs ?
if RR < 1, treatment lowers (or decreases) risk. I.e. treatment is beneficial
• if RR > 1, treatment increases risk
• if RR = 1, no effect of treatment on outcome
What is risk difference ?
RD = Risk (treated) - Risk (untreated)
• -1 < RD < 1
• If RD < 0, treatment is associated with lower risk of outcome
• if RD > 0, treatment is associated with higher risk of outcome
• if RD = 0, no association of treatment with outcome
Can relative difference be associated with causal interpretations on certain study designs ?
RD = 0.10 treatment is associated with a 10% point higher risk. E.g., an increase of 10 cases for every 100 people, if the RD can be interpreted causally.
RD = -0.20 treatment is associated with a 20 % point lower risk
Relative risk vs Relative difference ?
Both are measures of association btwn risk factors & outcome
RR = 0.9: treatment means a 10% decrease in risk
RD = -0.1: treatment means 10 percentage point decrease in risk
Relative risk vs Relative difference EX
Relative Risk = (17/139) / (31/140) = 0.12 / 0.22 = 0.55
• In this study, risk of a cold for a child taking Vitamin C daily was 55% of the
risk of a cold for a child not taking Vitamin C daily
Risk Difference = (17/139) - (31/140) = 0.12 - 0.22 = -0.10
• In this study Vitamin C was associated with a 10 percentage point lower risk of a cold
What is incidence rate ?
# of new events / total person follow-up time
Unit are often per person-years
Right censored if person being followed dropped out
Incidence rate EX
Total person follow-up time = 18+6+12+18+18+9+12 months = 93 person-months or 7.75 person-years (since 93/12 = 7.75
Number of new events = 2 events
IR = 2 events/7.75 person-years = 0.26 events/person-year or 26 events/100 person-years
Biggest difference between CI and IR ?
CI can’t be calculated when there are drop outs, unlike IR
What is incidence rate ratio ?
A measure comparing the incidence rates of two groups, calculated as the ratio of the incidence rate in the exposed group to that in the unexposed group.
• If IRR < 1, treatment is associated with lower risk of outcome
• If IRR > 1, treatment is associated with higher risk of outcome
• If IRR = 1, no association between treatment and outcome
What is incidence rate difference ?
IR (of treated) - IR (untreated)
• If IRD < 0, treatment is associated with lower risk of outcome
• If IRD > 0, treatment is associated with higher risk of outcome
• If IRD = 0, no association between treatment and outcome
What is prevalence ?
The proportion of a population found to have a condition at a specific time, encompassing both new and existing cases.
does not reflect when condition began/how long its existed
only measures risk of having disease
Prevalence ratio
PR = Prevalence (exposed) / Prevalence (unexposed)
PR < 1: exposure is associated with lower prevalence
PR > 1: exposure is associated with higher prevalence
PR = 1: no association between exposure & outcome
Prevalence differences
PD = Prevalence (exposed) - Prevalence (unexposed)
PD < 0: exposure is associated with lower prevalence
PD > 0: exposure is associated with higher prevalence
PD = 0: no association between exposure & outcome