Depth Study 1: Climate Change
1/60
There's no tags or description
Looks like no tags are added yet.
Name | Mastery | Learn | Test | Matching | Spaced |
|---|
No study sessions yet.
61 Terms
Weather
Short term atmospheric conditions in a specific place at a specific time. Day to day.
Elements of Weather
Temperature - hot or cold air
Humidity – amount of water vapour (moisture) in air.
Precipitation
Wind - movement of air
Air Pressure - force exerted by atmosphere to Earth's surface
Cloud Cover - amount of /type of clouds in sky
Visibility
Climate
Long term average of weather patterns over decades or centuries in a particular region. Generally calculated 30 years.
Factors affecting climate
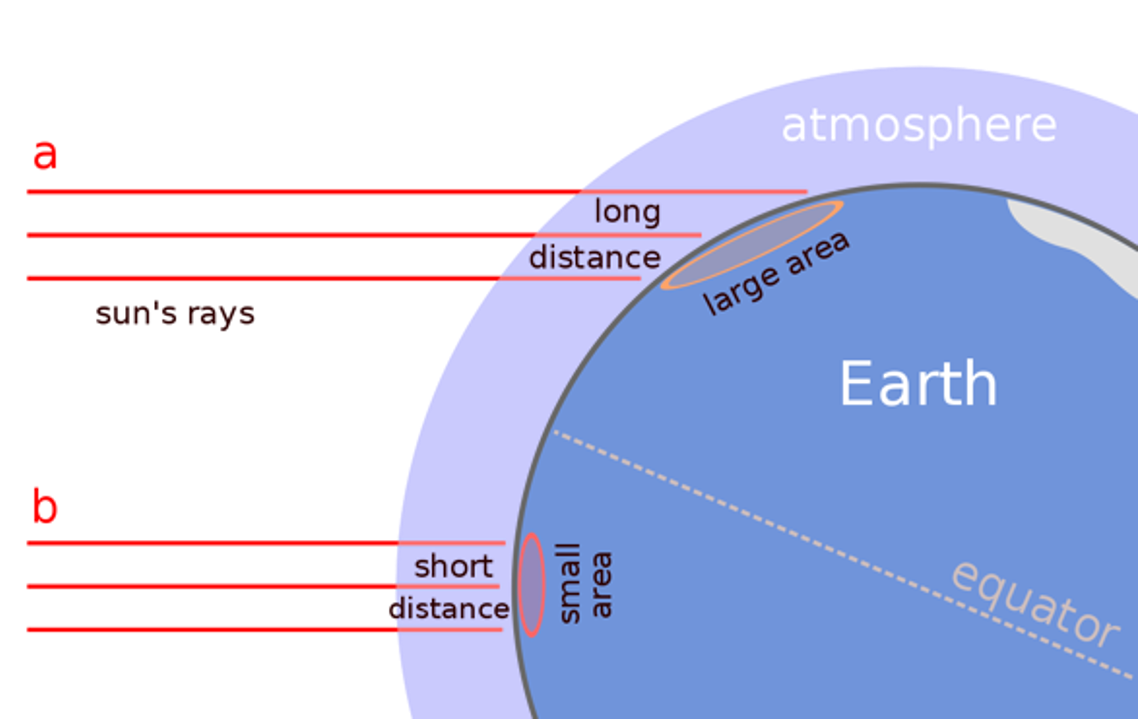
Latitude - closer to equator, warmer .
Altitude - higher altitudes are cooler due to thinner air.
Distance from sea-coastal = milder, inland= extreme
Ocean Currents - warm vs cold currents.
Wind and air masses- winds bring different masses.
Topography (Relief) - mountains block wind + precipitation.
Solar Radiation
Human Activities
The Earths climate
Cycling between periods of glacial and interglacial periods. Driven by internal dynamics of Earths systems and by external forces.
Has fluctuated gradually throughout history over long periods of time until modern times when changes have become rapid.
Anthropogenic climate change is one of the greatest environmental, social, economic and political changes.
Climate variability
Year to year variation in monthly seasonal calendars
Climate change
A long term shift in the statistical distribution of weather patterns over periods of time. It may be a change in the average weather condition or a change in the distribution of weather events with respect to an average.
Albedo
The amount of radiation reflected by a surface. Measured on a scale of 0-1 where 0 is no reflection and 1 is 100% reflection. Lighter surfaces reflect more than darker ones.
Earth reflects around 1/3 of insolation.
Rainfall
Key process in hydrological cycle that facilitates exchange of water from atmosphere from Earth’s surface.
As air rises, it cools and the moisture within it condenses or coalescing into clouds. If enough coalescence occurs, rainfall is produced.
Earths average is around 1000mm a year.
Areas of high rainfall
LOW LATITUDES NEAR EQUATOR:
COASTAL AREAS
WESTERN FACING COASTLINES
REGIONS ON WINDWARD SLOPES OF MOUNTAINS
Rainfall: LOW LATITUDES NEAR EQUATOR:
Strong heating from sun creating uplift of moist air. Forms equatorial lows, thunderstorms etc.
-In tropics, annual rainfall of 2500mm.
-Cherrapunji in NE India up to 10 000mm a year.
Rainfall: COASTAL AREAS
Ocean water evaporates into air, water vapor forms rainfall and is carried in by trade winds.
Rainfall: WESTERN FACING COASTLINES
Weather typically moves West to East due to Earths rotations and atmospheric jet streams. Western facing coastlines receive around 2500mm of rainfall.
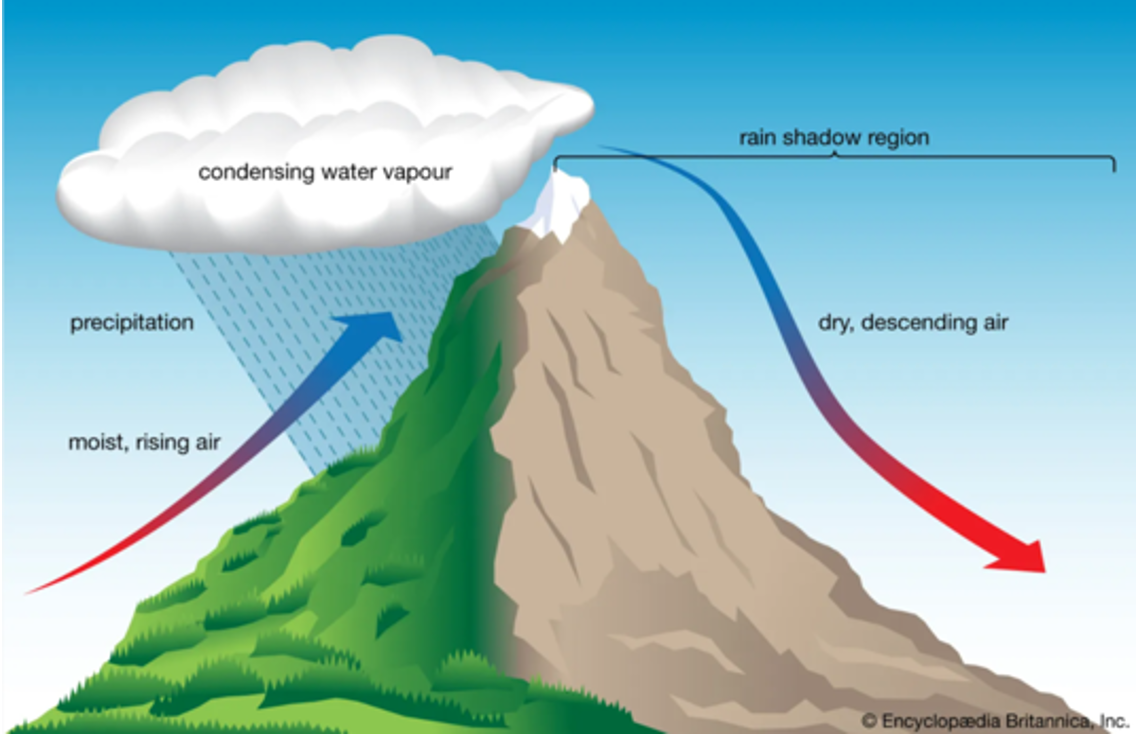
Rainfall: REGIONS ON WINDWARD SLOPES OF MOUNTAINS
OROGRAPHIC EFFECT: occurs when air masses are forced to flow over high topography. As air rises over mountains, it cools and water vapor condenses causing rainfall.
Areas of low rainfall
REGIONS OF HIGH PRESSURE
POLAR REGIONS AT HIGH LATITUDES
INLAND AREAS
REGIONS ON LEEWARD SLOPES OF MOUNTAINS
Rainfall: REGIONS OF HIGH PRESSURE
Cool air descending. reduces condensation Sahara Desert receives 250mm a year. Deserts in subtropical regions 23.5-45º N/S
Rainfall: POLAR REGIONS AT HIGH LATITUDES
60-90 N/S. Lack of evaporation means suns energy is dispersed over a large area. Air is too cold for moisture. Antarctica = driest continent = 166mm / year
Rainfall: INLAND AREAS
Away from large water bodies. Air dries as it moves further from its source. Kalgoorlie = 600km inland = 260mm / year
Rainfall: REGIONS ON LEEWARD SLOPES OF MOUNTAINS
Most moisture has been condensed and precipitated out on windward slope. Rain shadow effect. Himalayan mountains rain shadow the Gobi Desert in China
Rainfall and temperature distribution paragraph.
Equatorial regions at low latitudes receieve high insolation, leading to high levels of evaporation and raingall For example, Cherrapunji in India receives over 10000mm of rainfall annually. Polar regions around 60-90 degrees N/S experience a lack of evaporation and condensation, causing little rainfall. For example, Antarctica receives 100mm a year. Areas of high temperature are located close to the equator (25-40º N/S) as they receive more direct insolation. For example, the Tanami deserts in Australia receives temperatures up to 57ºC. Areas at high altitudes and beyond 37º N/S of the equator receive less insolation due to the lower angle of incidence, such as in Antarctica’s with an average annual temperature -49 ºC.
Temperature
Depends on how much heat energy or insolation is received from the sun. Insolation: incoming solar radiation. Average global temperature is 15ºC
Areas of high temperature
25º- 40 º N/S
AREAS CLOSE TO THE EQUATOR
LOW ALBEDO
Temperature: 25º- 40 º N/S
Hot. Tanami deserts Australia daytime temp up to 50 ºC
Temperature: AREAS CLOSE TO THE EQUATOR
Warmer due to more direct insolation. Average 25ºC or higher. Creates global transfer of heat to poles via atmospheric circulation of winds. However, equatorial regions do not receive the highest Earthly temperatures: Thunderstorms in equatorial regions use large energy, decreasing temperature
Temperature: LOW ALBEDO
More radiation absorbed, causing greater surface heat. Forests have an albedo of 15%. Cloud cover reflects insolation.
Areas of low temperature
BEYOND 37º N/S OF EQUATOR
HIGH ALBEDO
HIGHER ALTITUDES
Temperature: BEYOND 37º N/S OF EQUATOR
Head deficit zone, receiving less insolation due to the angle insolation strikes the earth: Angle of incidence. Sun strikes Earth at lower angle of incidence, and heat is more dispersed.
Antarctica’s average annual temperature -49 ºC
Temperature: HIGH ALBEDO
More insolation is reflected. Light alpine areas (Greenland) have a 40-90% albedo.
Temperature: HIGHER ALTITUDES
Environmental lapse rate decreases temperatures 6.5 ºC per 1km in altitude. Air is less dense. Mount Hotham = 1881m in elevation = 8.1 ºC average.
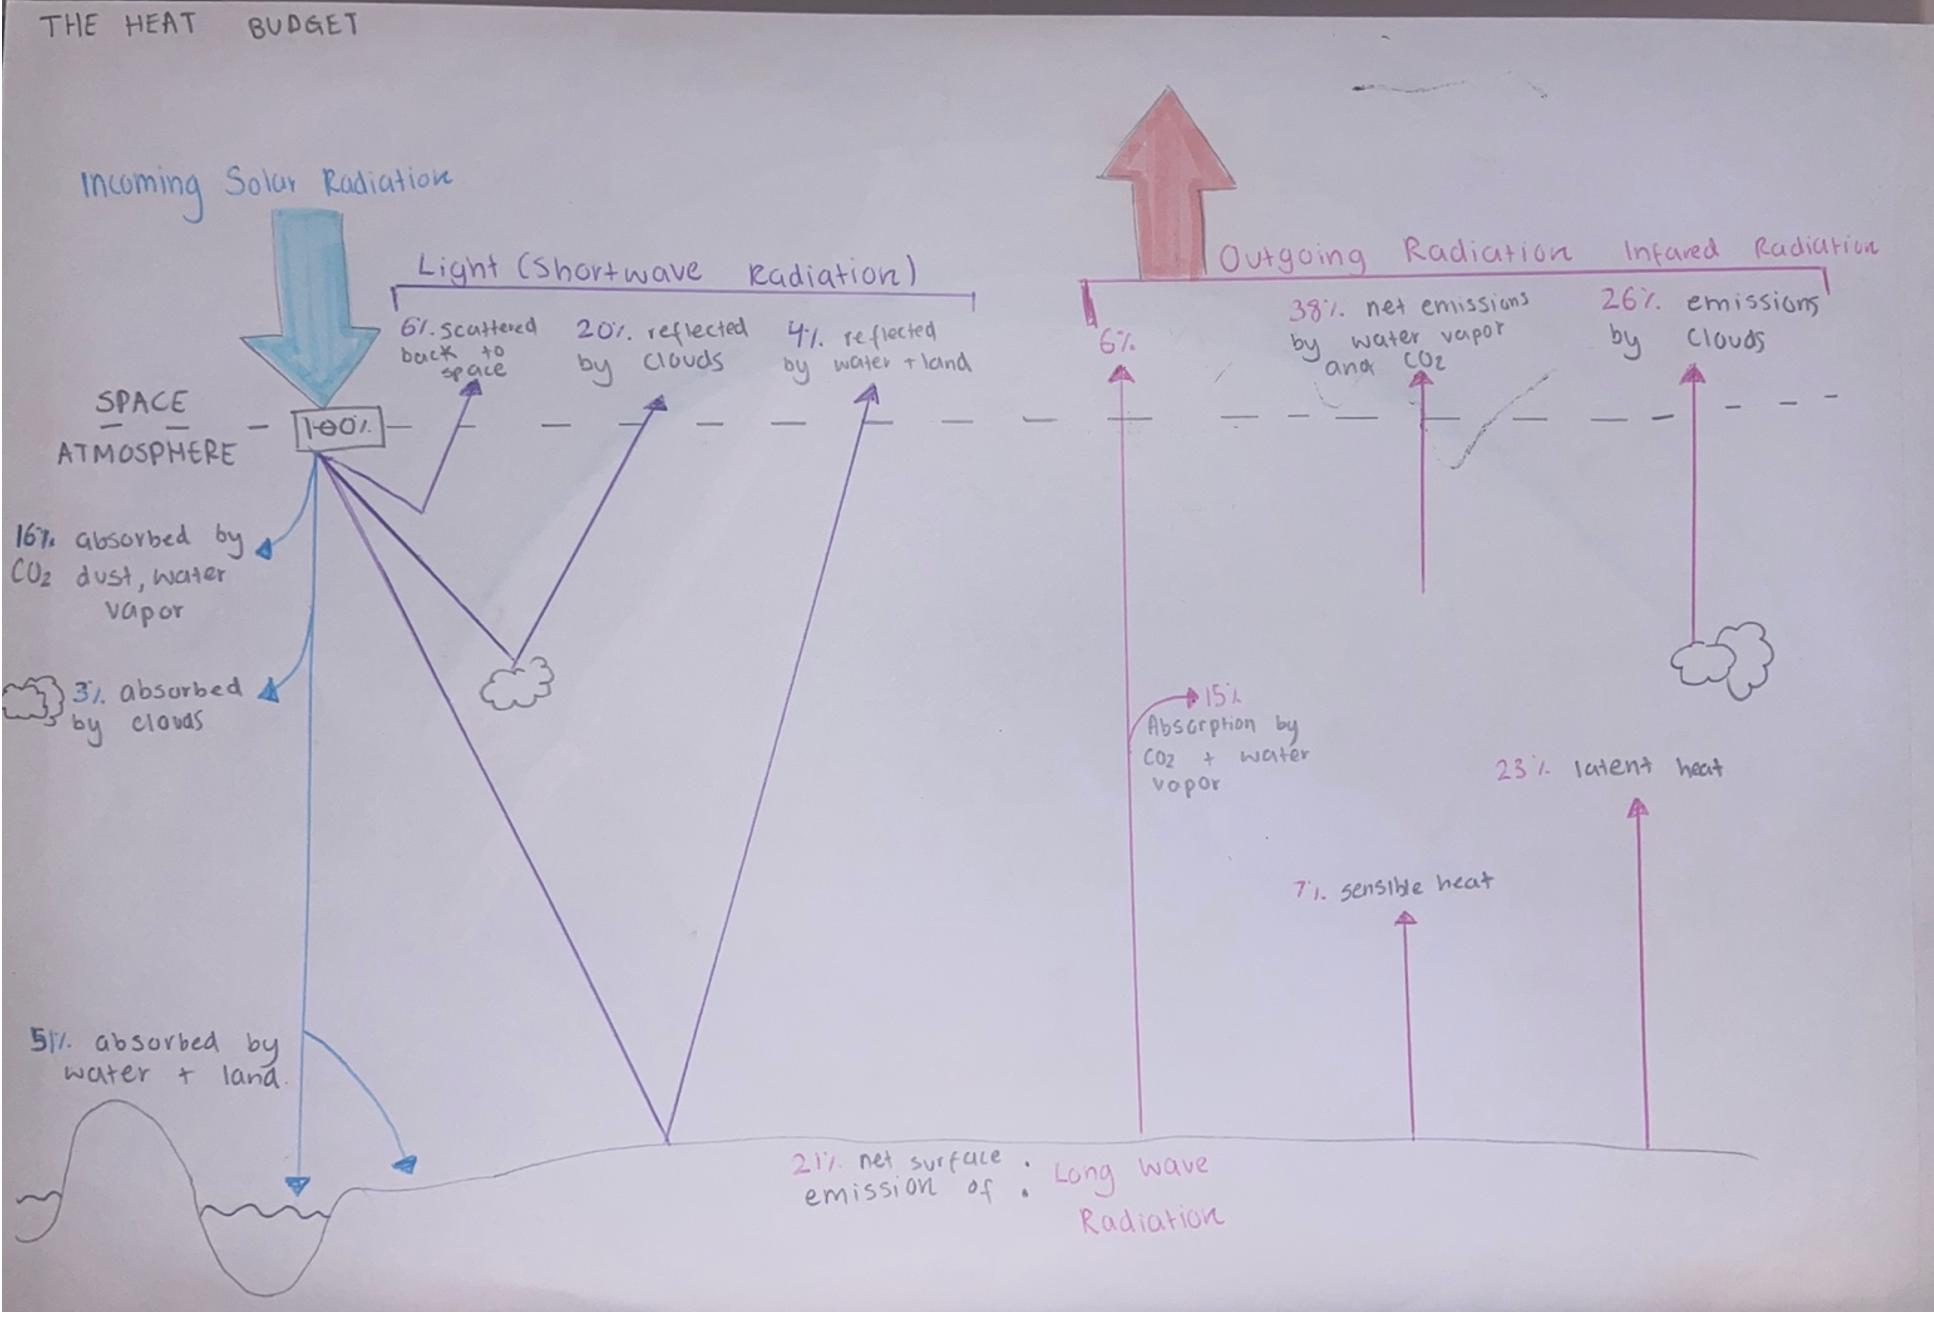
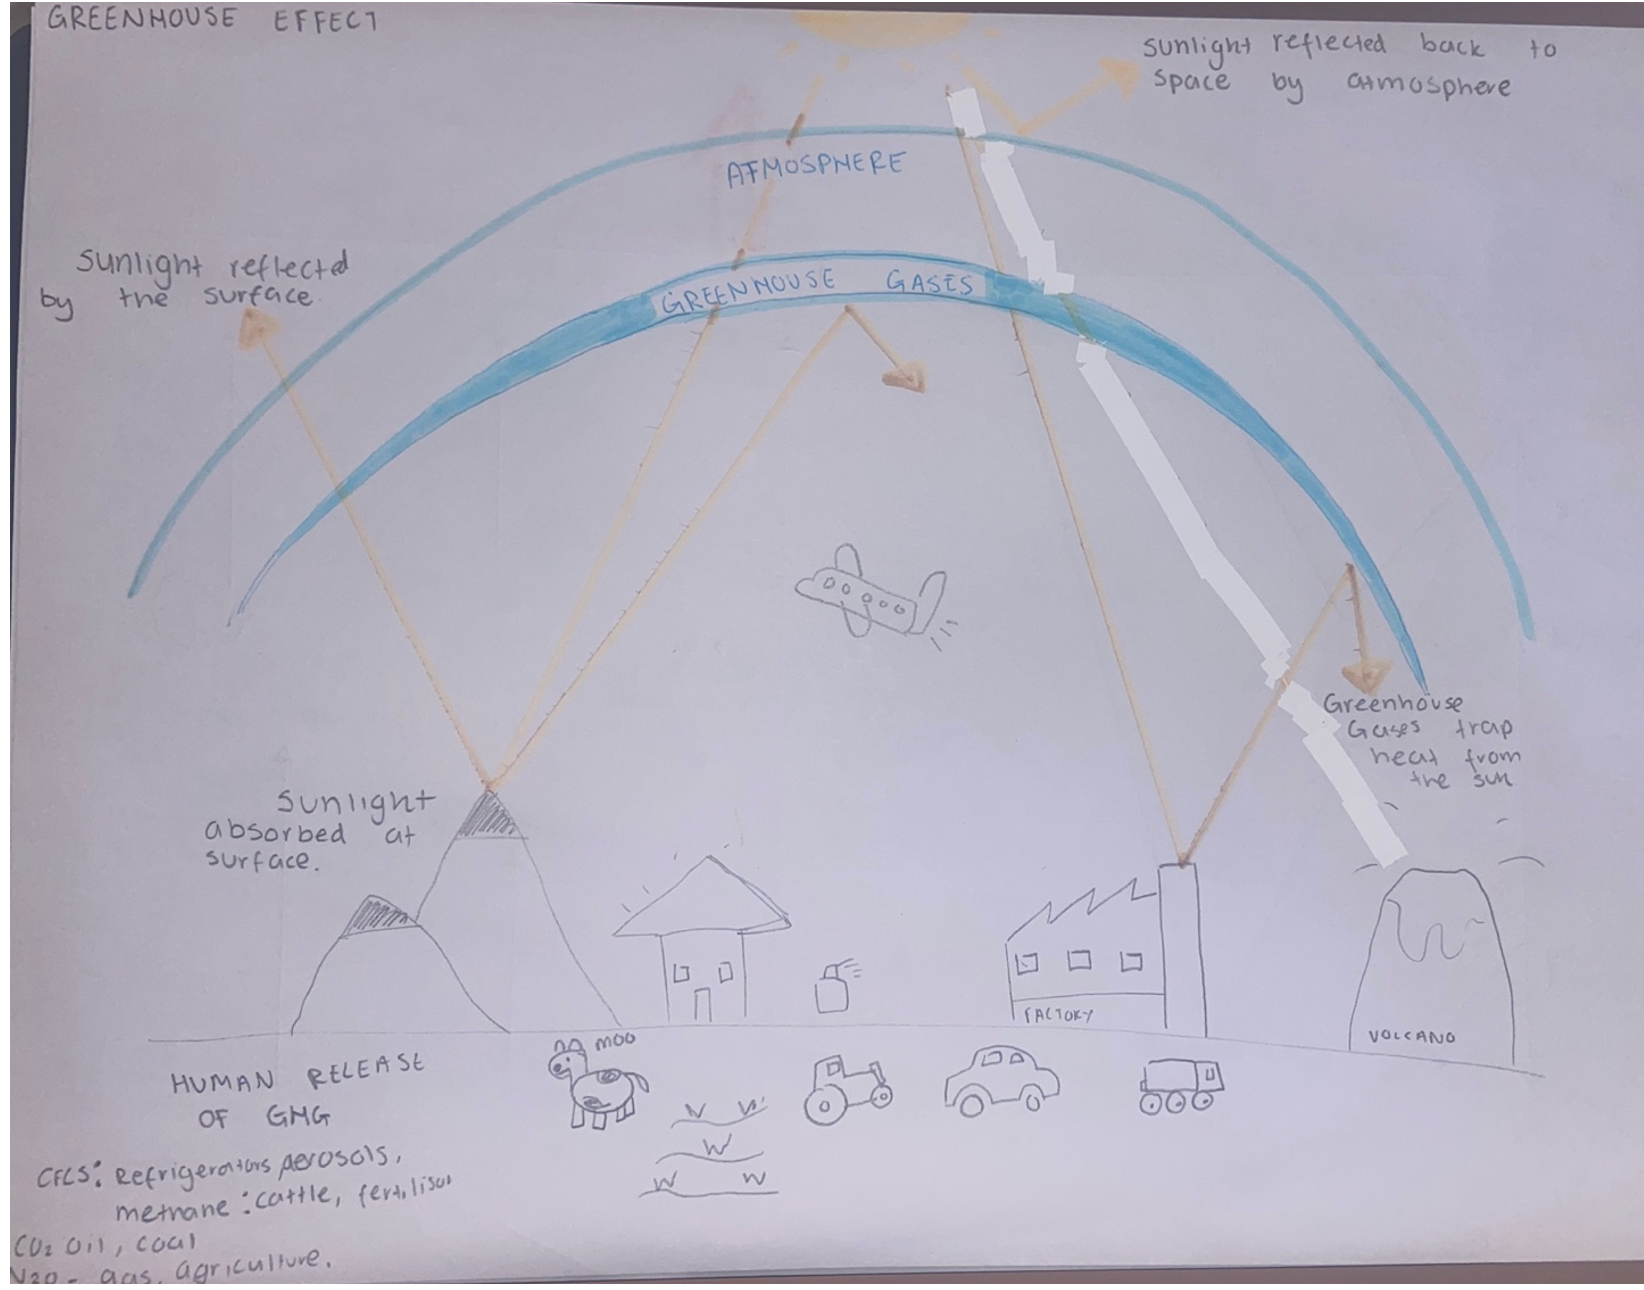
Heat budget and the greenhouse effect
Key features:
-The heat budget balances between insolation absorbed by the Earth and outgoing radiation emitted by the Earth.
-Greenhouse effect. Greenhouse gases absorb terrestrial long-wave then re-radiates it in all directions.
-100% of radiation received from the sun is returned to space. 30% directly reflected and doesn’t affect the system. 70% terrestrial radiation re-radiated into space
Influence on climate:
-Moderates the temperature of the atmosphere.
-Any alteration in the balance of radiation can disrupt natural processes.
-Increased greenhouse gas concentration means more heat is being trapped for longer, leading to warming.
-Warming can result in rainfall changes by increasing evaporation.
Heat budget diagram
Greenhouse effect diagram
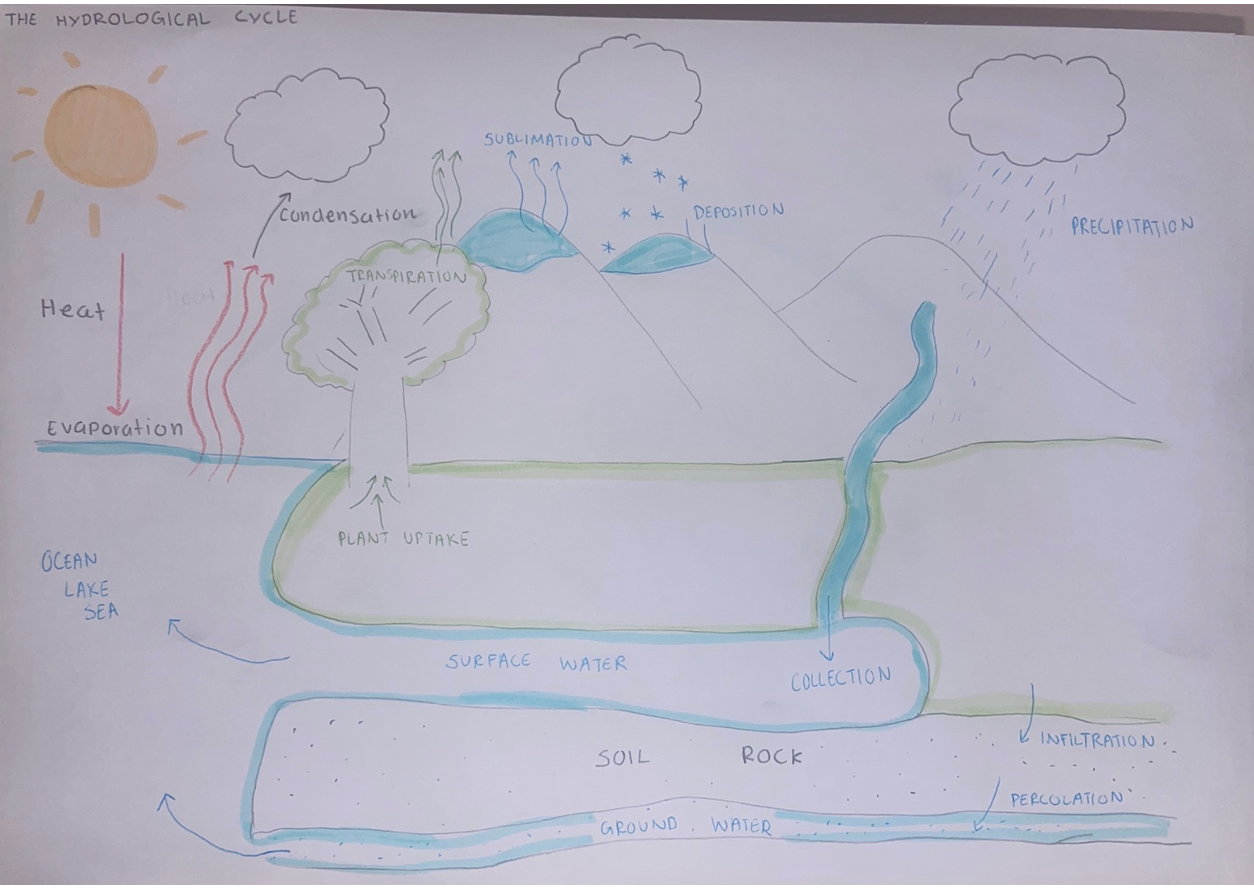
Hydrological cycle
Key features:
-The continuous movement of water through land, oceans and atmosphere as solids, liquids and gas.
-It is driven by solar energy evaporating water sources and has 6 processes: evaporation, condensation, precipitation, infiltration, runoff and transpiration.
Influence on climate:
-It regulates many elements of weather: rainfall, precipitation, humidity, cloud cover and temperature.
-Temperature increases can amplify evaporation and transpiration leading to flooding.
-For example, in 2022 warmer ocean temperatures in east coast Australia led to once in 100-year flooding event in south QLD and north NSW.
Hydrological cycle diagram
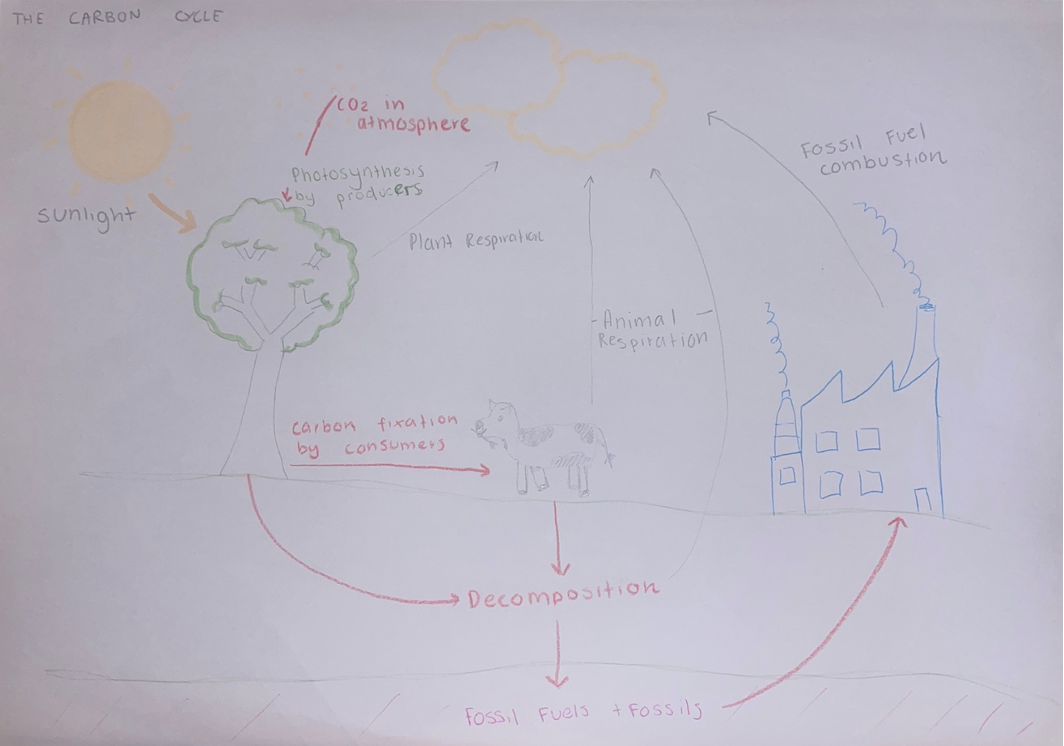
Carbon cycle
Key Features:
-The continuous movement of carbon compounds between the land, oceans, atmosphere and living organisms in it’s various states.
-It has 2 key elements.
-Those that remove and store CO2 from the atmosphere. Most carbon stored in rocks, is exchanged with the oceans, is removed from the atmosphere by precipitation, photosynthesis, erosion and sedimentation.
-Those that release CO2 back into the atmosphere. Oceans and currents bring carbon to surface where it evaporates and is released into the atmosphere, respiration creates CO2 as a waste product, and burning of plant materials
Influence on climate:
-It regulates global temperature by controlling amount of CO2, and hence the heat retention of the Earth.
-Increased CO2 levels enhances the greenhouse effect which warms the earth, altering rainfall patterns and increasing the frequency of hazard events such as droughts and bushfires.
-Since the industrial revolution, CO2 has risen 48% causing a 1.1ºC warming of global surface temperature.
Carbon cycle diagram
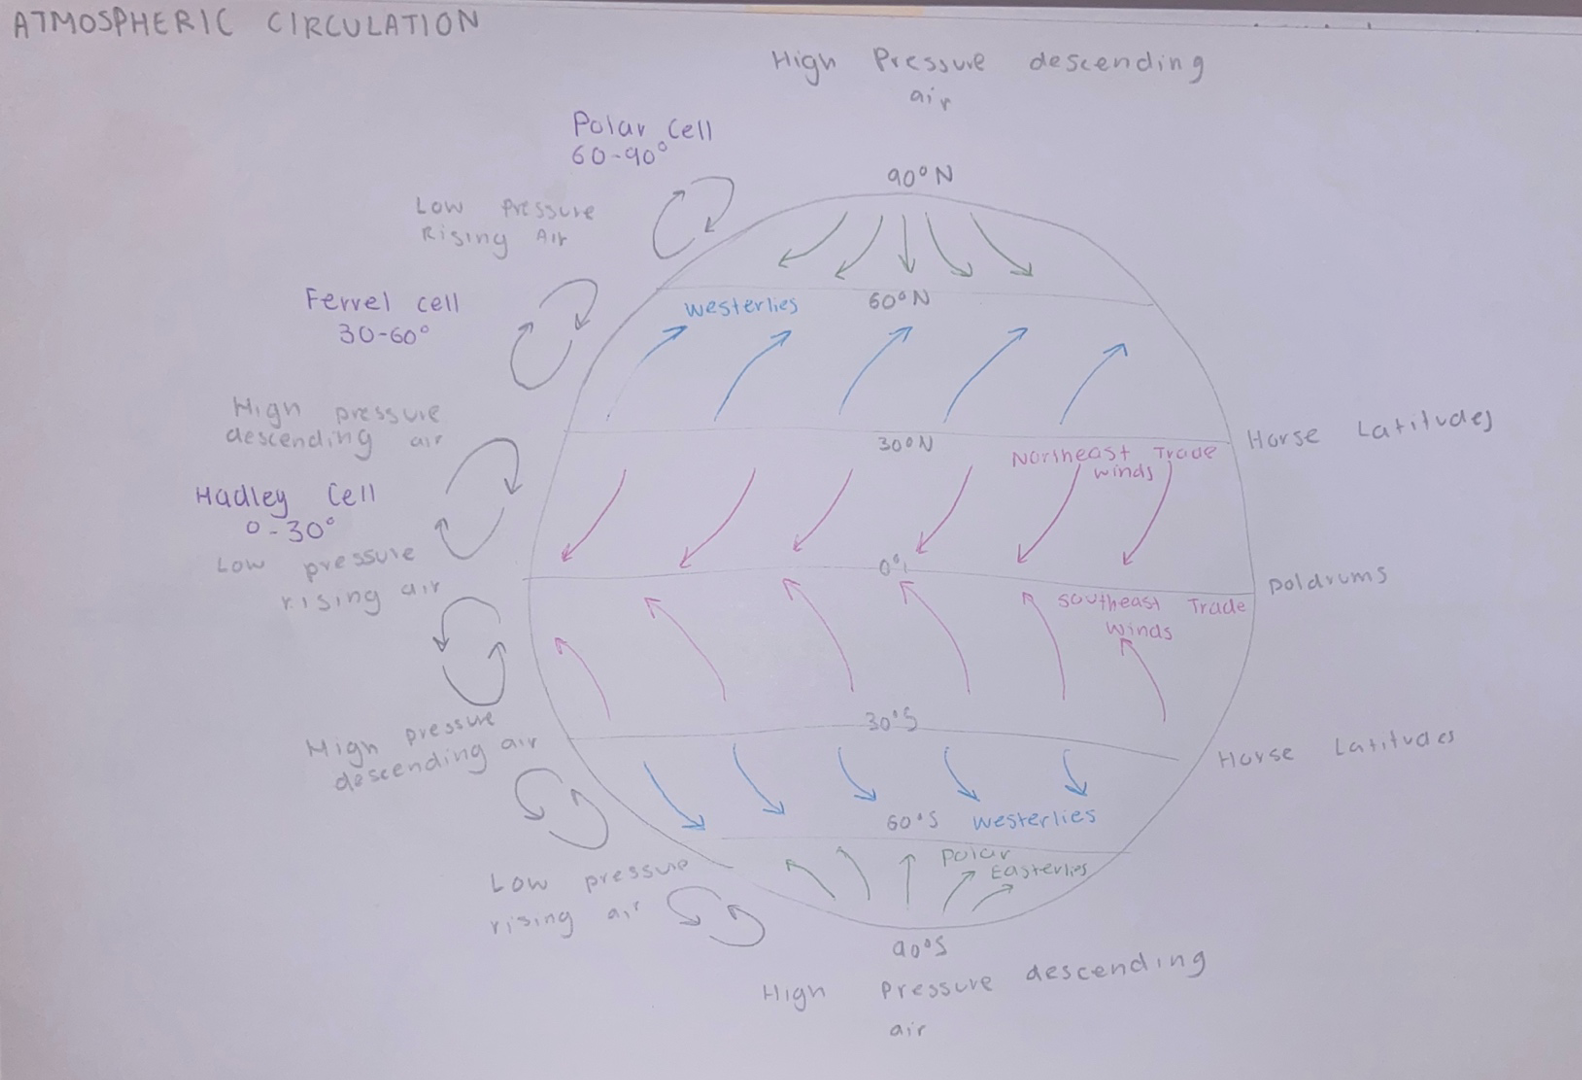
Atmospheric circulation
Key Features:
-The large-scale movement of air and is responsible for the distribution of thermal energy across the Earths surface.
-There are three atmospheric cell which circle the planet:
—The Hadley cell - 30-40 degrees north and south of the equator and moves heat energy away from the equator, producing high pressure regions.
---The Polar cells are located at the poles (60 degrees+ N/S) creating high-pressure zones and very cold conditions.
—The Ferrel cells are situated between the other cells. It creates low-pressure areas at the surface and high-pressure areas aloft, and acts life a gear by moving in opposite directions to other cells.
-The Coriolis effect occurs as winds are deflected from a straight path to a curved path due to the Earth’s rotation on an axis, leading to prevailing westerly and south-westerly winds.
Influence on climate
-Controls distribution of thermal energy and moisture across the Earth’s surface, influencing cloud and precipitation.
-Low pressure is associated with unstable, inclement weather, with a chance of rain or storms.
-High pressures associated with fine, stable conditions with clear skies.
Atmospheric Circulation diagram
Natural causes of climate change
The earths climate has always changed, driven by internal and external dynamics of Earths systems.
Natural forcings :
-Solar variations (external)
-Orbit variations (external)
- Volcanic eruptions (internal)
Natural causes of climate change: Solar variations
The sun plays a large role in determining Earth’s climate, and thus any changes to the amount of radiant energy emitted by the sun alters our climate.
AGING SUN
For every 1 billion years, the suns brightness increases by 10%, increasing insolation reaching earth.
SUNSPOT / SOLAR CYCLE
11 year cycle of huge, magnetic storms occurring on suns surface that increases expulsion of radiation and its magnetic field breaks. Extra radiation is released as coronal mass ejections and solar flares. Alters insolation reaching Earth if ejected in our direction. Usually contains a regular number of sunspots in each cycle, however variations do occur. E.g. In 1650-1715, Maunder Minimum period saw almost no sunspots, creating a cooling effect. European winters were ~1ºC colder and longer.
It has a short-term effect as heat is fast to disperse.
Natural causes of climate change: Volcanic eruptions
Large volcanic eruptions influence climate by throwing gases such as sulphur dioxide, carbon dioxide, dust and ash into the atmosphere. Although greenhouse gases are emitted to create a warming effect, sulphur dioxide can reach the upper atmosphere, where it can transform into droplets of sulphuric acid or aerosol which reflect insolation, causing a cooling effect. It can take up to 7 years for aerosol to disappear, resulting in a volcanic winter.
Super volcanoes are substantially larger than all other eruptions in geological times, producing long lasting effects on climate. E.g Lake Toba super volcano in Northern Sumatra (Indonesia) was the largest volcanic eruption of the last 25 million years. It erupted 75,000 years ago spewing 800km3 of ash and 100 billion metric tonnes of sulphur dioxide into the atmosphere. It caused volcanic winter lasting years, causing global cooling of 3-3.5ºC and pushed plant and animal species to the brink of extinction.
Anthropogenic causes of climate change
The enhanced greenhouse effect has been created by the forced release of GHG from their terrestrial state into the atmosphere.
Increases terrestrial radiation trapped near Earths surface, creating accelerated warming. Most contributions occurred over the last 200-300 years.
Anthropogenic causes of climate change: Agricultural
~20% of anthropogenic GHG emissions.
RICE CULTIVATION: Wet rice cultivation involves flooding a field, which cuts off the oxygen supply from the atmosphere to the soil, causing anaerobic fermentation - organic matter in the soil breaks down, creating methane as a waste product. Rice cultivation contributes to 50-100 million tonnes of methane per annum.
LIVESTOCK: Largest contributor to agricultural GHG creating 29% of methane emissions, 9% of CO2 emissions and 65% of nitrous oxide emissions. Caused by respiration, land clearing, manure, processing and transport. Methane is created from ruminant livestock during their digestive process – enteric fermentation. A waste product of methane which is eventually released.
Since the IR, methane emissions have increased due to expansion and intensification of agriculture, however their sequestration has stayed the same or reduced due to deforestation, increasing the rate of global warming
Antropogenic causes of climate change: Deforestation
Dual cause of cause of climate change as it: Releases CO2 into the atmosphere and reduces the ability of ecosystems to removed CO2 from the atmosphere.
Native forests are carbon reservoirs (Sequestering and storing large amounts of carbon). CO2 is absorbed by photosynthesis where it is converted into organic carbon and is stored in plant fibers. If trees are removed by biomass burning, CO2 is released. Over 2015-2017, global tropical forest loss contributes to 4.8 billion tonnes of CO2 a year.
Reduced evapotranspiration levels and albedo can cause climate change. Forests have a higher albedo than bare soil, seeing higher evapotranspiration rates, increasing rainfall. When forests are cleared, surface reflectivity increases, causing less heat to be absorbed and less moisture to bet taken into atmosphere and reducing evapotranspiratio. E.g. Australia’s SW regions saw a 20% rainfall decrease due to extensive deforestation from the 1970s.
Rate of climate change
More recent climate change is occurring at a rate much faster than in the past. Significant evidence this is attributed largely to anthropogenic processes.
Increased carbon dioxide
Increased global temperature
Global ice melt
Sea level rise
Rate of climate change: Increased carbon dioxide
The amount and rate of CO2 occurring in the atmosphere has increased since 1750. Amount of CO2 in the atmosphere is measured as a concentration of mid-tropospheric CO2 in parts per million. Anthropogenic activities have raised atmospheric concentrations of CO2 by almost 50%. 417ppm as of 2022, 278ppm in 1750. The annual rate of increase in the past 70 years is 100 faster than any previous increase ever recorded. CO2 emissions continue to increase levels unprecedented to known history.
Rate of climate change: Increased global temperature
Earths temperature is maintained at an average of 15ºC by the global heat budget. CO2 is the primary greenhouse gas emitted by humans, which absorbs and reradiates infrared radiation back to Earths surface. An increase in CO2 concentration leads to an increase in Earths average global temperature. Due to CO2 rises: The average global temperature has increased by 1.1℃ since 1880. Since 1981, combined sea and surface temperature has increased at a rate of 0.18°C per year. Because CO2 remains in the atmosphere for 100 years, even if all anthropogenic CO2 emissions were to stop today, global temperature is projected to reach 1.5ºC of warming.
Rate of climate change: Global ice melt
Today there are two ice sheets in the world: the Antarctic ice sheet and the Greenland ice sheet. Since 2002, both sheets are losing mass quickly, with Greenland’s melting at 5 times faster over the last 20 years. Arctic sea ice minimum is declining at a rate of 13% per decade. If glaciers melt, sea level rises. Sea ice, ice sheets and glaciers play a role in supporting Earths energy balance by reflecting insolation, maintaining temperature and keeping local air cool and maintaining the global ice extent.
Rate of climate change: Sea level rise
An increase in the level of world’s oceans considered to be a result of anthropogenic activity. Measured by satellites and tide gauge measurements. Rate of sea level rise is 3.6mm per year, and is accelerating, more than doubling from 1.4mm throughout most of the 1900s.
Geological time scale
A system of chronological measurement used by scientists to describe the timing and relationships between events that have occurred throughout Earths history.
In paleoclimatology, scientists use proxy data to establish past climate conditions. The study of past climate. Proxy data comes from preserved physical characteristics of past environments that can substitute for direct measurements
Evidence for climate change over geological time
Proxy data extracted from ice core modelling. Ice cores are cylindrical tubes extracted from ice sheets using a specialised drill. They tell scientists about past temperature, precipitation, atmospheric composition, volcanic activity and wind patterns. Bubbles trapped within the ice captures historical gas concentration and composition of our atmosphere, and the chemical composition of the snow can tell scientists about the temperature in the area, as colder temperatures lead to a lower concentration of heavier oxygen isotopes in snow. These cores contain distinct layers that form throughout the years. With each year, snow falls over the ice sheets and each with a different texture and chemistry. Wind patterns can be determined by taking multiple ice cores in an area and determining patterns based on where the snow drifted by the thickness of the layers. Dust from nearby locations can also accumulate in the layers of the ice cores, showcasing volcanic eruptions. It allows scientist to date the age of the ice cores and therefore the climatic conditions of the time. For example, the Vostok ice core obtained in 1987, taken from a depth of 3190 meters dated back 800,000 years of climate, has revealed eight glacial cycles through its layers. This evidence is crucial for understanding historical climate fluctuations and their driving factors.
Evidence for climate change in recent human history
One major type of evidence for climate change in recent history is the atmosphere. Global temperature measurements have shown that each of the last 3 decades have been successively warmer at the Earth’s surface than any preceding decade since 1850. Globally 19 of the 20 hottest years ever have been since 2000. In Perth, the summer of 2021-22 was the hottest on record in term of mean temperatures, with a mean maximum 2.5 ºC above average and a mean minimum 1.2 ºC above average.
There is a direct relationship between atmospheric concentration of GHG and atmospheric temperature, measured by taking samples at monitoring stations such as Cape Grimm in Tasmania, or measured by remote sensing satellites. Since measurements began, the concentration of GHGs have increased almost 50% increase from pre-industrial levels. The global mean CO2 level in 2021 was 417ppm and is most likely highest level in 2 million years. Global methane concentration is 262% higher than 1750, nitrous oxide concentrations are 123% higher than 1750 and both gases at their highest concentration for at least 800,000 years.
How is LCC and climate related
Land cover change refers to the alteration of the physical surface of the Earth. These changes can create feedback loops that can in turn affect climate particularly towards surface reflectivity (albedo) and the process of natural carbon sequestration.
Changes to surface reflectivity
The Earth’s climate is driven by the Suns energy. As the sun’s rays hit the Earth, a certain percentage of that energy is reflected into space. The amount of radiation reflected by a surface is its albedo, measured on a scale of 0-1 where 0 is no reflection and 1 is 100% reflection. Anything increasing or decreasing incoming or outgoing radiation alters global temperatures. The average albedo of the Earth is 0.31, meaning the Earth reflects around 1/3 of insolation.
Melting ice sheets and glaciers
Deforestation
Changes to surface reflectivity: melting ice sheets and glaciers
The amount of reflected energy changes when the surface changes, especially at the poles, and can cause a warming effect. Bright snow and ice have a very high albedo and hence are effective at reflecting insolation. With increases in global temperatures, a decrease in snow and ice cover has been observed. This result creates the ice-albedo feedback loop, where less energy is being reflected and more being absorbed by the ground water, which in turn causes increased warming and more snow and ice to melt, therefore changing that amount of snow and ice land cover. This is positive feedback, where a stimulus, caused effects which result in an increase in the initial stimulus.
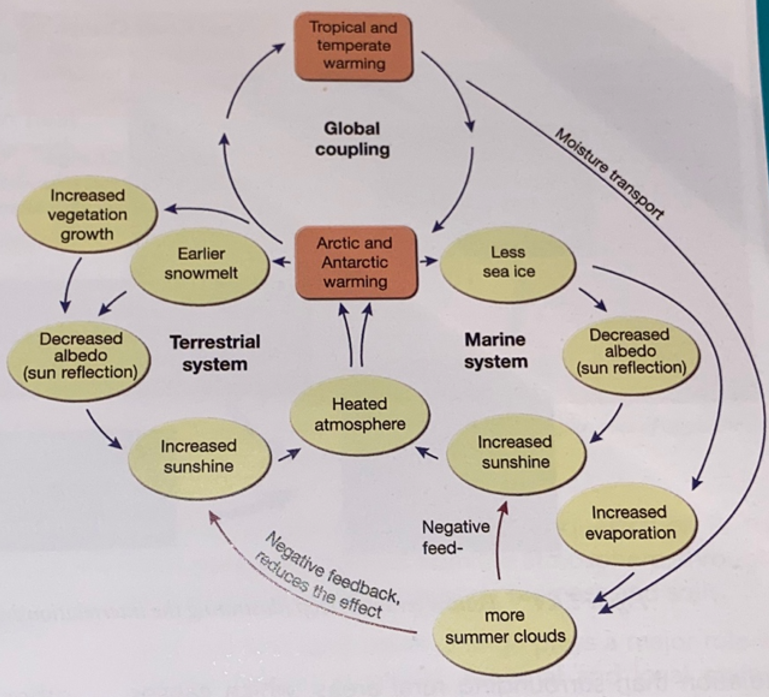
Changes to surface reflectivity: Deforestation
When vegetation is cleared, surface reflectivity increases, meaning less heat energy is absorbed. Forests have a low albedo of 15-20% compared to bare soil of around 40%. Thus, bare surfaces reflect more sunlight, decreasing temperature and causing cooling. Deforestation also releases CO2 into the atmosphere and thus impacts the carbon cycle and climate. This caused a cooling effect followed by a warming trend. Changes in surface reflectivity also cause land cover-climate a positive feedback coupling - as forests are cleared, there is less absorption of heat, reducing evaporation and transpiration, decreasing rainfall, vegetation and canopy density.
Changes to process of natural carbon sequestration
Natural carbon sequestration refers to the process of capture and long term storage of atmospheric carbon dioxide by the natural biogeochemical cycling of carbon. Any change to this process due to land cover change will effect climate, creating a feedback loop to influence land cover. Forests act as major carbon sinks, absorbing CO₂ through photosynthesis, so when trees are burned or left to decompose, carbon stored in its fibers is released as CO2 into the atmosphere. Land use and land cover change tend to release greenhouse gases to the atmosphere, driving global warming and causing further land cover change. Soils are estimated to contain 1,500 gigatonnes of organic carbon, so when disturbed it can be released as CO2. This is driven by deforestation followed by agriculture, causes a further release of carbon in response to tillage disturbance. Changes in land use, such as intensive farming or soil degradation, can reduce the carbon storage capacity of soils. Conversely, practices like regenerative agriculture and conservation tillage can enhance soil carbon sequestration, offsetting up to 20% of CO2 emissions annually.
Present impacts of climate change on natural environments (ice sheets and glaciers)
1.1ºC increase in global surface temperature.
Less ice accumulation and greater ice melts.
According to NASA over 50% of glaciers have been lost since the start of the 19th century.
Food supply and accessibility has declined for many native species.
Arctic ringed seal numbers are declining due to less ice-dwelling prey and an increased risk of predation from killer whales moving into once inaccessible ice-covered regions.
Ice retreat has allowed Adelie penguin to thrive by making it foraging trips faster (3.2-7.9 hours quicker) when sea ice is low.
Projected impacts of climate change on natural environments (ice sheets and glaciers)
Global mean surface temperature between 2016-2035 is to be 0.3-0.7ºC warmer than the 1986-2005 average.
The global glacier volume, excluding those on the periphery of Antarctica and the Antarctic and Greenland ice sheets, is projected to decrease by 15-55% for the best case scenario.
For all emission scenarios, Arctic sea ice reductions are expected, and in the high emissions scenario, a nearly ice-free summer Arctic Ocean is likely before mid-century.
Present impacts of climate change on anthropogenic environments (agriculture)
A 20% decrease in rainfall in SW Australia since 1970, causing a decline in arable land.
Farmers have had to invest more resources into irrigation systems to reduce negative effects upon production, or they have moved production to areas with more reliable rainfall and moderate temperatures, such as towards the coast in Western Australia.
An increase in natural hazard frequency.
24 million hectares lost in the Black Summer bushfires in 2019-2020 impacted approximately 1/4 of agricultural land, causing a loss of an estimated 4-5 billion dollars, a rise in food prices and job loss.
Projected impacts of climate change on anthropogenic environments (agriculture)
2003 and 2080, increase in agricultural land cover in the Northern Hemisphere due to satellite data showing increased plant growth in the past 30 years in the same area.
Northern Russia = 150% increase in arable land = changing climatic conditions = 20 more frost free days per year = increases the production and yield of wheat, maize, corn and livestock.
By 2050 agricultural activities and land cover in southern Europe will decline rapidly due to a reduction in its suitability and will expand into northern Europe due to new arable land.
Areas within temperate regions are expected to have an increase in agricultural land cover, areas that are tropical and subtropical are expected to see a decline in the amount of arable land due to water scarcity and heat, such as in India and Australia.
The number of extreme fire events in southern and eastern Australia is projected to grow 10-50% for low emissions, and 100-300% for high emissions.