Unit 2: Population Geography
1/45
There's no tags or description
Looks like no tags are added yet.
Name | Mastery | Learn | Test | Matching | Spaced | Call with Kai |
|---|
No analytics yet
Send a link to your students to track their progress
46 Terms
Meridian
An arc connecting the North and South poles
Used for telling time
Longitude
Part of the coordinate numbering system made up of Meridians (north/south)
Parallel
Circles drawn around the globe parallel to the equator and at right angles to the meridians
Latitude
Part of the coordinate numbering system made up of parallels (east/west)
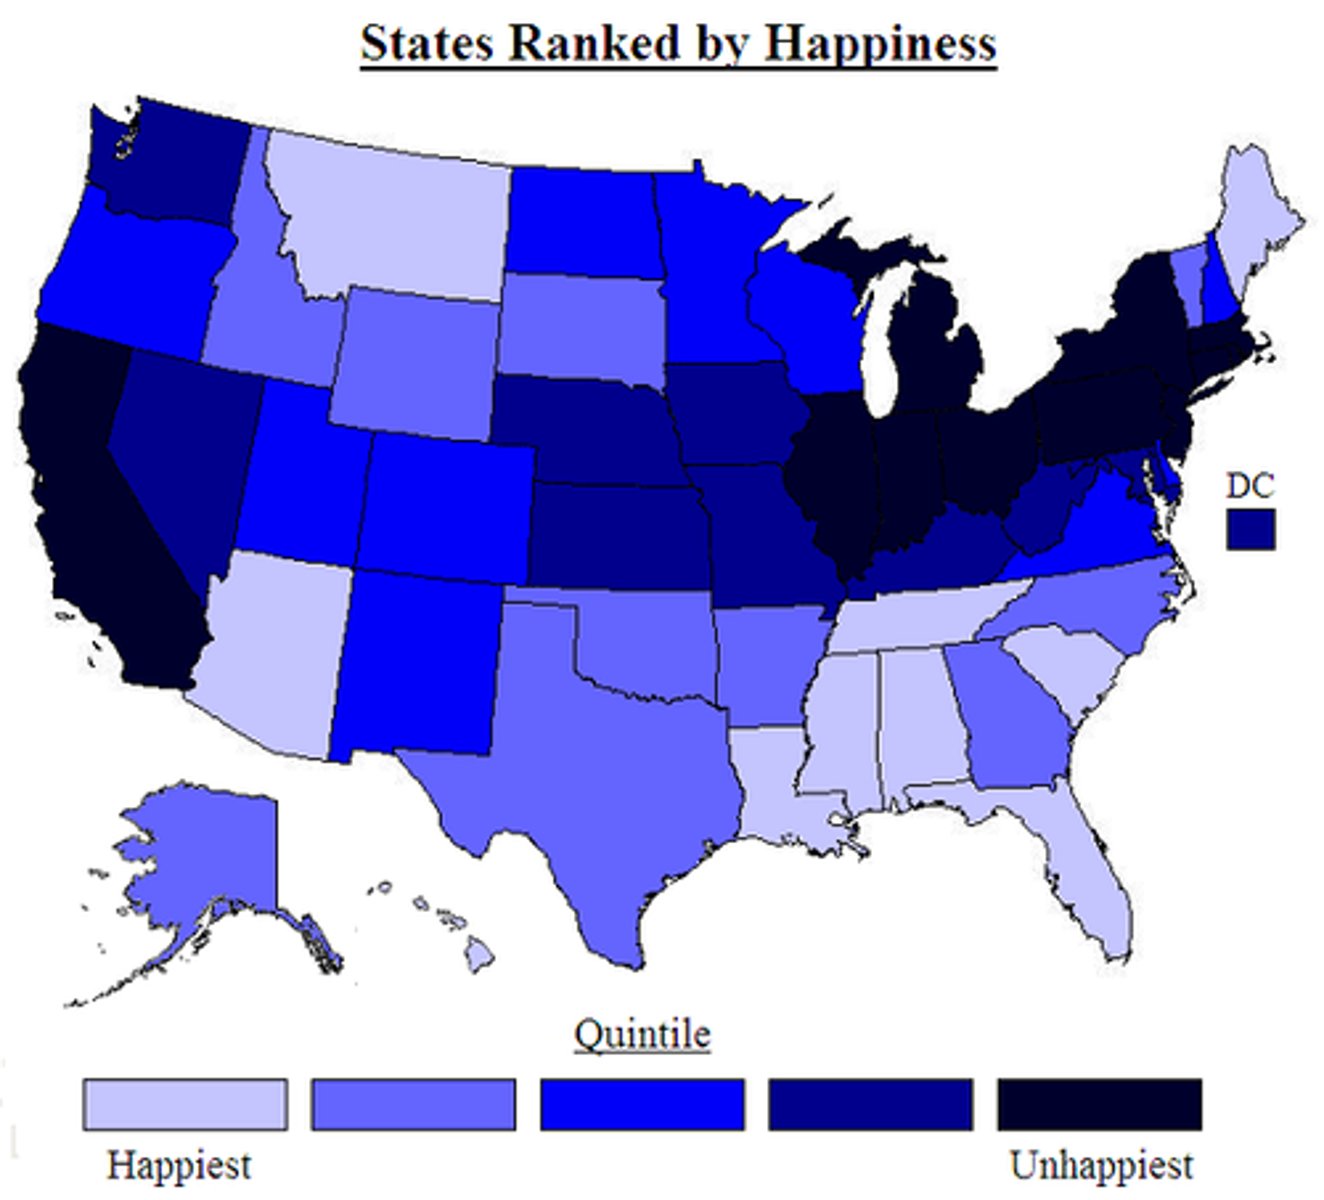
Choropleth Map
Map where recognizable areas are shaded or patterned in proportion to the data collected
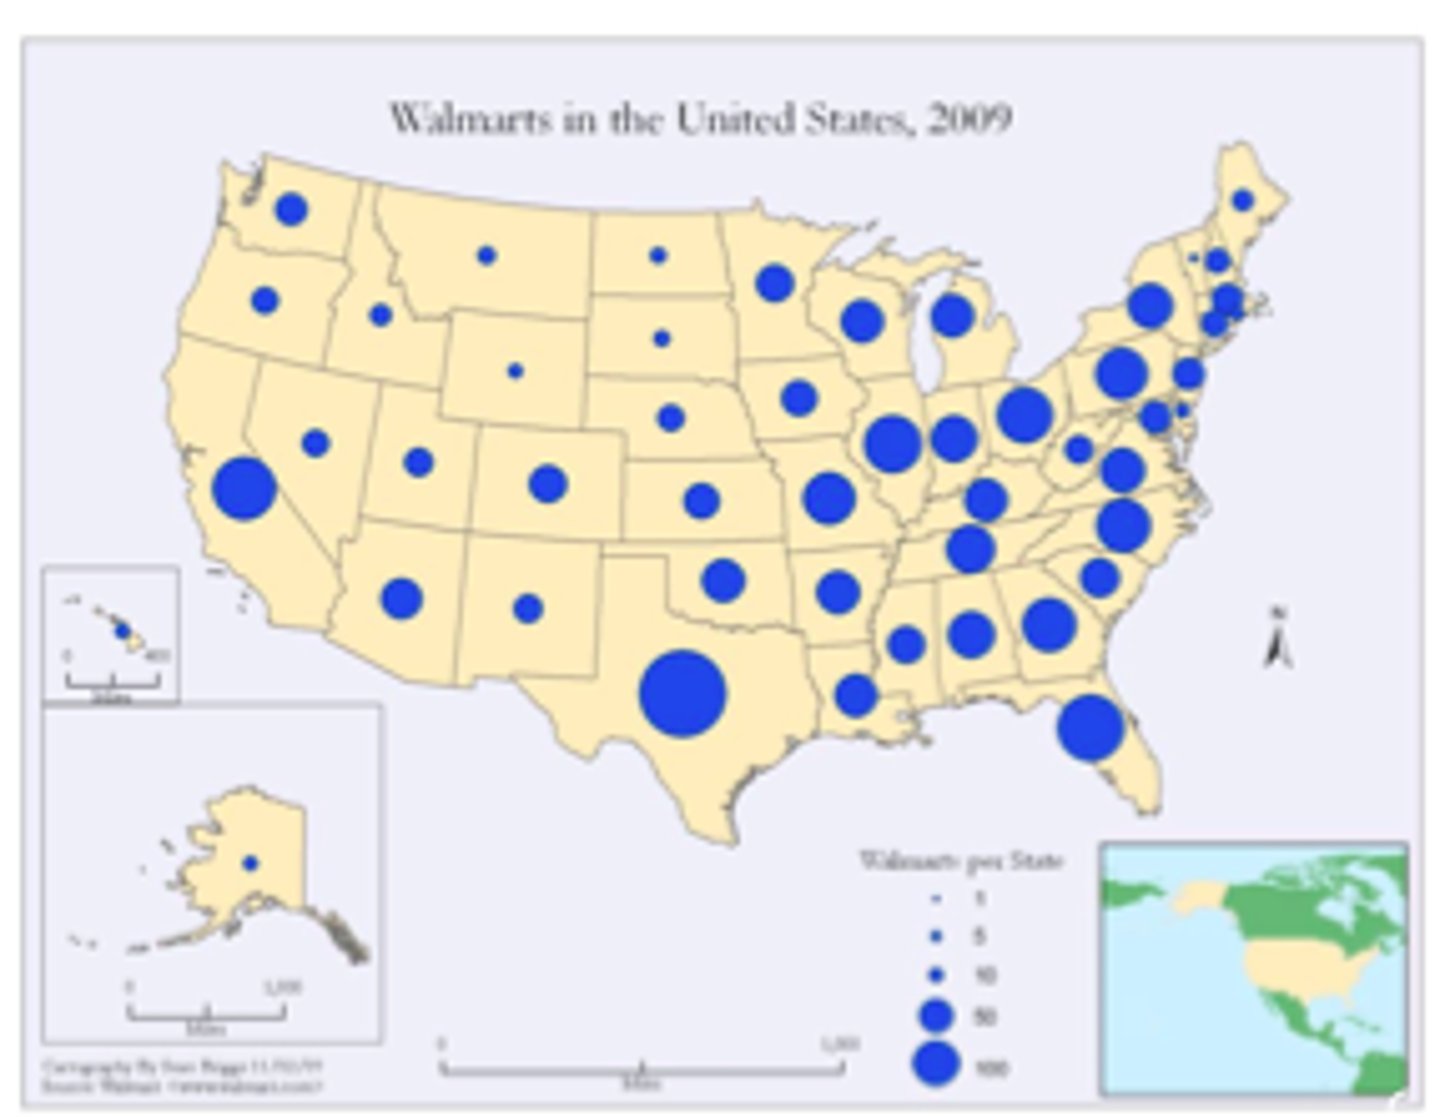
Graduated Symbol Map
Map displaying a graphic multiple times that changes in size according to the value of data
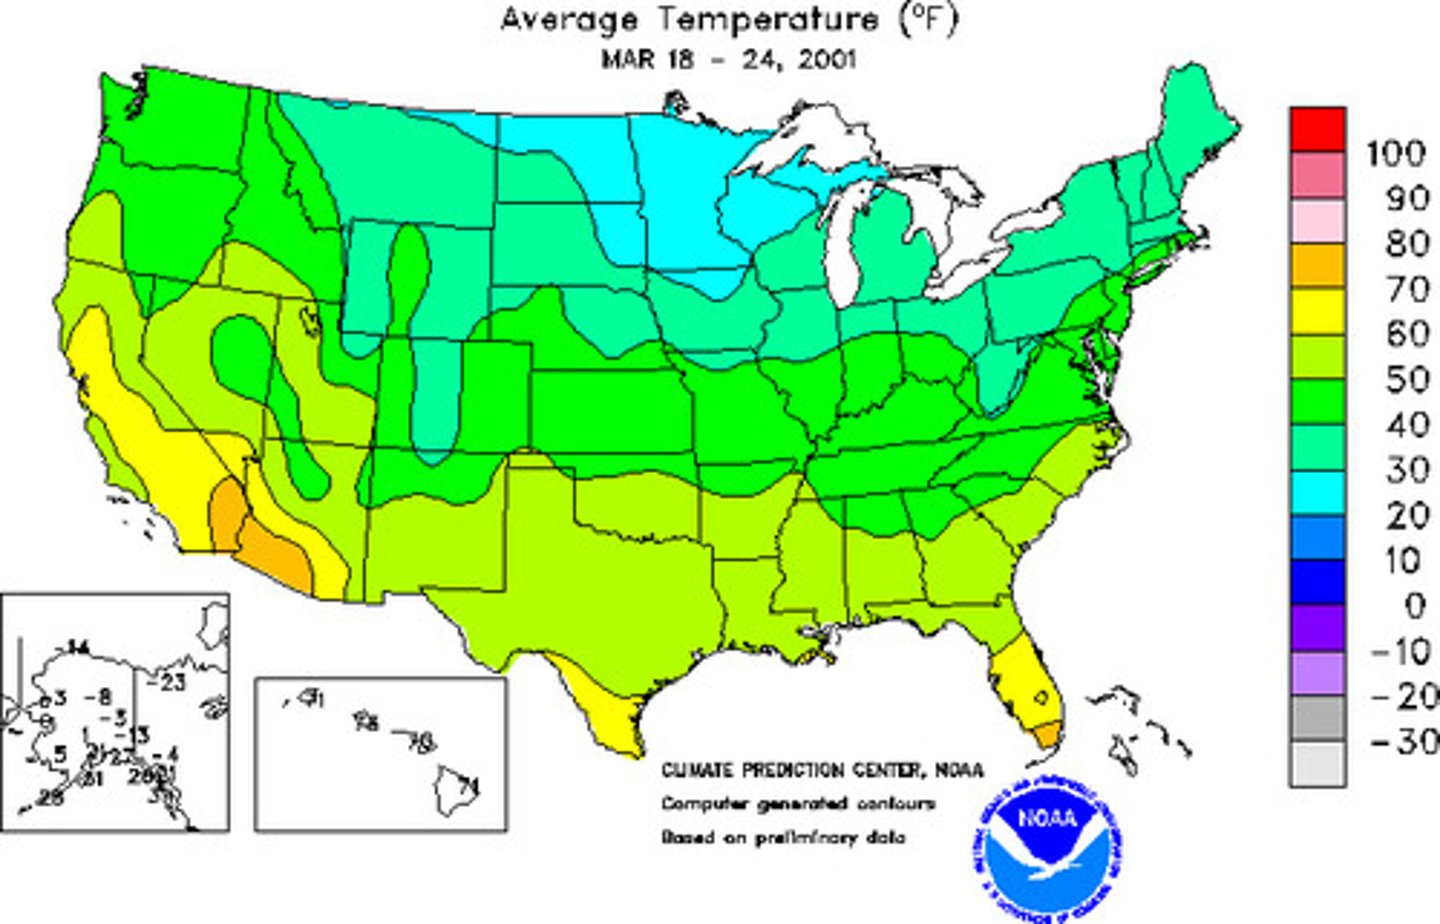
Isoline Map
A map that connects with lines all the places that have particular values.
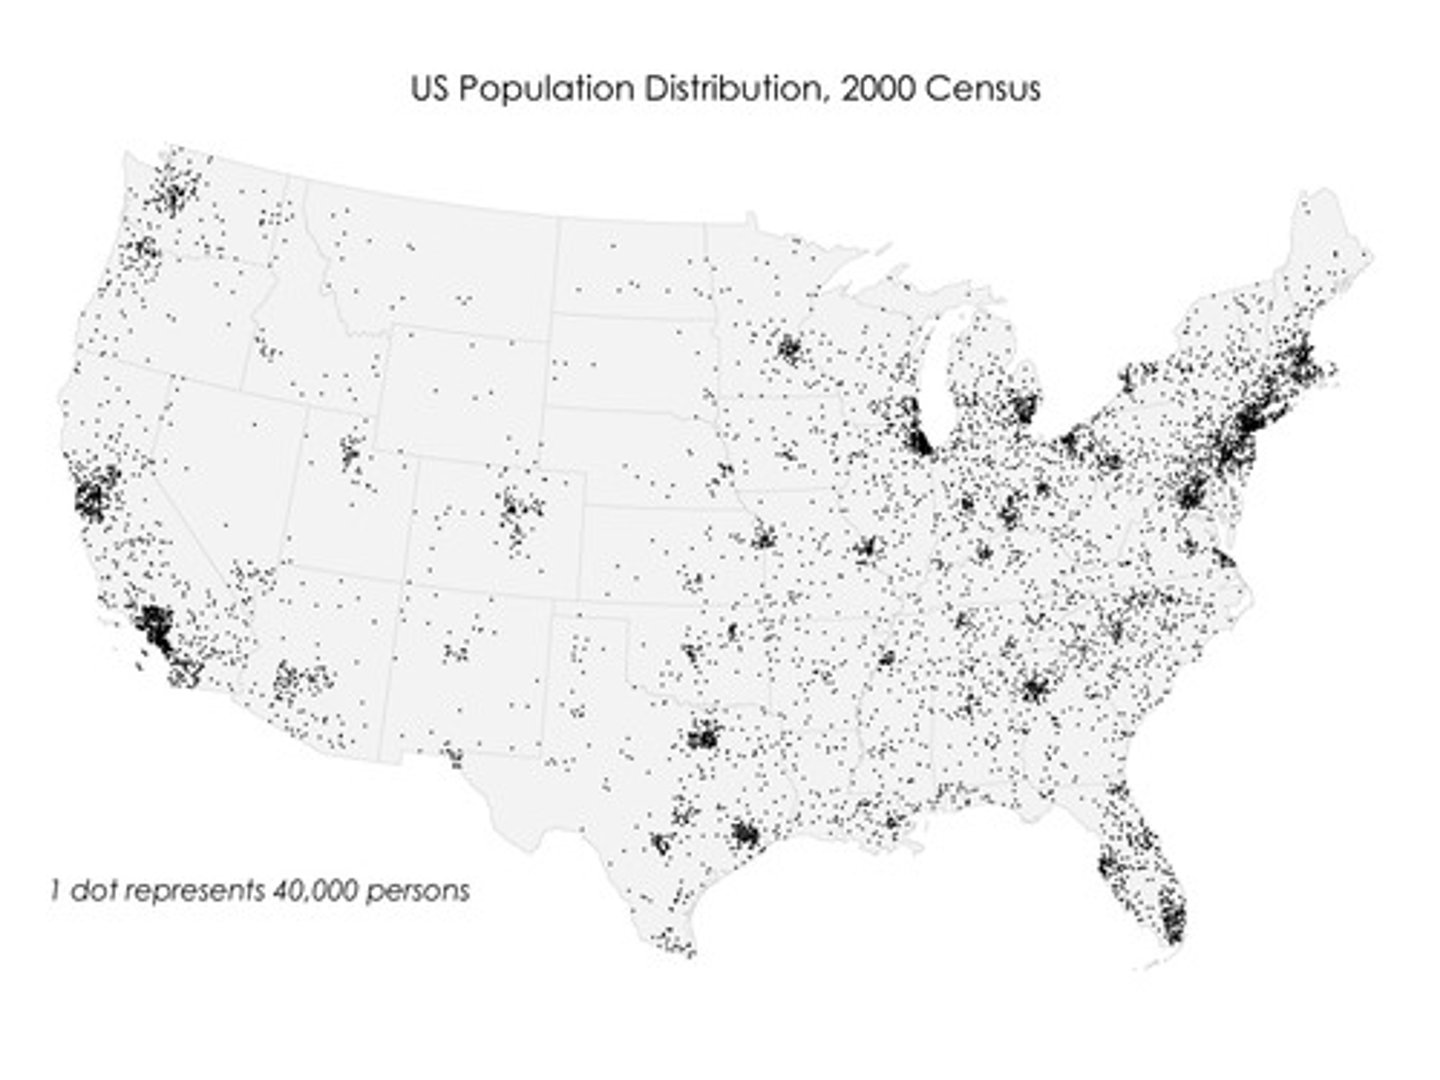
Dot Distribution Map
Map that depicts data as points and shows how those points are clustered together or spread out over an area
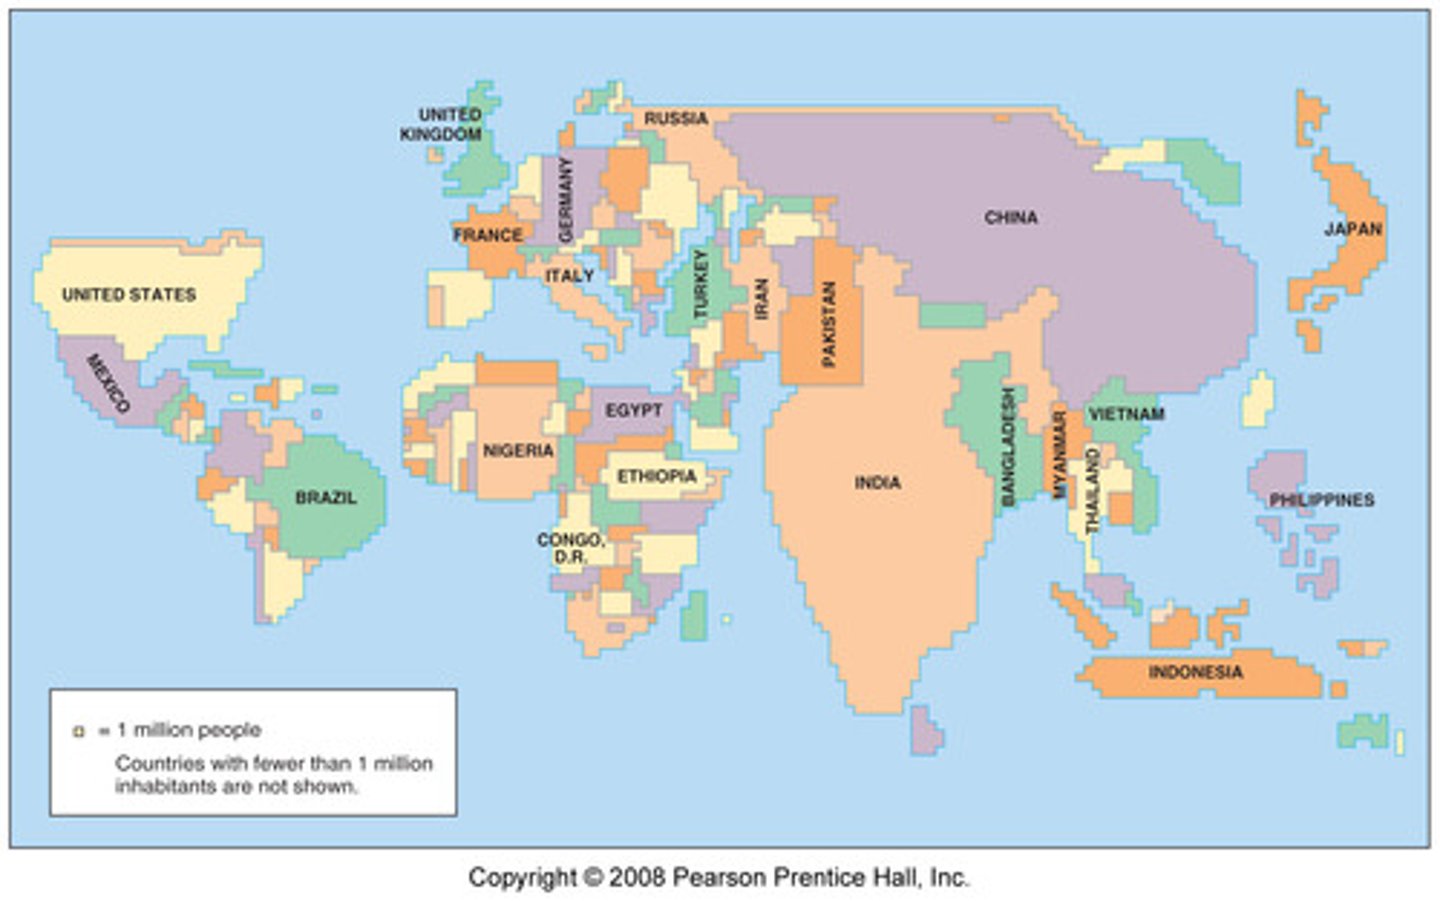
Cartogram Map
Map in which the size of a territory is proportional to the value of particular data
Small Scale
Zoomed out, less detail
Large Scale
Zoomed in, more detail
Projection
Scientific method of transferring locations on Earth's surface to a flat map
Toponym
The name given to a place on Earth's surface.
Site
The physical character of a place
Situation
The location of a place relative to other places
Relative Location
Relates to situation, could change
Absolute Location
Describes the location of a place in a way that never changes
Formal/Uniform Region
An area in which everyone shares in one or more distinctive characteristics like language or climate
Functional/Nodal Region
Area organized around a node or focal point. An example would be the reception area of a TV station. At the center, the signal is strongest and then gets weaker the farther out it goes
Vernacular/Perceptual Region
An area that people believe exists as part of their cultural identity. For example, the Midwest
Carrying Capacity
The maximum population size of the species that the environment can sustain indefinitely, given the food, habitat, water, and other necessities available in the environment (2.1.1)
Overpopulation
The number of people in an area exceeds the capacity of the environment to support life at a decent standard of living (2.1.1)
Ecumene
The portion of Earth's surface occupied by permanent human settlement (2.1.2)
Four Population Clusters
2/3 of the world's population are clustered in these areas (Europe, East Asia, South Asia, Southeast Asia) (2.1.2)
Arithmetic Density
Total number of people divided by the total land area (2.1.3)
Physiological Density
The number of people per unit of area of arable land, which is land suitable for agriculture (2.1.3)
Agricultural Density
Ratio of the number of farmers to the amount of arable land (2.1.3)
Natural Increase Rate (NIR)
The percentage by which a population grows in a year. Excluding migration (2.2.1)
Doubling Time
Number of years needed to double a population size assuming a constant NIR (2.2.1)
Crude Birth Rate (CBR)
The total number of live births in a year for every 1,000 people alive in the society (2.2.2)
Total Fertility Rate (TFR)
The number of births in a society (2.2.2)
Infant Mortality Rate (IMR)
Total number of deaths in a year of infants under one year of age compare with total live births (2.2.2)
Demographic Transition
The process of change in a society's population from a condition of high crude birth and death rates and low rate of natural increase to a condition of low crude birth and death rates, low rate of natural increase, and a higher total population (2.2.3)
Stage 1
- Very High CDR
- Very High CBR
- Very Low NIR
Stage 2
- High CBR
- Declining CDR
- Very High NIR
Stage 3
- Declining CBR
- Moderately Declining CDR
- Moderate NIR
Stage 4
- Very Low CBR
- Low or slightly increasing CDR
- 0 or negative NIR
Stage 5
- Very Low CBR
- Rising CDR
- Negative NIR
Zero Population Growth (ZPG)
When the CDR and CBR are equal and the NIR is 0
Population Pyramid
A bar graph representing the distribution of population by age and sex
Medical Revolution
Technologies invented in the western world to diagnose and treat disease extended to the developing world
Life Expectancy
The average number of years an individual can be expected to live, given current social, economic, and medical conditions (2.3.1)
Dependency Ratio
the number of people who are too young or too old to work, compared to the number of people in their productive years (2.3.1)
Elderly Support Ration
The number of working-age people (ages 15 to 64) divided by the number of persons 65 and older (2.3.1)
Sex Ratio
The number of males per 100 females in the population (2.3.2)
Maternal Mortality Rate
The annual number of female deaths per 100,000 live births from any cause related to or aggravated by pregnancy or its management (excluding accidental or incidental causes) (2.3.2)