chapter 4: specific factors and income distribution
1/49
There's no tags or description
Looks like no tags are added yet.
Name | Mastery | Learn | Test | Matching | Spaced |
|---|
No study sessions yet.
50 Terms
there are 2 main reasons why international trade has strong effects on the distribution of income within a country
resources cannot move immediately or costlessly from one industry to another
industries differ in the factors of production they demand
the specific factors model allows trade to affect
income distribution
what are the assumptions of the specific factors model
two goods (e.g., cloth and food)
three factors of production (e.g., labor, capital, and land)
perfect competition prevails in all markets
cloth produced using capital and labor
food produced using land and labor
labor is a mobile factor that can move between sectors
land and capital are both specific factors used only in the production of one good
when labor moves from food to cloth
food production falls while output of cloth rises
the production function for cloth (graph)
the more labor employed in the production of cloth, the larger the output. as a result of diminishing returns, however, each successive person-hour increases output by less than the previous one; this is shown by the fact that the curve relating labor input to output gets
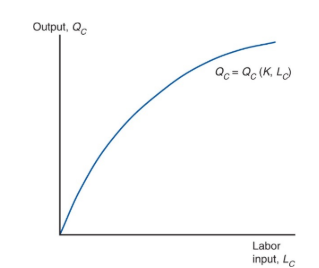
the shape of the production function reflects the law of
diminishing marginal returns
diminishing marginal returns
adding an additional factor of production results in smaller increases of output
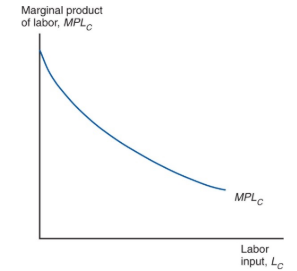
marginal product of labor
the change in the level of output when a new employee is hired, given that all else remains constant
marginal product of labor (graph)
the marginal product of labor in the cloth sector, equal to the slope of the production function shown in the graph, is lower the more labor sector employs
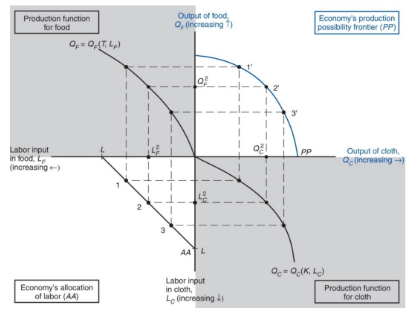
use a four-quadrant diagram to construct production possibilities frontier
lower left quadrant indicates the allocation of labor
lower right quadrant shows the production for cloth
upper left quadrant shows the corresponding production function for food
upper right quadrant indicates the combinations of cloth and food that can be produced

the production possibility frontier in the specific factors model
PP in the upper right quadrant shows the economy’s production possibilities for given supplies of land, labor, and capital. due to diminishing returns, PP is a bowed-out curve instead of a straight line
why is the production possibilities fronntier curved
diminishing returns to labor in each sector cause the opportunity cost to ride when an economy produces more of a good
opportunity cost of cloth in terms of food is the slope of the production possibilities frontier - the slope becomes steeper as an economy produces more cloth
how much labor is employed in each sector
need to look at supply and demand in the labor makret
demand for labor:
in each sector, employers will maximize profits by demanding labor up to the point where the value produced by an additional hour equals the marginal cost of employing a worker for that hour
if the wage were higher in the cloth sector
workers would move from making food to making cloth until the wages become equal
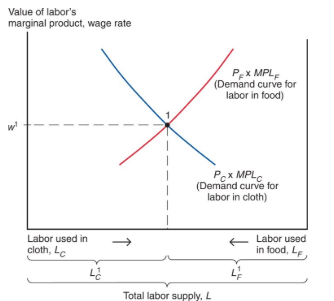
the allocation of labor (graph)
labor is allocated so that the value of its marginal product (P x MPL) is the same in the cloth and food sectors. in equilibrium, the wage rate is equal to the value of labor’s marginal product
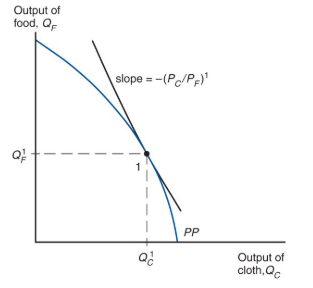
production in the specific factors model (graph)
the economy produces at the point on its production possibility frontier (PP) where the slope of that frontier equals minus the relative price of cloth
what happens to the allocation of labor and the distribution of income when the prices of food and cloth change
an equal proportional change in prices
a change in relative price
when both prices change in the same proportion
no real changes occur
the wage rate (W) rises in the same proportion as the prices. so,
real wages (i.e., the ratio of the wage rate to the prices of goods) are unaffected
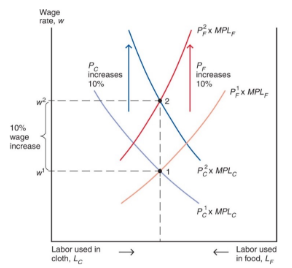
an equal-proportional increase in the prices of cloth and food (graph)
the labor demand curve in cloth and food both shift up in proportion to the rise in Pc from Pc1 to Pc2 and the rise in PF from PF1 to PF2. the wage rate raises in the same proportion, from W1
to W2 but the allocation of labor between the two sectors does not change
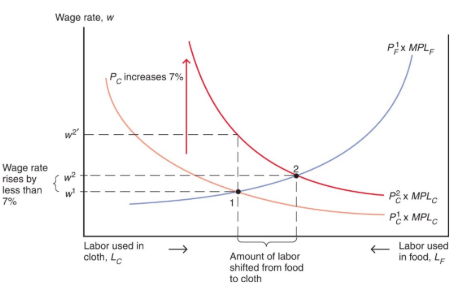
a rise in the price of cloth (graph)
the cloth labor demand curve rises in proportion to the 7% increase in Pc, but the wage rates rise less than proportionately. labor moves from the food sector to the cloth sector. output of cloth rises; output of food falls
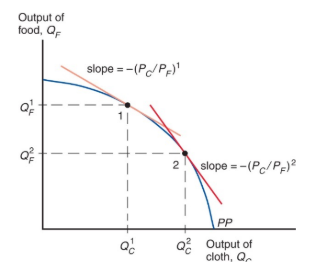
the response of output to a change in the relative price of cloth
the economy always produces at the point on its production possibility frontier (PP) where the slope of PP equals minus the relative price of cloth. thus, an increase in Pc > PF
causes production to move down and to the right along the production possibility frontier corresponding to higher output of cloth and lower output of food
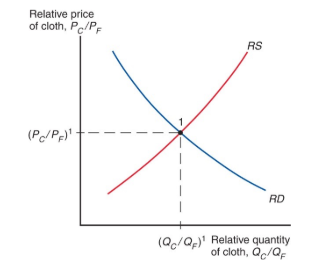
determination of relative prices (graph)
in the specific factors model, a higher relative price of cloth will lead to an increase in the output of cloth relative to that of food. thus, the relative supply curve RS is upward sloping. equilibrium relative quantities and prices are determined by the intersection of RS with the relative demand curve RD
suppose that Pc increases by 10%
then the wage would rise by less than 10%
what is the economic effect of this price increase on the incomes of the following 3 groups:
workers
owners of capital
owners of land
owners of capital
are better off
landowners are
worse off
workers cannot say whether workers are better or worse off
depends on the relative importance of cloth and food in workers’ consumption
the relative price of cloth prior to trade is determined by
the intersection of the economy’s relative supply of cloth and its relative demand
free trade relative price of cloth is determined by
the intersection of world relative supply of cloth and world relative demand
opening up to trade increases
the relative price of cloth in an economy whose relative supply of cloth is larger than for the world as a whole
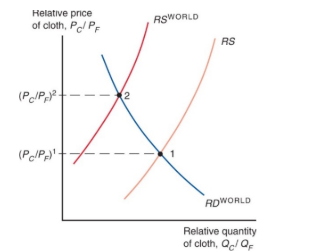
trade and relative prices (graph)
the figure shows the relative supply curve for the specific factors economy along with the world relative supply curve. the differences between the two relative supply curves can be due to either technology or resource differences across countries. there are no differences in relative demand across countries. opening up to trade induces an increase in the relative price from (Pc>PF)1 to
(Pc>PF)2
without trade, the economy’s output of a good must
equal its consumption
the economy as a whole
gains from trade
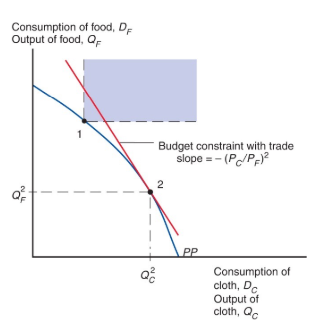
budget constraint for a trading economy and gains from trade
point 2 represents the economy’s production. the economy can choose its consumption point along its budget constraint (a line has a slope equal to minus the relative price of cloth). before trade, the economy must consume what it produces, such as point 1 on the production possibility frontier (PP). the portion of the budget constraint in the colored region consists of feasibly post-trade consumption choices, with consumption of both goods higher than at pre-trade point 1
international trade shifts the relative price of cloth to food
so factor price changes
trade benefits the factor that is specific to the export sector of each country, but hurts
the factor that is specific to the import-competing sectors
trade benefits a country by
expanding choices
trade produces both
winner and losers
how can everyone receive gains from trade
possibly to redistribute income
those who gain from trade could compensate
those who lose and still be better off themselves
everyone could gain from trade but
that does not mean they do - redistribution is usually hard to implement
optimal trade policy
must weigh one group’s gain against another’s loss
some groups may need special treatment because
they are relatively poor (e.g., shoe and garment workers in the United States)
most economists strong favor
free trade
typically, those who gain from trade are
much less concentrated, informed, and organized group than those who lose
example: consumers and producers in the U.S. sugar industry, respectively
governments usually provide a “safety net” of income support to
cushion the losses to groups hurt by trade (or other changes)
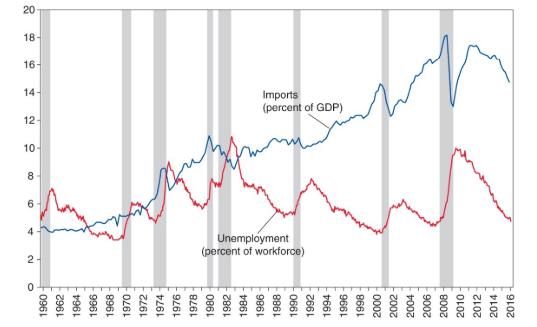
how much employment can be traced back to trade
from 2001 to 2010, only about 2% of involuntary displacements stemmed from import competition or plants moved overseas
(the graph) shows that there is np evidence of a positive correlation between unemployment and imports (relative to U.S. GDP) for the U.S.
after 2012, both imports and unemployment do drop significantly; however, the drop in imports was driven by falling oil prices. non-oil imports as a share of U.S. GDP remained stable in those years