Unit 4.3 Correlation
 Call Kai
 Learn
Learn Practice Test
 Spaced Repetition
 Match
Match Flashcards
 Knowt Play
1/22

There's no tags or description
Looks like no tags are added yet.
Name | Mastery | Learn | Test | Matching | Spaced | Call with Kai | Chat |
|---|
No analytics yet
Send a link to your students to track their progress
23 Terms
Correlation coefficient is a numerical value that ranges between what numbers? What does it indicate?
-1 and +1
Indicates correlation
What can the correlation coefficient between two variable not necessarily indicate?
The relationship
“A line of best fit is a line that passes most closely through-”
“-all the points in a set of two-variable data”
Describe the relationship between line of best fit and the correlation coefficient
Lines of best fit are representative of the data
Correlation coefficient is a numerical derived value to indicate how well the line fits the data
What are the other 2 names the correlation coefficient is known by?
Pearson product-moment
r-value
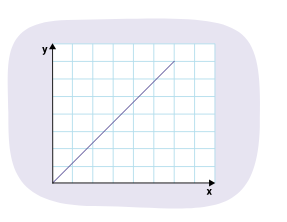
If the line of best fit has a positive slope, will it have a positive r-value?
Yes
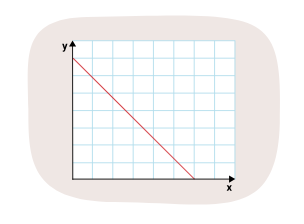
If the line of best fit has a negative slope, will it have a negative r-value?
Yes
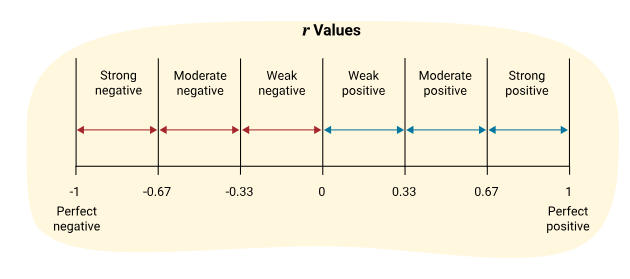
As the r-value gets closer to 1, this indicates-
A stronger positive correlation
As the r-value gets closer to -1, this indicates-
A stronger negative correlation
As the r-value gets closer to 0, this indicates-
A weaker correlation
If the r-value is 1, this indicates-
A perfect positive correlation
If the r-value is -1, this indicates-
A perfect negative correlation
If the r-value is 0, this indicates-
No correlation
In GeoGebra Spreadsheets, how would you find the exact values for line of best fit, r-value, slope etc.?
Click back into your data and highlight
From the top toolbar, choose the one that looks like a bar graph and click two variable regression analysis
At the bottom, make sure linear is selected
From the toolbar at the top right, click the tab that looks like “Ex”
At the bottom of the page you will be able to see the equation and from the stats section you can see the r-value
What are 2 things to remember when interpreting results of data analyses?
Sample size
Outliers
Define outlier
A point that lies away from the pattern established by the rest of the data points
An outlier may skew both the line of best fit and the r-value
When are 2 times that an outlier could be removed/disregarded?
Outlier occurs form an error in recording the data (e.g. a height of 167cm was recorded as 67cm)
Outside factors affected the data (e.g. data was collected every day but there was a power outage on Tuesday and nothing was recorded)
To determine if a sample size is too small, what are 3 things to think about?
Does the size of the sample seem appropriate to the size of the population?
Is the size of the sample large enough to predict the relationship between the variables?
Is the range of the independent variable appropriate for meaningful predictions to be made using the line of best fit?
What percentage of a population is generally okay for a sample?
Usually around 10%
When using GeoGebra Spreadsheets, if you have the scatter plot and have found all the equations, what would you do if the question as for a quadratic equation?
Same pathway as last time except instead of “linear” choose “polynomial - 2”
When considering correlation for a quadratic equation instead of a linear one, do you use r-value still?
Close - use r2
When extrapolating, could there be a problem with having a linear line of best fit vs. a quadratic one?
YES.