EXST 2201 Final Exam Fall 2023
1/432
There's no tags or description
Looks like no tags are added yet.
Name | Mastery | Learn | Test | Matching | Spaced | Call with Kai |
|---|
No analytics yet
Send a link to your students to track their progress
433 Terms
To see if the data is unimodal, symmetrical, and without any exceptions.
Why is it important to look at the shape of a column of data before interpreting any statistics? (2.2)
A chart is needed to summarize the shape characteristic so that we can see it.
Why look at a chart to get shape information instead of looking at the data values themselves? (2.2)
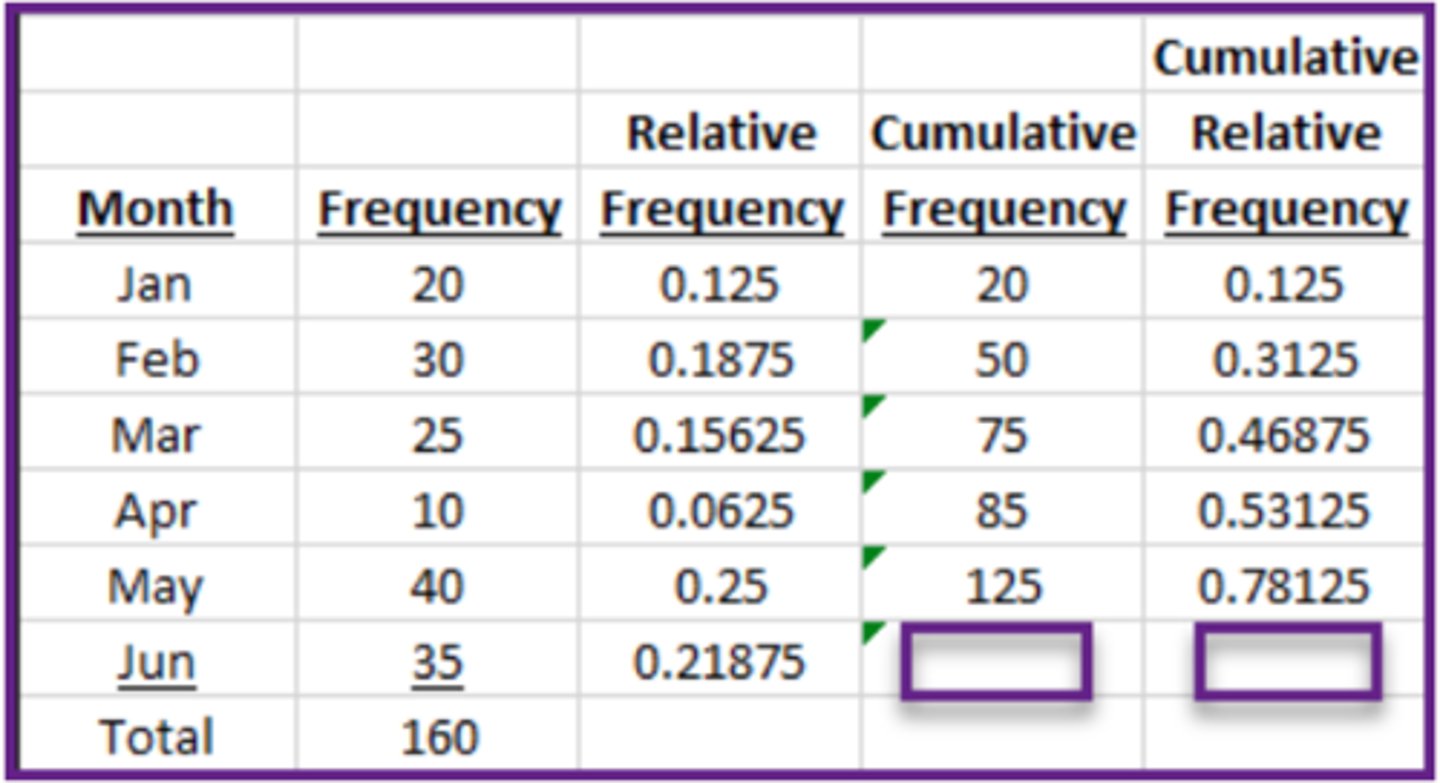
Cumulative Frequency
Which of the following answers is NOT one of the first three columns in a frequency table? (2.2)
160.0 and 1.0
In the frequency table below, what is the cumulative frequency and the cumulative relative frequency for the category Jun? (2.2)
A bar chart where the bars do not touch each other
What type of graph is most appropriate to use to display the shape of qualitative data? (2.2)
True
T or F: A Pareto chart just a bar chart with the bars rearranged from the highest bar to the lowest bar (2.2)
A histogram where the bars do touch each another
What type of graph is most appropriate to use to display the shape of discrete data? (2.2)
The data values in the data set on the x-axis, and the frequency of the data values on the y-axis
In a histogram for discrete data, what characteristic is shown on the x-axis, and what characteristic is shown on the y-axis? (2.2)
Bins of the data values on the x-axis, and the frequency of the data values in the bins on the y-axis
In a histogram for continuous data, what characteristic is shown on the x-axis, and what characteristic is shown on the y-axis? (2.2)
True
T or F: When making a histogram for continuous data, a bin is just a range of possible data values (2.2)
False
T or F: A boxplot is used to display the shape of qualitative data (2.2)
True
T or F: A boxplot shows location and spread information as does a histogram (2.2)
50%, and 50%
In a boxplot of continuous data, what percent of the data values lie inside the box, and what percent of the data values lie outside the box? (2.2)
27.5
In the boxplot below, what is the value of the median? (2.2)
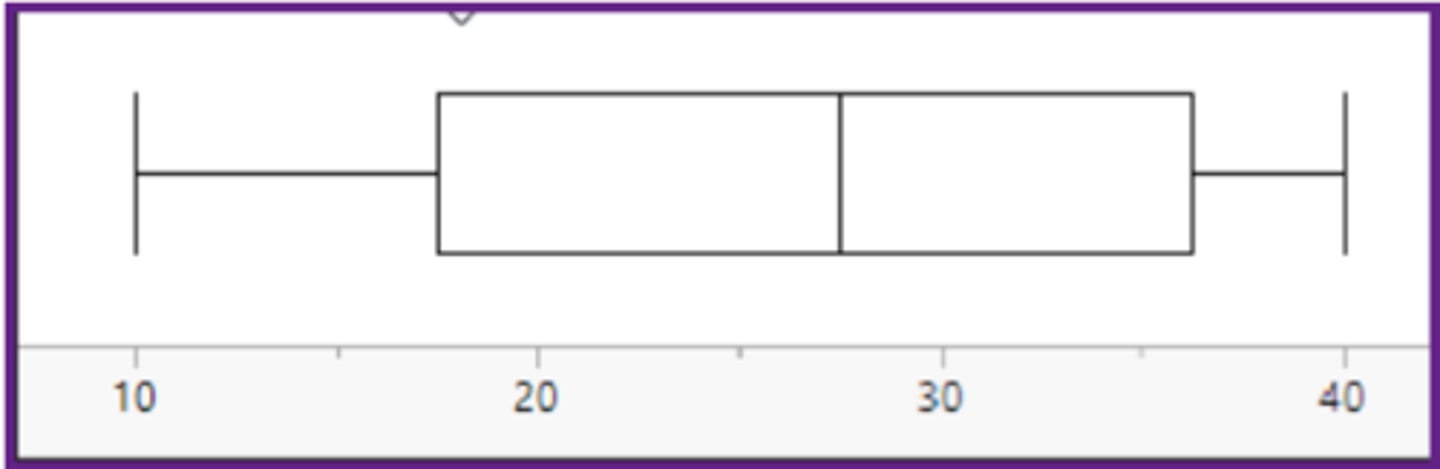
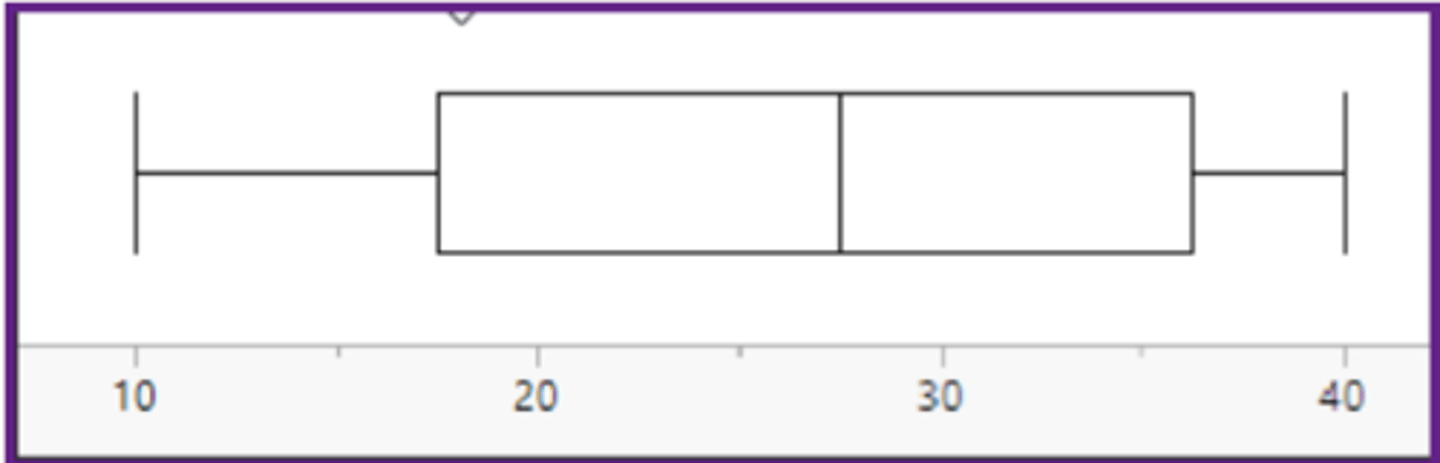
The spread of the data values
In any boxplot (an example is shown below), the width of the box shows what characteristic of the data values? (2.2)
First look at the overall shape, then look for exceptions
What is the general approach to analyzing the information in a histogram? (2.2)
A modeless shape
Which of the following answers is NOT one of our overall shapes? (2.2)
False
T or F: A skewed left shape means that the peak of the histogram is on the left side of the histogram. A skewed right shape means that the peak of the histogram is on the right side of the histogram (2.2)
The tails
Skewness in a histogram is a property of what in the histogram? (2.2)
Any bimodal shapes
Which of the following answers is NOT an exception when analyzing a histogram? (2.2)
A gap is fits as part of the overall shape. An extreme value is outside the overall shape
How is a gap distinguished from an extreme value? (2.2)
Divide by the degrees of freedom
How is the sum of squares (SS) standardized into variance (σ2)? (2.3)
No, because the average deviation always equals zero
Is the average deviation better than the standard deviation (σ)? (2.3)
False
T or F: The mean (µ) is NOT needed to calculate a deviation (2.3)
True
T or F: In statistics, a deviation applies to only one data value (2.3)
False
T or F: A deviation can never equal zero. (2.3)
The mathematical distance and direction from the mean
What information about a data value is given by its deviation? (2.3)
Spread wider apart
A bigger standard deviation for a data set means the data values are? (2.3)
σ2 for population, s2 for sample
What is the appropriate denotation for variance? (2.3)
Data set B, because a sum of squares of 197 is bigger than a sum of squares of 97
Two data sets have the same size, but Data set A has a sum of squares of 97 and Data set B has a sum of squares of 197. In which data set are the data values more widely spread out? (2.3)
Yes, because the positive and negative deviation cancel each other
Does the average deviation always equal zero for every data set? (2.3)
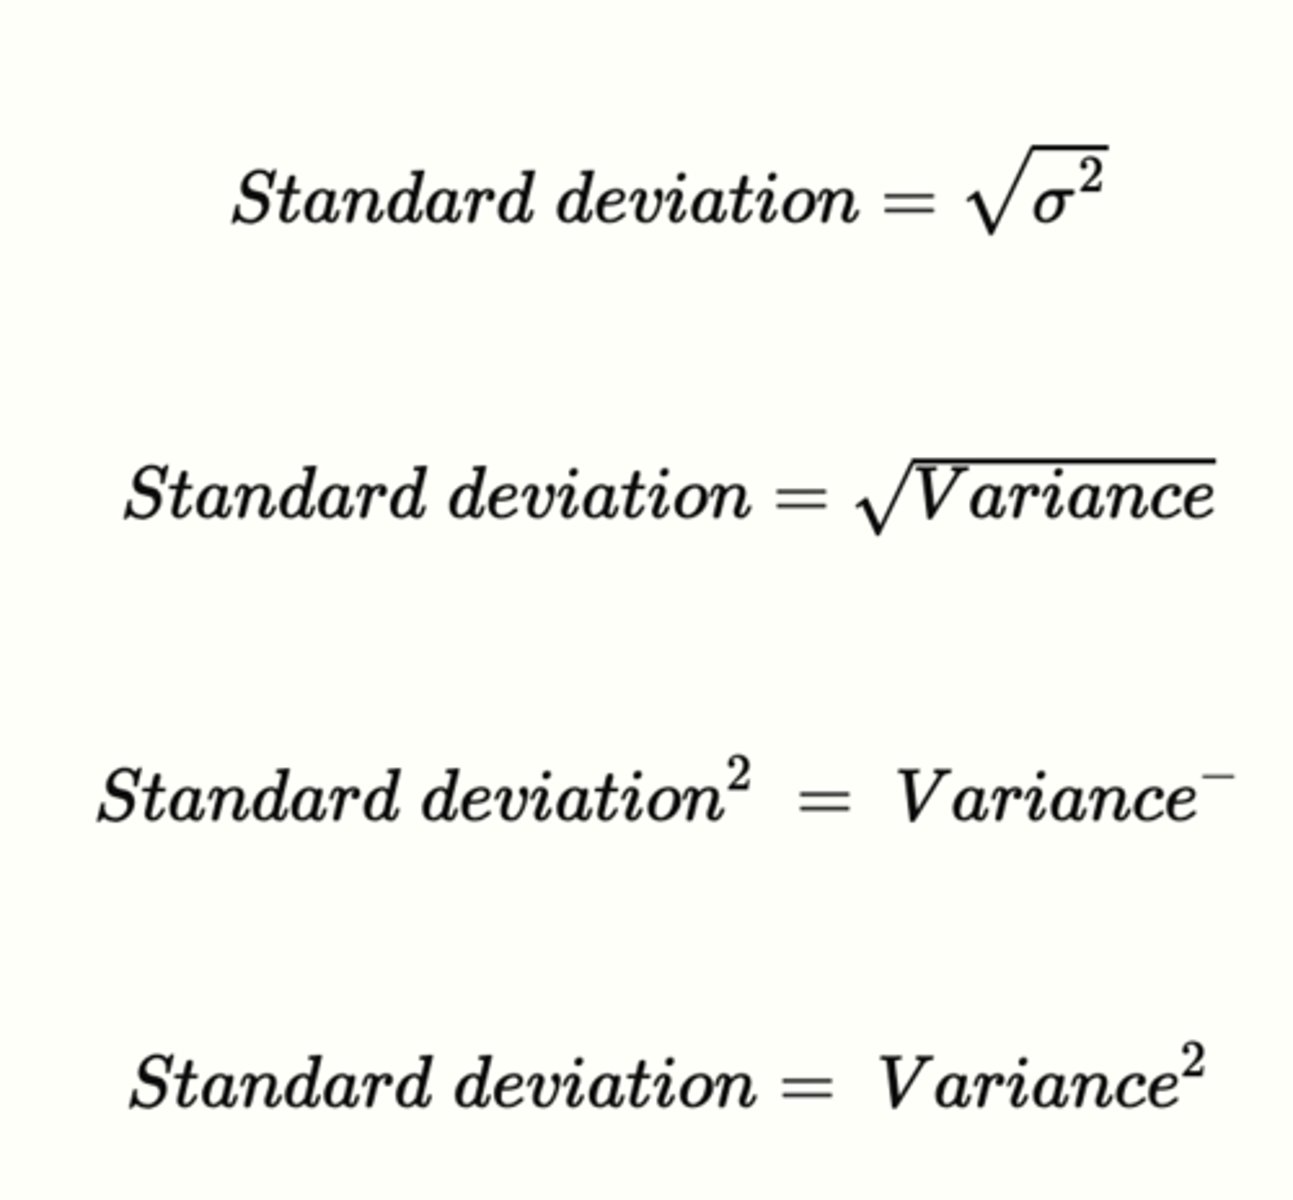
Standard deviation = Variance^2
Which one of the following answers is NOT correct about standard deviation? (2.3)
A raw measure of spread
The sum of squares (SS) is what type of measure of spread? (2.3)
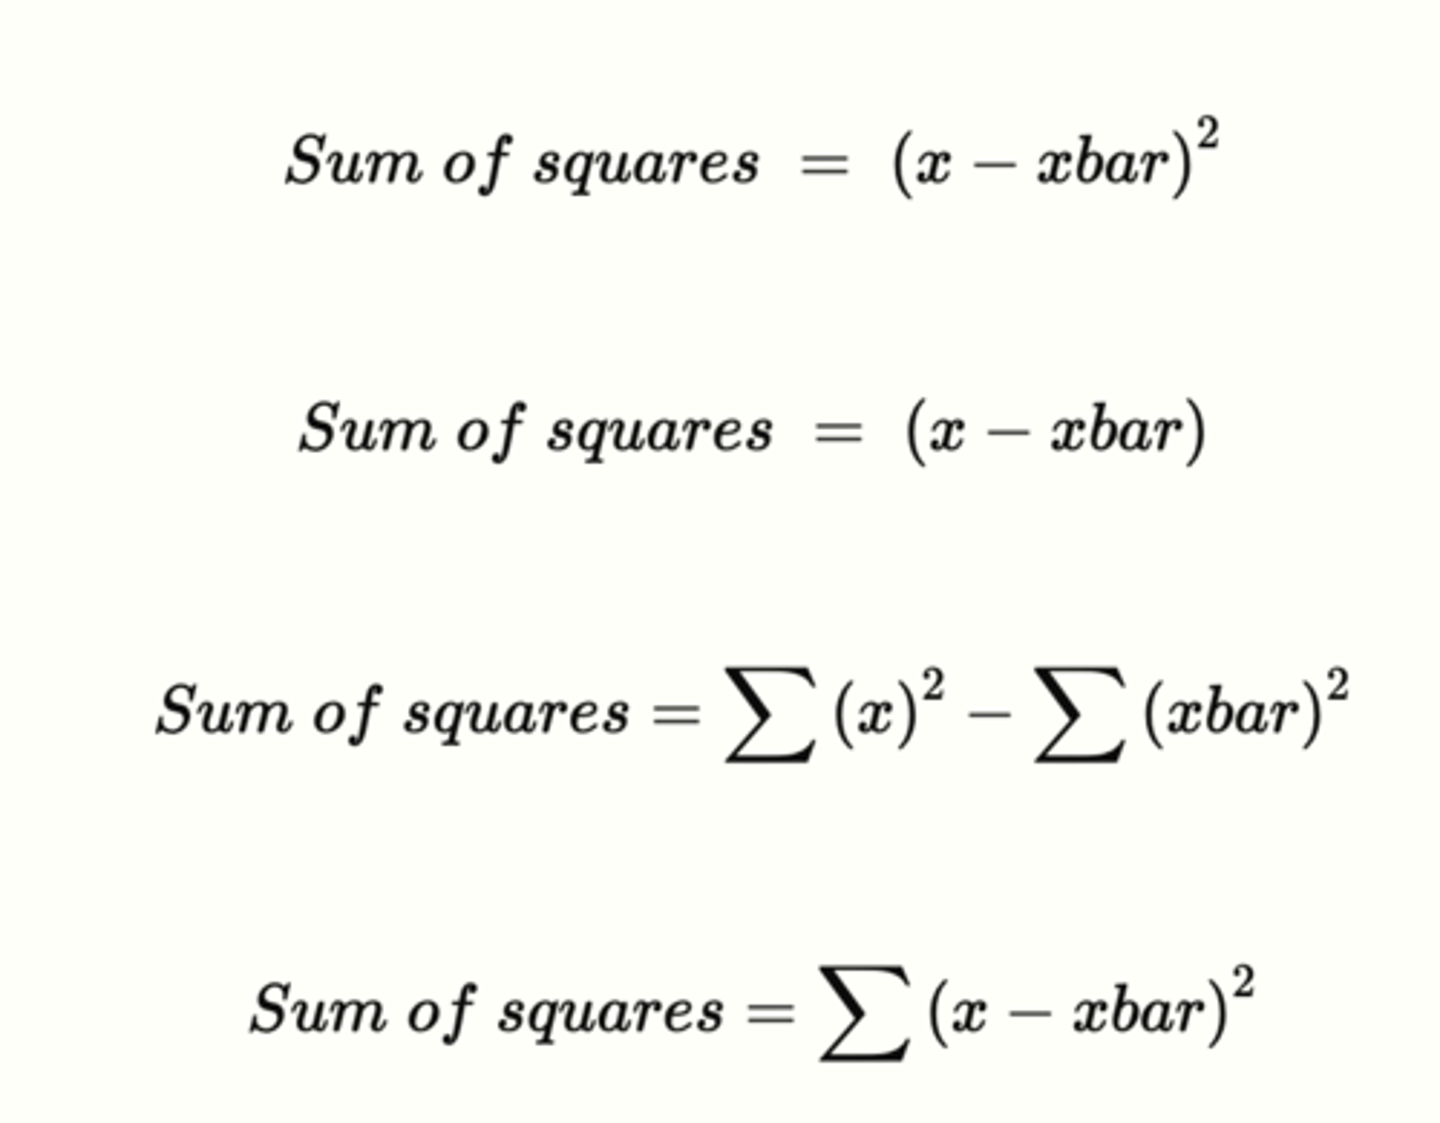
Sum of squares = ∑(x−xbar)^2
What is the formula for the sum of squares (SS)? (2.3)
Standard deviation
The efficient measure of spread for a column of data is the? (2.3)
Sum of squares
What is the statistical term for all the squared deviations added together? (2.3)
A measure of spread standardized for the number of data values
Variance (σ2) is what type of measure of spread? (2.3)
Yes, it can with a normal curve
Can the standard deviation (σ) be used to find probability? (2.3)
Negative deviation
A data value less than the mean has a? (2.3)
- A single number is easy to think about.
- The mean best represents the values in the column of data.
The mean (µ) is used when thinking about the data values in a column of data because? (select two of the answers below) (2.3)
- The mean is easier to calculate than the median.
- The mean can be used in advanced statistical methods.
- A single number is easy to think about.
- The mean best represents the values in the column of data.
Small deviation
A data value close to the mean has a? (2.3)
Squared deviations
To calculate variance, statistics does not average the deviations, instead it averages the? (2.3)
Yes, because there are more numbers in the data set to sum
Does the sum of squares (SS) usually get bigger as more data values are added to the data set? (2.3)
σ for population, s for sample
What is the appropriate denotation for standard deviation? (2.3)
The presence of extreme values
What are resistant statistics resistant to? (2.4)
They look at the position of the data values, and not at their values
What makes resistant statistics work? (2.4)
The data values must be ranked from lowest to highest
To find resistant statistics, what must be true of the data set? (2.4)
False
T or F: Percentiles are NOT positional statistics (2.4)
False
T or F: The value of the third quartile (Ǫ3) can be less than the value of the first quartile (Ǫ1). (2.4)
False
T or F: Percentiles (Pk) (or quartiles (Ǫk) must always be a data value in the data set. (2.4)
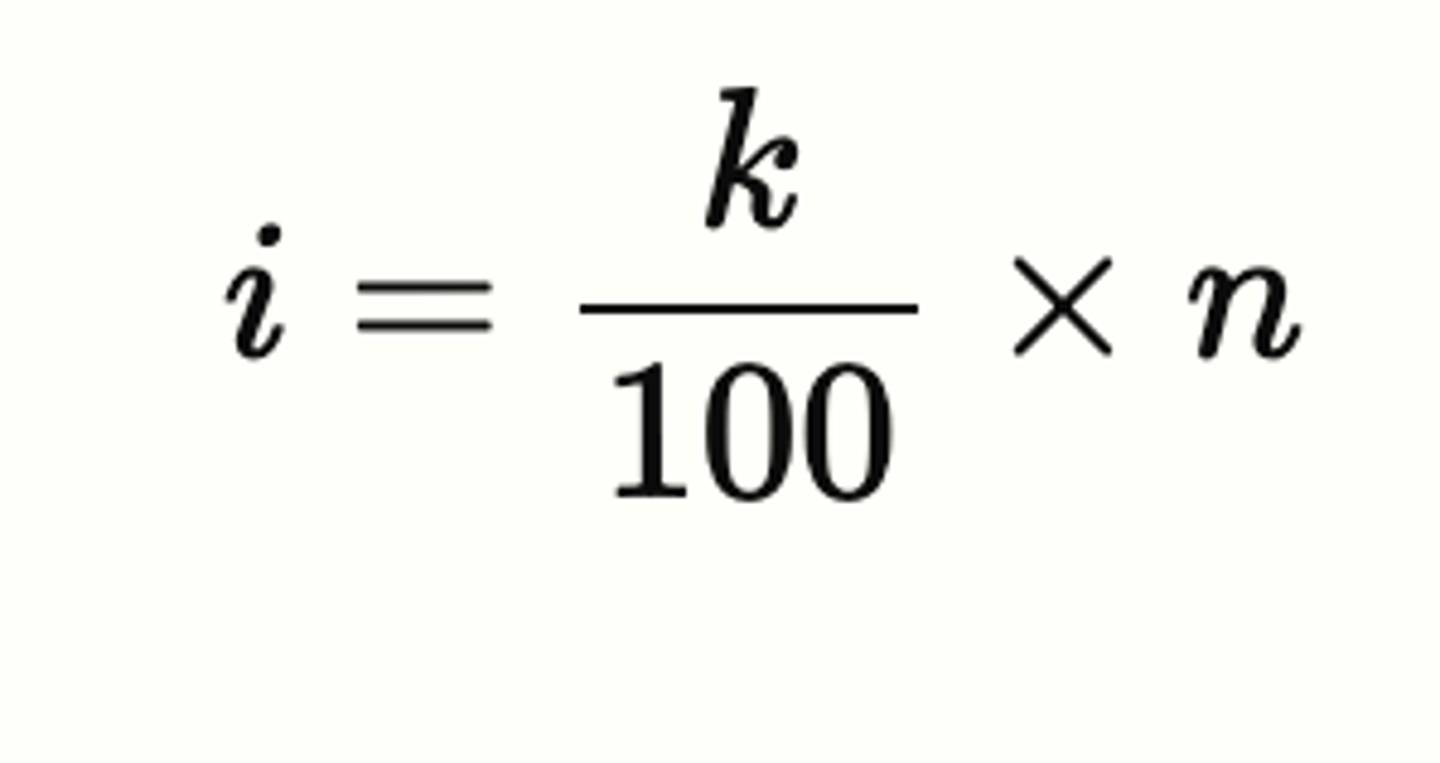
True
T or F: The appropriate equation to use in Step 1: Calculate the Index of finding a percentile (Pk)is shown below. (2.4)
True
T or F: The interquartile range (IQR) can never be negative. (2.4)
False
T or F: The range is a reliable measure of spread. (2.4)
Because in the tails, a big change in value is usually a small change in position
Why do positional statistics work for a data set containing extreme values? (2.4)
Which percentile is desired, the 0th percentile up through the 100th percentile
When denoting a percentile (Pk) what does the k stand for? (2.4)
Three quarters (75%)of the data values
How many data values are less than the value of the third quartile (Ǫ3)? (2.4)
None of the other choices
Which of the answers below are NOT one of the steps to find any percentile (Pk)? (2.4)
If i is an integer, average that and the next higher data values. If i has a decimal, move up to the next higher data value
In Step 2: Move to the correct position of finding a percentile (Pk), how is the appropriate move decided? (2.4)
14 / 41
What is the first quartile (Ǫ1) / third quartile (Ǫ3) in the following ranked set of data (n = 15)? (to one decimal place = 00.0)
9,13, 14, 14, 15 18, 19, 24, 30, 37 40, 41, 44, 44, 193
(2.4)
Middle half (50%)
The interquartile range (IQR) measures the spread of what part of the data set? (2.4)
The values of the data values are spread wider apart
What does a larger value for the interquartile range (IQR) mean about the data values? (2.4)
All of these other answers
What information is given by a five number summary? (2.4)
90 is an extreme value because the upper fence is 81.5
Are there any extreme values in the ranked set of data below (n = 15)?
-19, -3, 11, 14, 15 18, 19, 24, 30, 37 40, 41, 44, 44, 90
(2.4)
To give a lower limit and an upper limit on the data values to detect extreme values
Regarding a five number summary, what are the fences used for? (2.4)
4.70, and 8.30
What is the value of the lower fence, and of the upper fence, in the five number summary below?
{0.2, 6.05, 6.45, 6.95, 8.2} (2.4)
0.2 because the lower fence is 4.70
Are there any extreme values in the data set that has the five number summary below?
{0.2, 6.05, 6.45, 6.95, 8.2}
(2.4)
Because the distribution can be used to find the probability of an event
Why is the distribution of a data set so important? (3.1)
The probability of an event
What information does an area under the normal curve give? (3.1)
False
T or F: The probability of an event can mean two things:
1. The proportion of the population described by the event.
2. The chance an individual will be randomly selected. (3.1)
False
T or F: Only one critical parameter is needed to calculate probability with a normal curve. (3.1)
True
T or F: A normal curve can be described with one specific mathematical equation, if the values of the variables are known. (3.1)
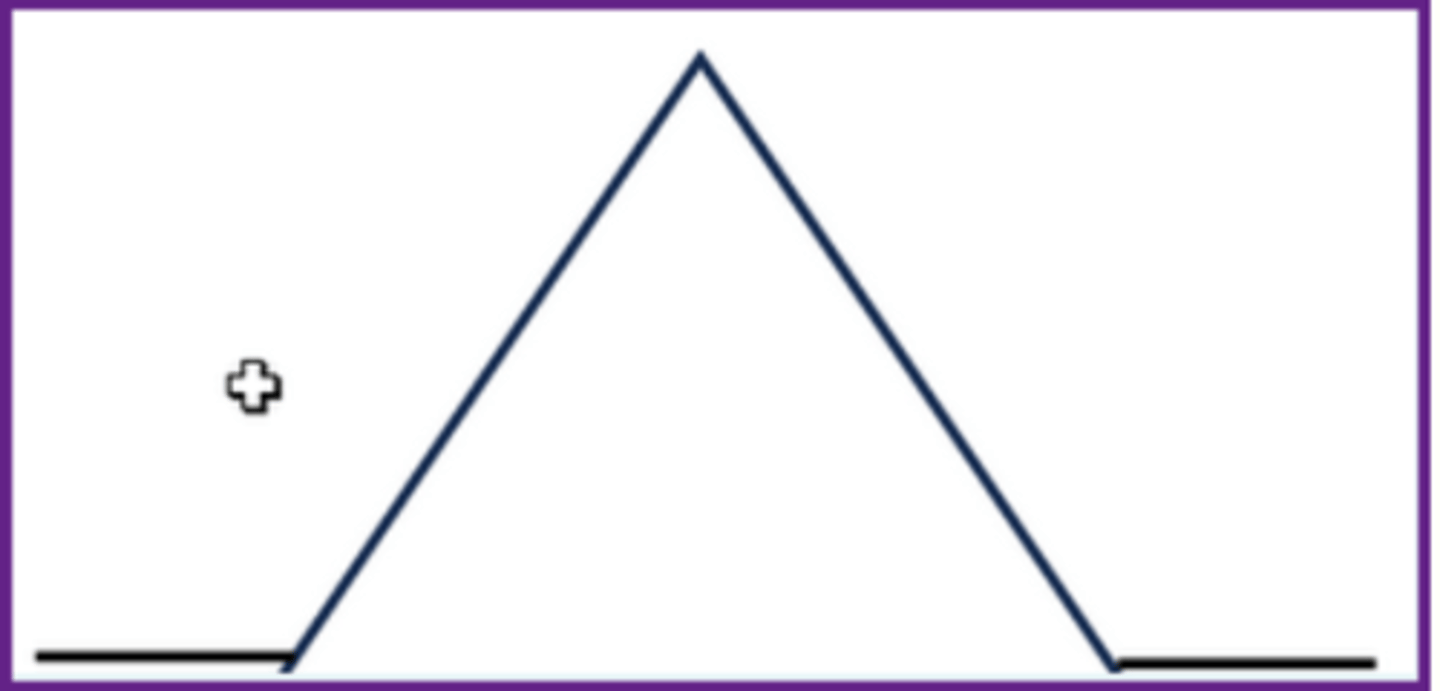
False
T or F: The curve below is a normal curve. (3.1)
False
T or F: On a real number line, a change in the mean shifts a normal curve horizontally, and a change in the standard deviation shifts the normal curve vertically (3.1)
True
T or F: Standard deviation (σ) is another way to give the width of a normal curve. (3.1)
True
T or F: For the Shapiro-Wilk test for normality, a P-value = 0.25 means that the data follow a normal shape. (3.1)
True
T or F: The areas defined in the Empirical Rule of statistics are valid for all normal curves. (3.1)
Probability of an event can be used to make a better decision
Why is the probability of an event so important in the science of statistics? (3.1)
Mean (µ) and standard deviation (σ)
What are the critical parameters of a normal curve? (3.1)
An event is an area under a normal curve
Which of the following answers is NOT true of a statistical event. (3.1)
An area from the z-table
What is the appropriate mathematics to use to find a left tail area? (3.1)
An area from the z-table + an area from the z-table
What is the appropriate mathematics to use to find a two-tail area? (3.1)
1 - An area from the z-table
What is the appropriate mathematics to use to find a right body area? (3.1)
1 - a left area from the z-table - a right area from the z-table
What is the appropriate mathematics to use to find a middle body area? (3.1)
The larger area from the z-table - the smaller area from the z-table
What is the appropriate mathematics to use to find a right-side area? (3.1)
The information beyond µ±3σ is much harder to calculate
Which of the following answers is NOT true about why the Empirical Rule focuses out to (µ±3σ), but not beyond? (3.1)
Mean = 0, and standard deviation = 1
What is the mean (µ) and standard deviation (σ) of the standard normal distribution (z-distribution)? (3.2)
The standard normal distribution
The z-curve is a graph of what distribution? (3.2)
The event on the x-axis
In the standard normal distribution, what are z-scores used to describe? (3.2)
False
T or F: There are an infinite number of standard normal distributions. (3.2)
True
T or F: The standard normal distribution ( z-distribution) follows the Empirical Rule of statistics. (3.2)
True
T or F: The area under the standard normal curve = 1. (3.2)
-∞ < 𝓏 < +∞
What is the range of z-scores? (3.2)
0.0228
Use the schematic curve and the z-table to find the probability of an individual having a z-score greater than +2.00? (3.2)
0.9802
Use the schematic curve and the z-table to find the proportion of a population between z = -2.33 and z = +2.33? (3.2)
0.9394
Use the schematic curve and the z-table to find the probability of an individual having a z-score greater than -1.55? (3.2)
0.6700
Use the schematic curve and the z-table to find the proportion of a population having a z-score less than +0.44? (3.2)
0.9500
Use the schematic curve and the z-table to find the proportion of a population between z = -1.96 and z = +1.96? (3.2)
0.0134
Use the schematic curve and the z-table to find the proportion of a population between z = +1.77 and z = +1.96? (3.2)
0.9110
Use the schematic curve and the z-table to find the proportion of a population between z = -1.40 and z = +2.40? (3.2)
All of the other answers
Use the schematic curve and the z-table to find the proportion of a population less than z = -1.96 and greater than z = +1.96? (3.2)