RMDA Final Exam
1/90
There's no tags or description
Looks like no tags are added yet.
Name | Mastery | Learn | Test | Matching | Spaced |
|---|
No study sessions yet.
91 Terms
Surveys
Method of gathering information from participants via self report
Can be used for frequency or association claims
Can be used to capture attitudes/judgments
Survey validity
Dependent on:
Feasibility
Ex. Studying infants, cant ask them to talk
The questions themselves
Are questions neutral or do they lead participants to an answer
Types of questions
Open-ended
Forced-choice
Likert scale
Open-ended
Allows the participant to fill in the response in any way they like
Trouble: Ability to condense what they’re saying to analyze/code
Good for:
Sensitive or socially disapproved behaviors Ex. Drinking or sexual behaviors
Research questions on explicit content of a self-generated response or information implicit in reponse Ex. Use of language
Preliminary Research
Forced-choice
The participant is given a limited set of options and must choose one
Anytime they give you a label at the end its forced choice (Ex. Personality quiz)
Disadvantage:
People might not know what category they belong in
Lose “richness” lose more talking
Good for:
Easily analyzed
Auto-scored
Likert scales
Provide a range of forced-choice responses that are ratings
Could be 1-5, stars, strongly agree to strongly disagree, etc
Ex. Amazon ratings and psych evals
-Individually: Ordinal
-Mean of several: Interval
Disadvantages of forced-choice
Ex. What is the most important social issue today
abortion
Healthcare
schools
energy
Particiants would pick one, but when open-ended they rarely bring those things up
Question wording
Both the strucutre and the wording can implicitly suggest a range of appropriate answers
Can ask the same question worded slightly differently and get different responses
Ex. Not allowing vs. forbidding
Can impact witness testimony
Questions to avoid
Leading questions, double-barreled questions, negatively worded questions, question order
Leading questions
Type of question in a survey/poll thats wording encourages only one response
Ex. How would you rate the legendary Reds player Pete Rose?
Double-barreled questions
Type of question in survey/poll that asks two or more questions in one
Ex. Do you feel it is worth an additional expense to provide internet connectivity to cardio machines to have additional features of workout tracking, social media, and video streaming
Negatively worded questions
Type of question in survey/poll that contains negatively phrased statements, making its wording complicated or confusing
Ex. Rate extend to which you agree or disagree that students should never go to class
Question order
Question order biases later responses
Which of these four activities are your favorite ways to exercise? Walking, biking, running
How often do you exercise in a week
What to consider when writing a good survey
-Question structure (Open vs. forced choice)
-Wording of questions
-Question order
Participant issues
Shortcuts and biases
Response sets
Fence sitting
Social desirability
Limits of what can be self report
Response set
When participants give consistent responses across questions to save time, rather than accurately answering each question
Ways to reduce response set
Include reverse-wording
Ex.
In most ways my life is ideal
If I could live my life over, I would change almost everything
Fence sitting
Participants hesistate to choose extreme answers and always opt for neutral responses
How to combat fence sitting
Get rid of neutral option
Social desirability biases
Participants may respond in a way they think is socially desirable
Ex. Person who doesnt answer truthfully about smoking or sexual behaviors
Way to combat social desirability biases
-Decide ahead of time: if someone responds in the socially desirable way x amount of times they won’t be included in the analysis
-Implicit association tests (person doesn’t know they’re responding undesirably)
Limits to self report
-Can’t ask more than what someone could reasonably know
-We don’t always know why we think, feel, believe something
-False memories
Designing a questionnaire steps
1.Define the problem
2.Plan how it will be administered
3.Write the questionnaire
4.Desk check (face validity, make sure questions are good)
5.Pilot survey
Observational research
A researcher watches or monitors participants (people or animals) and systematically records their behavior
Naturalistic observation
“In the wild”
-Can give the most accurate measure of behavior
Disadvantage: May not giver the opportunity to observe relevant behavior
Ex. Trying to see the amount of yelling at a hockey match
Controlled observation
Observation in a controlled setting
Ex. Driving simulators
-Reduces variability
Ex. Too much noise, can’t hear what people are saying
Disadvantage: Less natural, people know they’re being observed
Participant Observation
Experimenter interacts with participants
Disadvantage: Participants know they’re being observed
Observer bias
Observers have inherent biases that can affect interpretation of data
Ex. If you hear a loud noise you might could that as yelling at hockey game
To avoid observer bias
-Multiple researchers
-Very specific codings
-Double blind
Observer effects
Participants change behavior to match observers’ expectations/behavior
Ex. “Clever Hans”
To avoid: Double blind
Reactivity
Participants may act differently if they know they are being observed
*Observer isn’t cuing a behavior, people are just acting differently because they know they’re being watched
Ways to combat reactivity
-Blend in by unobtrusively observing
-Wait until participants are used to being observed
-Use implicit measures of the behavior rather than directly observing behavior
Ex. Looking at cigarette butts
Self-report vs. observation
Self-report: Rely on participants reflecting on their thoughts, feelings, or behaviors
Observation: Records actual behavior. Some behaviors are hard to record with observation (ex. feelings of self-worth)
What type of claim do we typically test with correlations
a. Frequency
b. Association
c. Causal
b
What makes a study correlational
Only measured variables (no manipulated)
Sometimes thats all you can do
-Age
-Ethnicity
-Family status
-Brain injury
Do correlational studies have quantitative or qualitative variables
Quantitative, no nominal variables
Correlation statistic
Tells us about the link between values of two variables
Strength
Direction
-Range from -1 to 1
-Knowing the value of one variable tells us about the value of the other variable
Strength and direction
Strength: Can be visually estimated by how close the points are to a trendline. Range -1 to 1
Direction: (pos/neg) shown by the slope
little p
Population parameter for the statistic
Exists somewhere out there, we just don’t know it
Inferential statistic
little r
Correlation coefficient
The data we collect, organize, and summarize with descriptive statistics
How does the sample size affect the variation of sample estimates around the population estimate
it decreases because sample becomes closer to the real life number
r
-unitless measurement
-effect size for the strength of the relationship
-effect sizes are comparable across different variables and studies
-no matter what we’re measuring, r is on the same scale
Effect size
Effect size is a quantitative measure of the magnitude or strength of a relationship or difference, independent of sample size
More extreme vlaue = more extreme relationship = bigger effect
Null hypothesis
Default: There is no relationship H: p > 0
Alternative HA: p < 0
Computing r
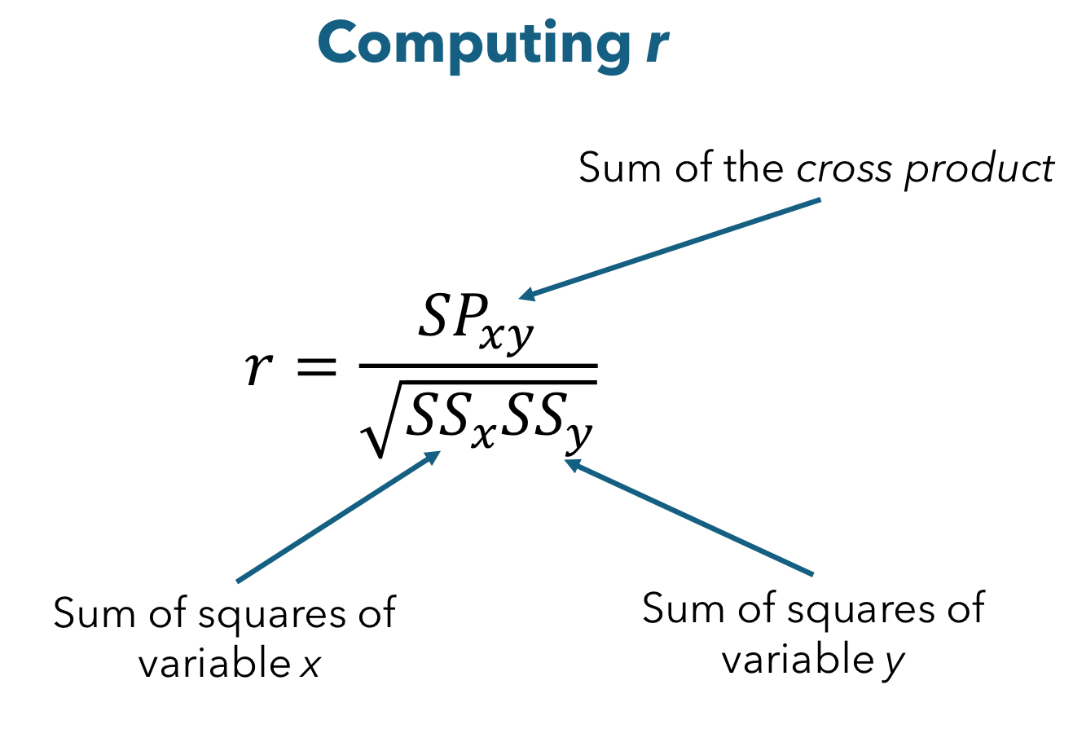
Denominator
Sums of squares for x times sums of squares for y
Square rooted
Tells us about the variability of the two variables
Sums of squares
(Xi-mean)2 + (Yi-mean)2
Numerator
How much variability is related between those two variables
SPxy
((Xi-mean) times (Yi-mean))
What does it mean if r=1 or r=-1
All variability is shared
Perfectly moving together in a pos/neg way
What part of the r equation can be negative
Numerator
Denominator has sums of squares where things are squared
Strength of correlations
Strong: (0.7,1]
Moderate: [0.5,0.7)
Weak: [0.3,0.5)
None or very weak: [0, 0.3)
Outliers impact on correlation
Impacts correlation
Possibilities:
Outlier above the line - when this happens relationship is strengthened
Outlier below the line - when this happens the relationship is either weakened or will mask it
Sample size impact on correlation
Increased sample size = increased power
If power is high then we can call it stat. sign more easily
Doesn’t matter as much for stronger correlations but does for weaker ones
Effect size vs. Statistical significance
Effect size = strength
Stat. sign = the p-value
P-value is determined by effect size and sample size:
Larger the effect size, lower the p-value
Larger the sample size, lower the p-value
Range restrictions
Correlations may exist across a wide range, but be imperceptible in small portions of the range
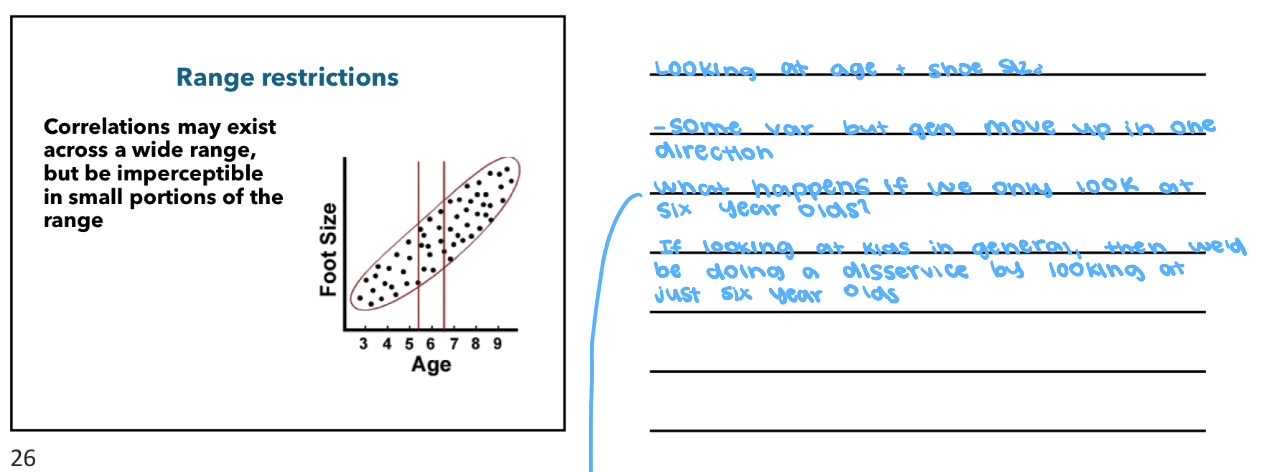
If we just look at one portion, then the relationship changes
-Range restrictions often arise from biased sampling
Third variables
When a relationship arises because of another variable
Ex. Grip strength and Memory
Third variable: Age
Ex. Height and reading score
Third variable: Grade level
Problem of establishing causation
Covariance
Temporal precedence
Internal validitity
Covariance
How much two variables change together
-In other words: is there a correlation
-Scores being related to each other is necessary for establishing causation, but not sufficient for establishing causation
-This is why correlation does not always mean causation
Temporal precedence
Ability to know which variable comes first
Ex.
Teachers niceness > Student learning
Student learning > Teachers niceness
Internal validity
The extent to which the effect arises because of variable(s) of interest, and not some alternative variablesM
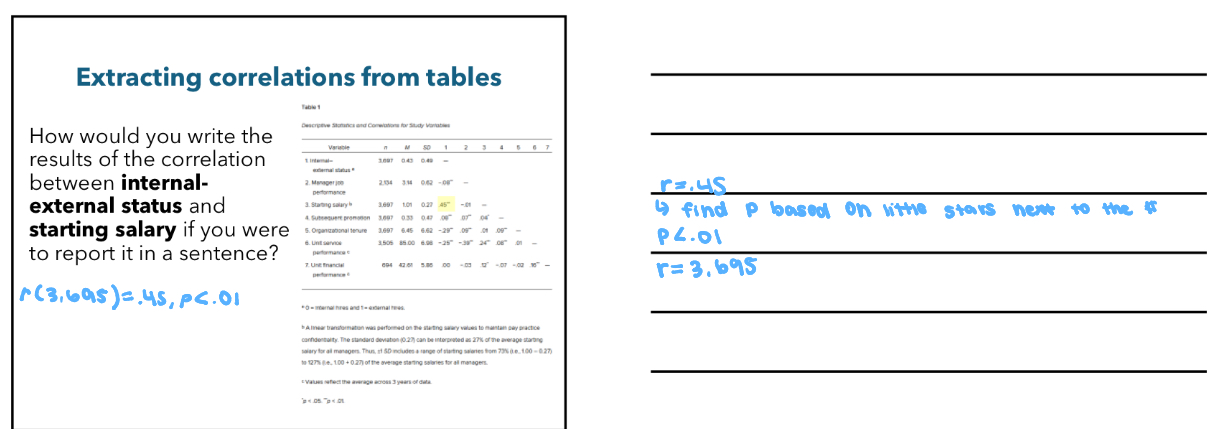
Reporting statistics in APA style
Symbols are italicized but the values are not
M = 3.25 (SD = 1.10)
r = .57, p < .05
For most results, round 2 decimal places, for p-values round 3
For correlational need to have degrees of freedom and either p-value or CI
Don’t use a leading zero (Ex. 0.30) (Correct: .30)
Regression Equation
Describes the precise numeric relationship between the variables
Best-fitting line
Lets us predict scores of one variable given scores of the other in measured units
Regression line = Best-fitting line
Lets us go beyond strength of relationship and let us predict future data points
Homoscedasticity
Assumption that error in our prediction is evenly distributed across range of x and y
Least-squares method
Minimizes errors in prediction based on our regression line
Error = Y-Ypredicted
Least-squares regression equation
Yi’ = bxi + a
Yi’ = Predicted value of yi
b = Estimated slope of Y (b) times value of xi (our x score of interest)
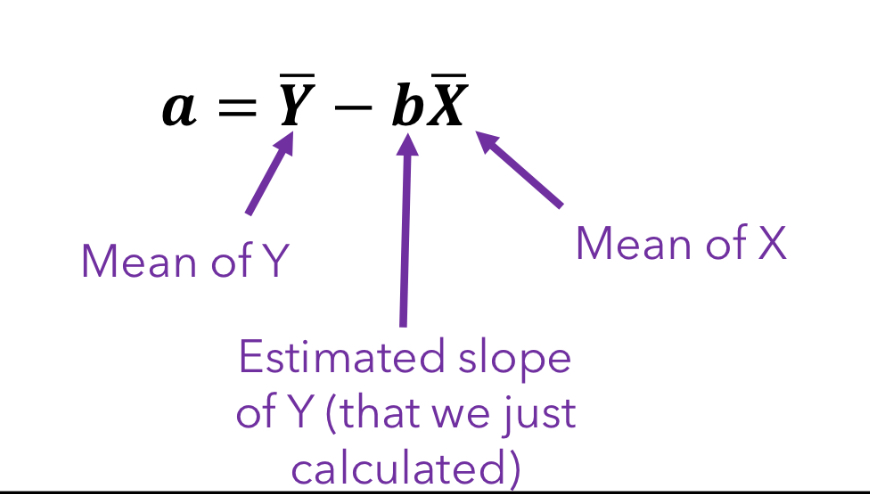
a = Estimated intercept
Regression line example
How many behavioral problems per class period could we expect if we give students 30 minutes of recess?
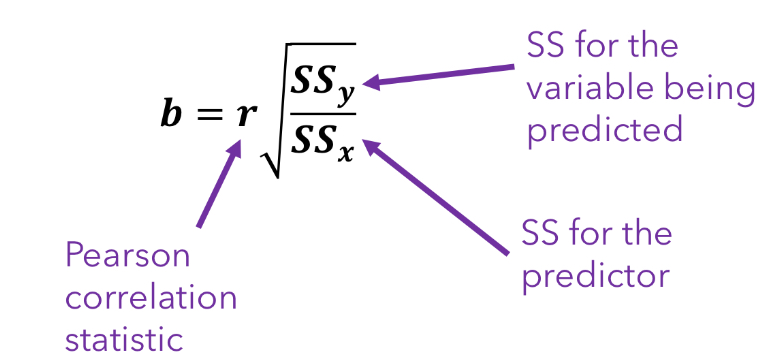
How do we compute b?
(b = the slope of the line)
How do we compute a?
(a = the intercept of Y)
What do you calculate first in the regression formula
b (slope)
Regression lines let us predict Y scores from X scores
True
False
True
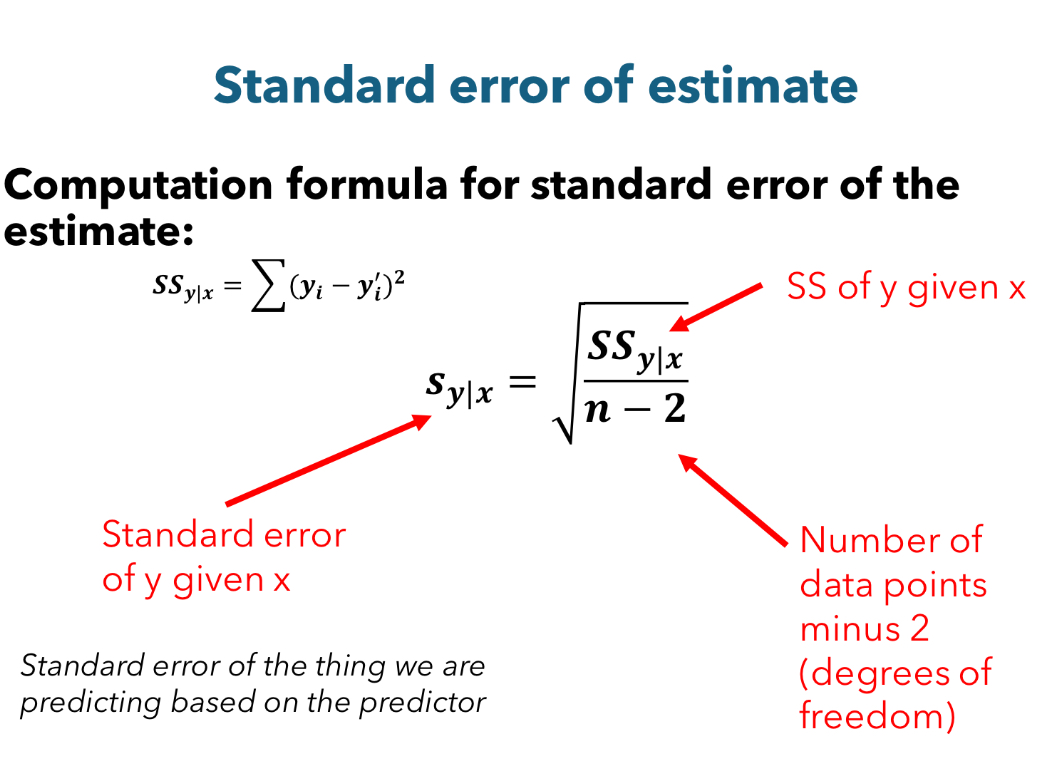
Standard error of the estimate
Amount of deviations from the predicted line in units of the predicted variable
SD = Average dev’s from a mean
SE = From the reg line
Standard error formula
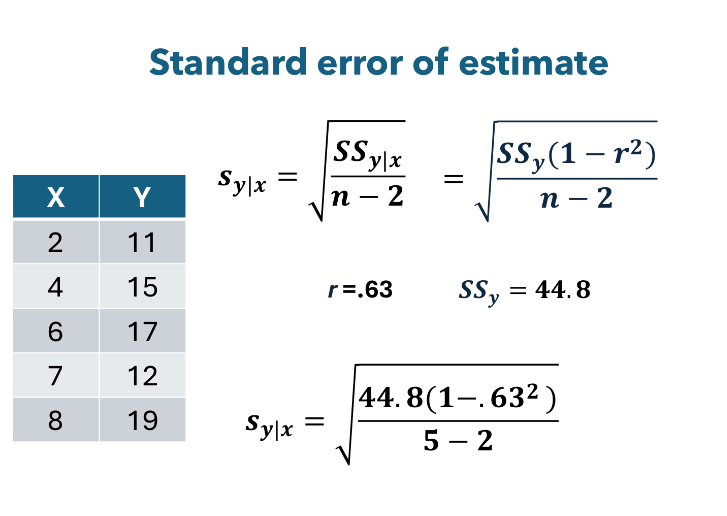
If you have a SE of three what is that telling you
In general, the prediction from the regression line is off by three points
If exam question was “which of these SE would you want to have” choose the lowest one
The units are in the OG
What does the standard of the error represent
The amount of unexplained variability
The standard error of the estimate tells you how far off the model’s predictions typically are from the actual values.
r squared answers what
How good we are at capturing the variability
How much variability in Y the regression explains with X
How much better we did by using X instead of simply the mean of Y
Proportion of variability
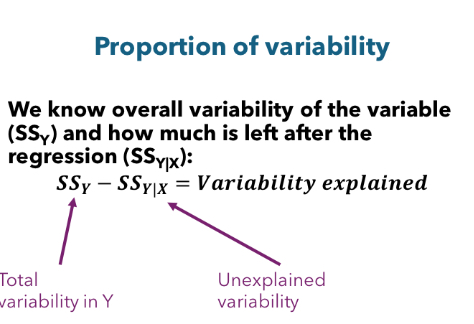
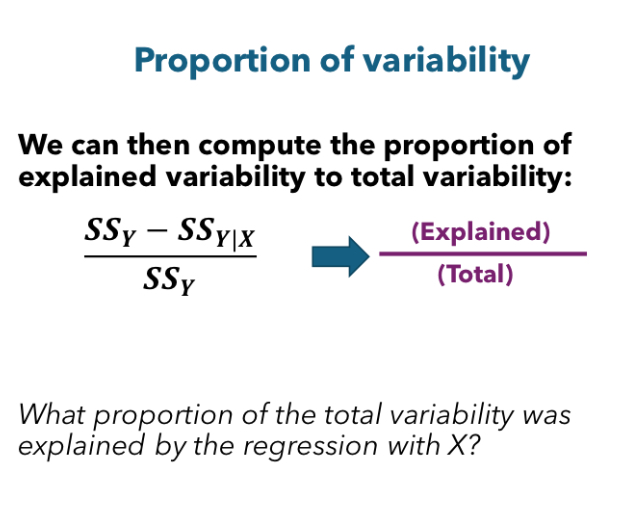
This proportion is known as r2
r2
The proportion of total variability in one variable that is predictable from another
r2= 0
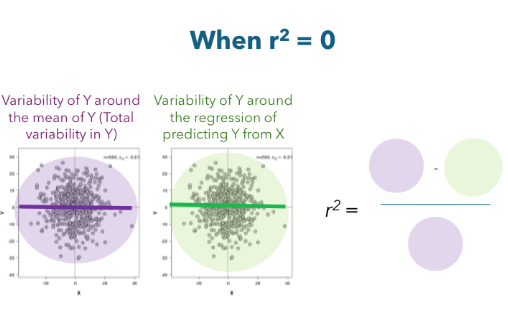
We would be just as accurate by predicting Y from the mean of Y than by using X to predict Y
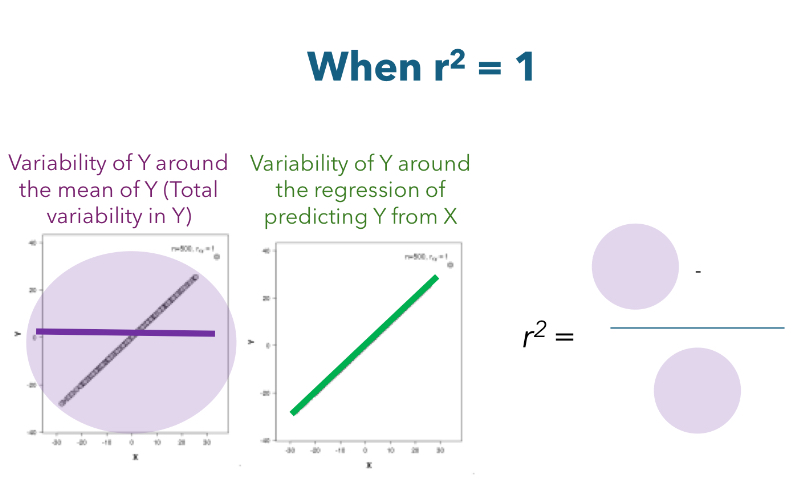
r2 = 1
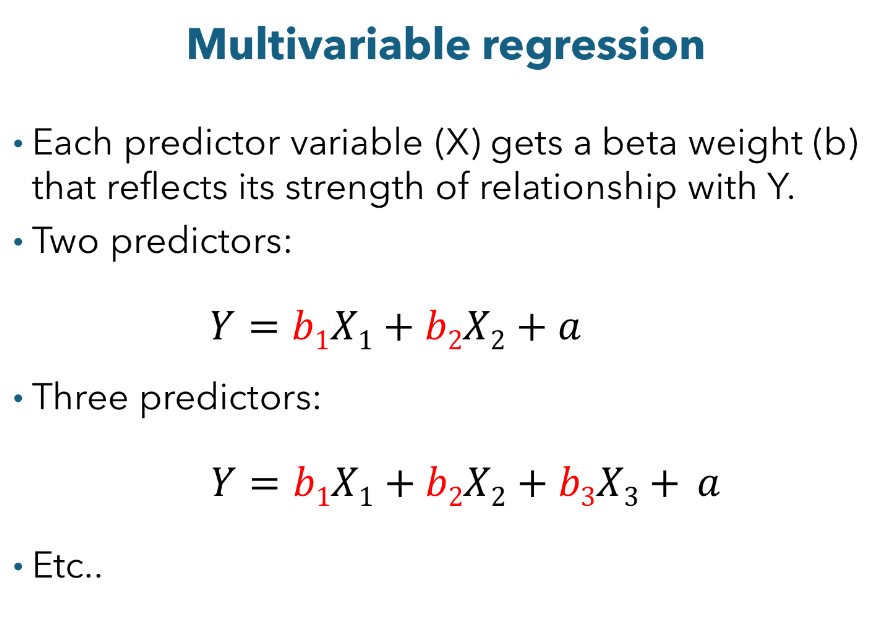
Multivariate regression
-Two or more predictor variables
-One dependent variable
Ex. Want to predict income:
-Might want to study years in the workforce
-Education
Standardized beta
Change in the dependent variable, in standard deviations, per standard deviation change in the predictor
Ex.
Unstandardized beta (B = 0.0351) | Change in likes for one follower |
Standardized beta (β = 0.410) | Change in likes for one SD of followers |
Limits to regression approach
-Do not establish temporal precedence
-Can only control for what they measure
Can’t be sure all third variables are accounted for
Third variable
A variable that represents a plausible alternative explanation for an existing correlation between two variables
-May imply the existing correlation is meaningless because the two variables are not directly related
Ex. Grip strength and memory. Third variable: age
Mediator
A variable that helps explain the meaningful association between two variables that have an existing correlation, because the variable arises from or is internal to the independent variable
Ex. Minutes of recess and behavior problems in the classroom
Third variable: inhibition skills
Moderator
When the relationship between two variables changes in strength depending on the level of a third variable
Moderator modifies the strength or direction of the association
Ex. Recess and behavior problems
Moderator: Physical activity
Four validities
construct - how well the variables in a study measure what they are intended to measure. Exhaustive and selective
external - The degree to which the results of a study are generalizable to a larger population
internal - The degree to which the effect arises because of the experimental variable and not some alternative variable
statistical - The degree to which the results support the claim