Handout 6 - Oxygen Binding Curves
1/23
There's no tags or description
Looks like no tags are added yet.
Name | Mastery | Learn | Test | Matching | Spaced |
|---|
No study sessions yet.
24 Terms
What is this graphical representation showing?
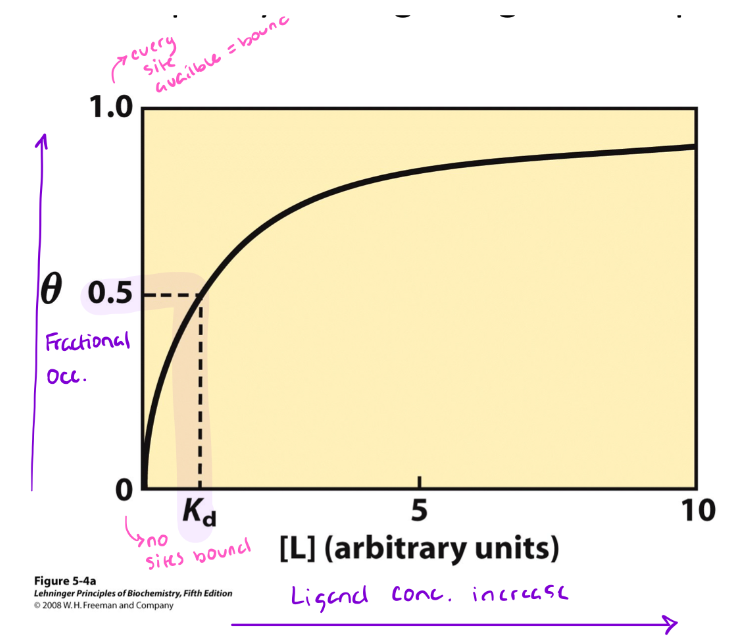
Ligand (L) Binding
Generalized for binding that is saturable
Shows hyperbolic plot; not all binding curves look like this, but most do!)
What is the y-axis representing on the ligand (L) binding graph?
Theta (θ), or fractional occupancy of ligand binding sites (minimum of 0, maximum of 1)
What is fractional occupancy?
The mole fraction of available binding sites that have a ligand bound.
What are the parameters for mole fractions?
The value varies from 0 (no ligand bound) to 1 (all available sites have ligand bound)
When the mole fraction is 0.5, then 50% of available sites have ligand bound.
What is the value, the ligand concentration required to get to ½ maximal occupancy, called?
Kd, its a reflection of the binding affinity
The smaller the Kd value…
The tighter the binding affinity
How can we quantify the binding of O2 in myoglobin?
We can quantify the binding of O2 to the heme on the protein as a function of the partial pressure O2.
Units (kPa, tor, atm)
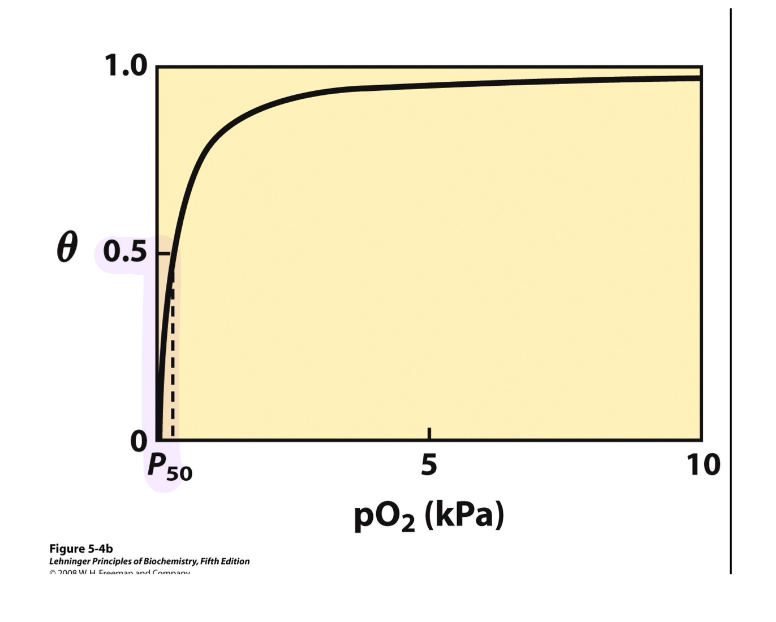
For myoglobin, what is being plotted on the graph?
Theta (θ) or fractional occupancy of O2 binding sites (sometimes designated as YO2) is plotted vs pO2 (partial pressure of oxygen)
What is the general shape for the Mb graph?
It is a rectangular hyperbola; we see saturation binding at low pO2.
What is P50?
The index of binding affinity (it is the Kd)
The pO2 required to get 50% of the available sites bound to oxygen.
The lower the P50 …
the tighter the binding affinity
What is the P50 needed for O2 to tightly bind to Mb (in torr)?
3 torr
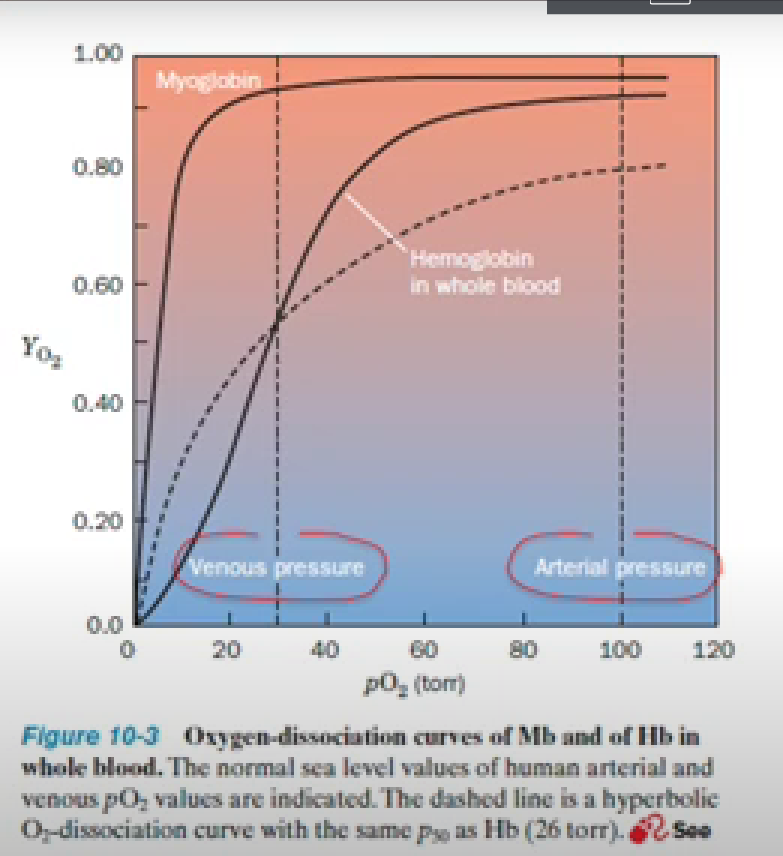
In this graph, what is venous pressure?
The dotted line on the left
Shows the pO2 (about 30 torr) typically found in venous circulation.
Low end of the scale, in the tissues, far from the point in which oxygen enters the body.

In this graph, what are the three takeaways for O2 binding to myoglobin?
Hyperbolic curve for oxygen binding to myoglobin
O2 binding to Mb is saturated at very low po2
The smaller the P50, the greater the fractional occupancy at a given pO2