[AMFINANCE] L2 | CAPITAL MARKET HISTORY
 Call Kai
 Learn
Learn Practice Test
 Spaced Repetition
 Match
Match Flashcards
 Knowt Play
1/26

There's no tags or description
Looks like no tags are added yet.
Name | Mastery | Learn | Test | Matching | Spaced | Call with Kai | Chat |
|---|
No analytics yet
Send a link to your students to track their progress
27 Terms
Risk-Return Tradeoff
Is an investment principle that indicates that the higher the risk, the higher the potential reward.
To calculate an appropriate ______, investors must consider many factors, including overall risk tolerance, the potential to replace lost funds and more.
Investors consider this on individual investments and across portfolios when making investment decisions.
Risk
is measured by the dispersion, spread, or volatility of returns
Risk-free rate
is the theoretical rate of return on an investment with zero risk of financial loss. In practice, investors use the yields on short-term, highly rated government securities (such as the three-month U.S. Treasury bill) as a baseline. It serves as the foundational benchmark to price bonds, options, and evaluate the expected returns of riskier assets.
Rate of return on a riskless investment
Treasury Bills are considered risk-free
Risk premium
is the extra return an investor expects to receive from holding a risky asset compared to a risk-free asset (like a U.S. Treasury bond). It acts as financial compensation for bearing additional uncertainty, volatility, and potential loss of capital.
Excess return on a risky asset over the risk-free rate
Reward for bearing risk
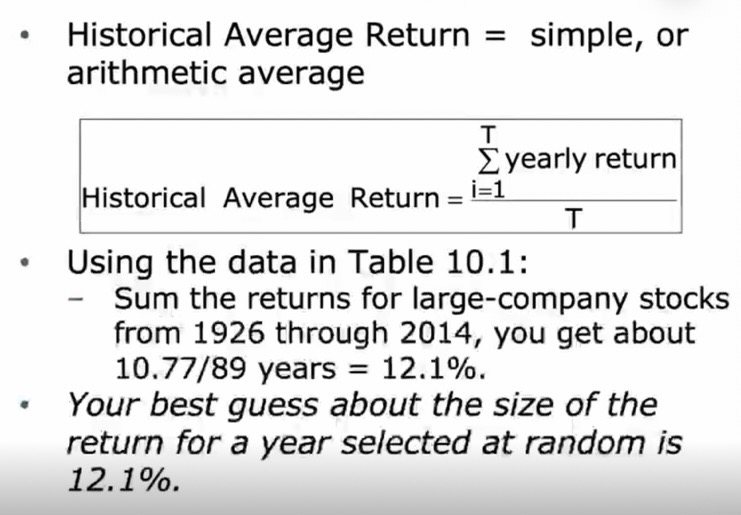
Historical Average Returns
shows how much an investment grew over time
Total dollar return
on a nondollar investment, which includes the sum of any dividend/interest income, capital gains or losses, and currency gains or losses on the investment. the return on an investment measured in dollars.
$ Return = Dividends + Capital Gains
Capital Gains = Price received - Price
paid
Total percent return
the return on an investment measured as a percentage of the original investment.
% Return = $ Return/$ Invested
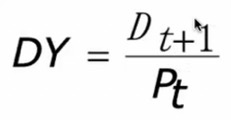
Dividend yield
expressed as a percentage, is a financial ratio (dividend/price) that shows how much a company pays out in dividends each year relative to its stock price. The reciprocal of this is the price/dividend ratio.
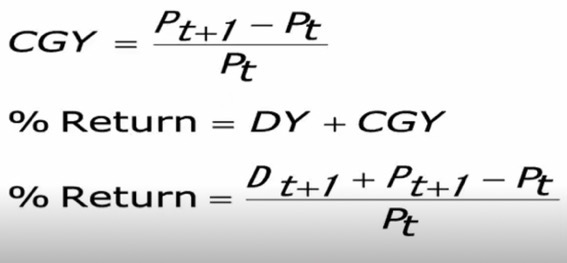
Capital gains yield
is the percentage price appreciation on an investment. It is calculated as the increase in the price of an investment, divided by its original acquisition cost.
Stocks
Bonds
Treasury Bills
Financial Investments (3)
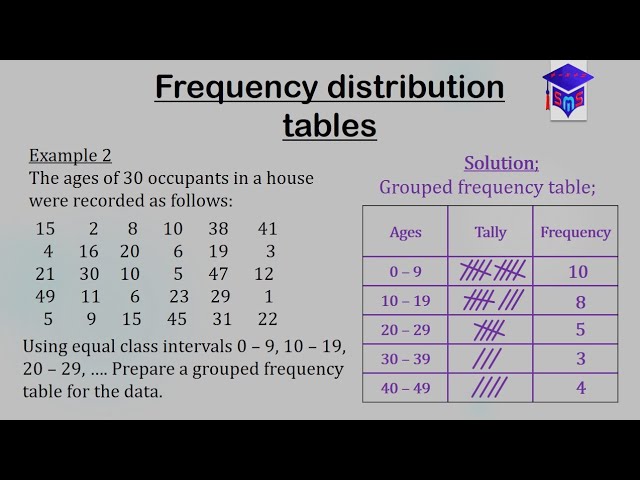
Frequency distribution
[Variability of Returns] Number of instances in which a variable takes each of its possible values.
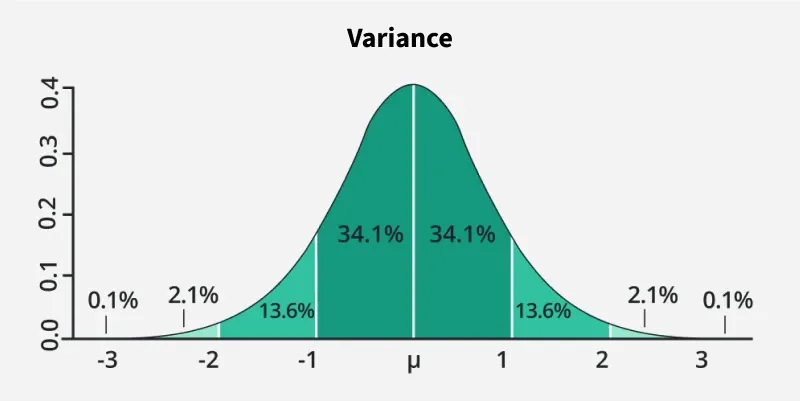
Variance
[Variability of Returns] Average squared difference between the actual return and the average return. The bigger the ______, the more actual returns differ from average returns.
VAR(R) or o2
Common measure of return dispersion
Also call variability
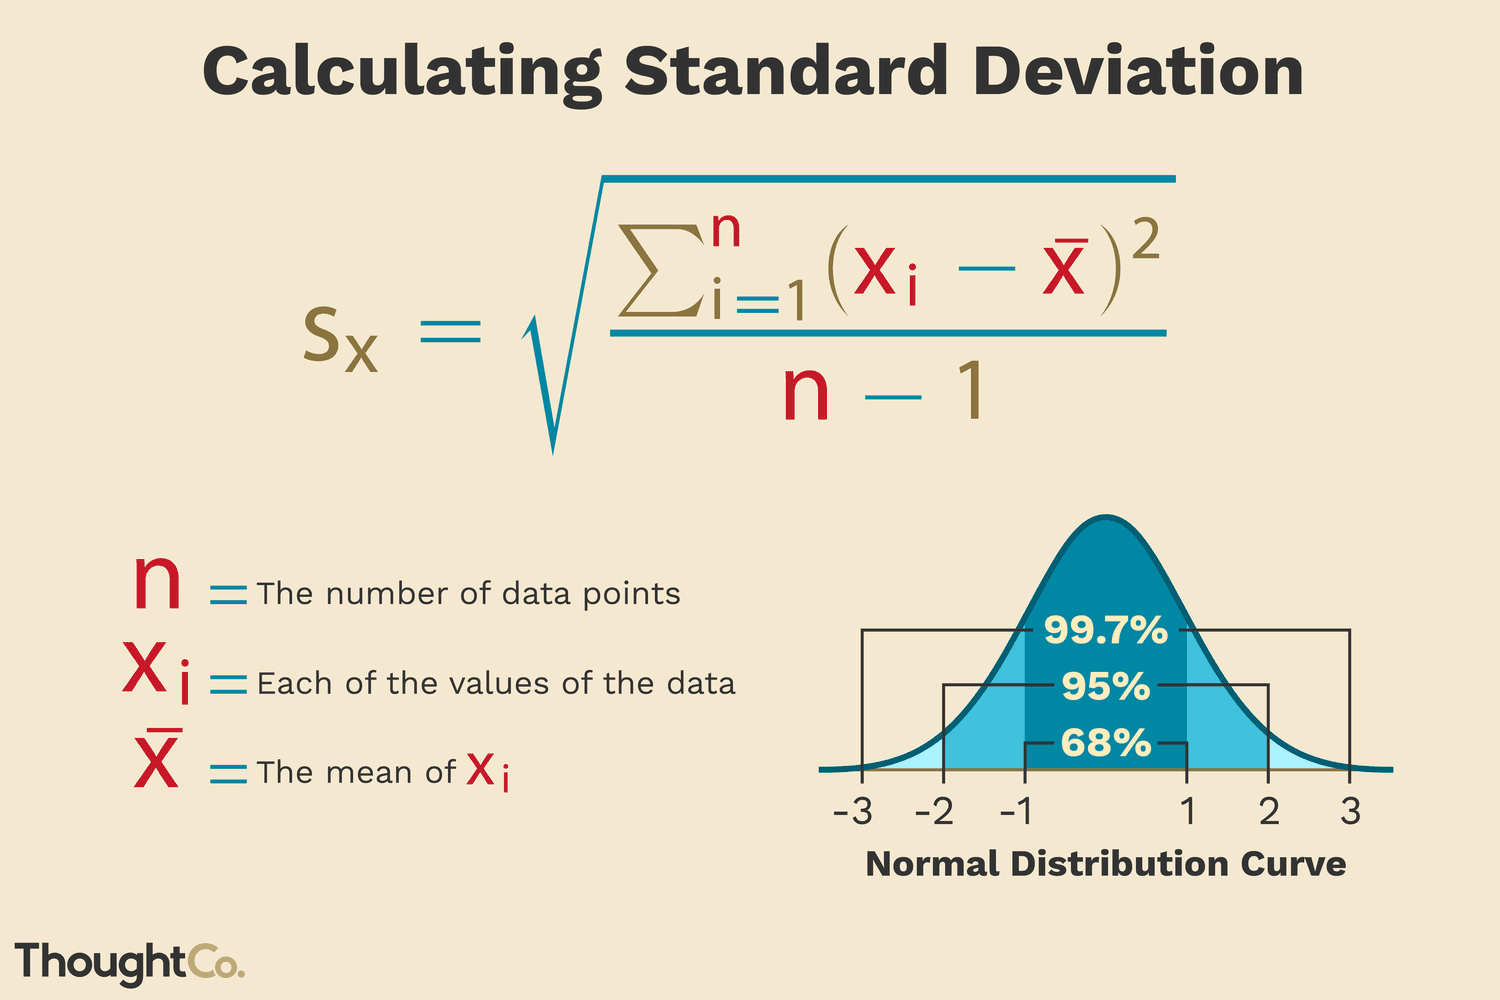
Standard deviation
[Variability of Returns] The positive square root of the variance. A way to understand more the variance.
SD(R) or o
Square root of the variance
Sometimes called volatility
Same "units" as the average
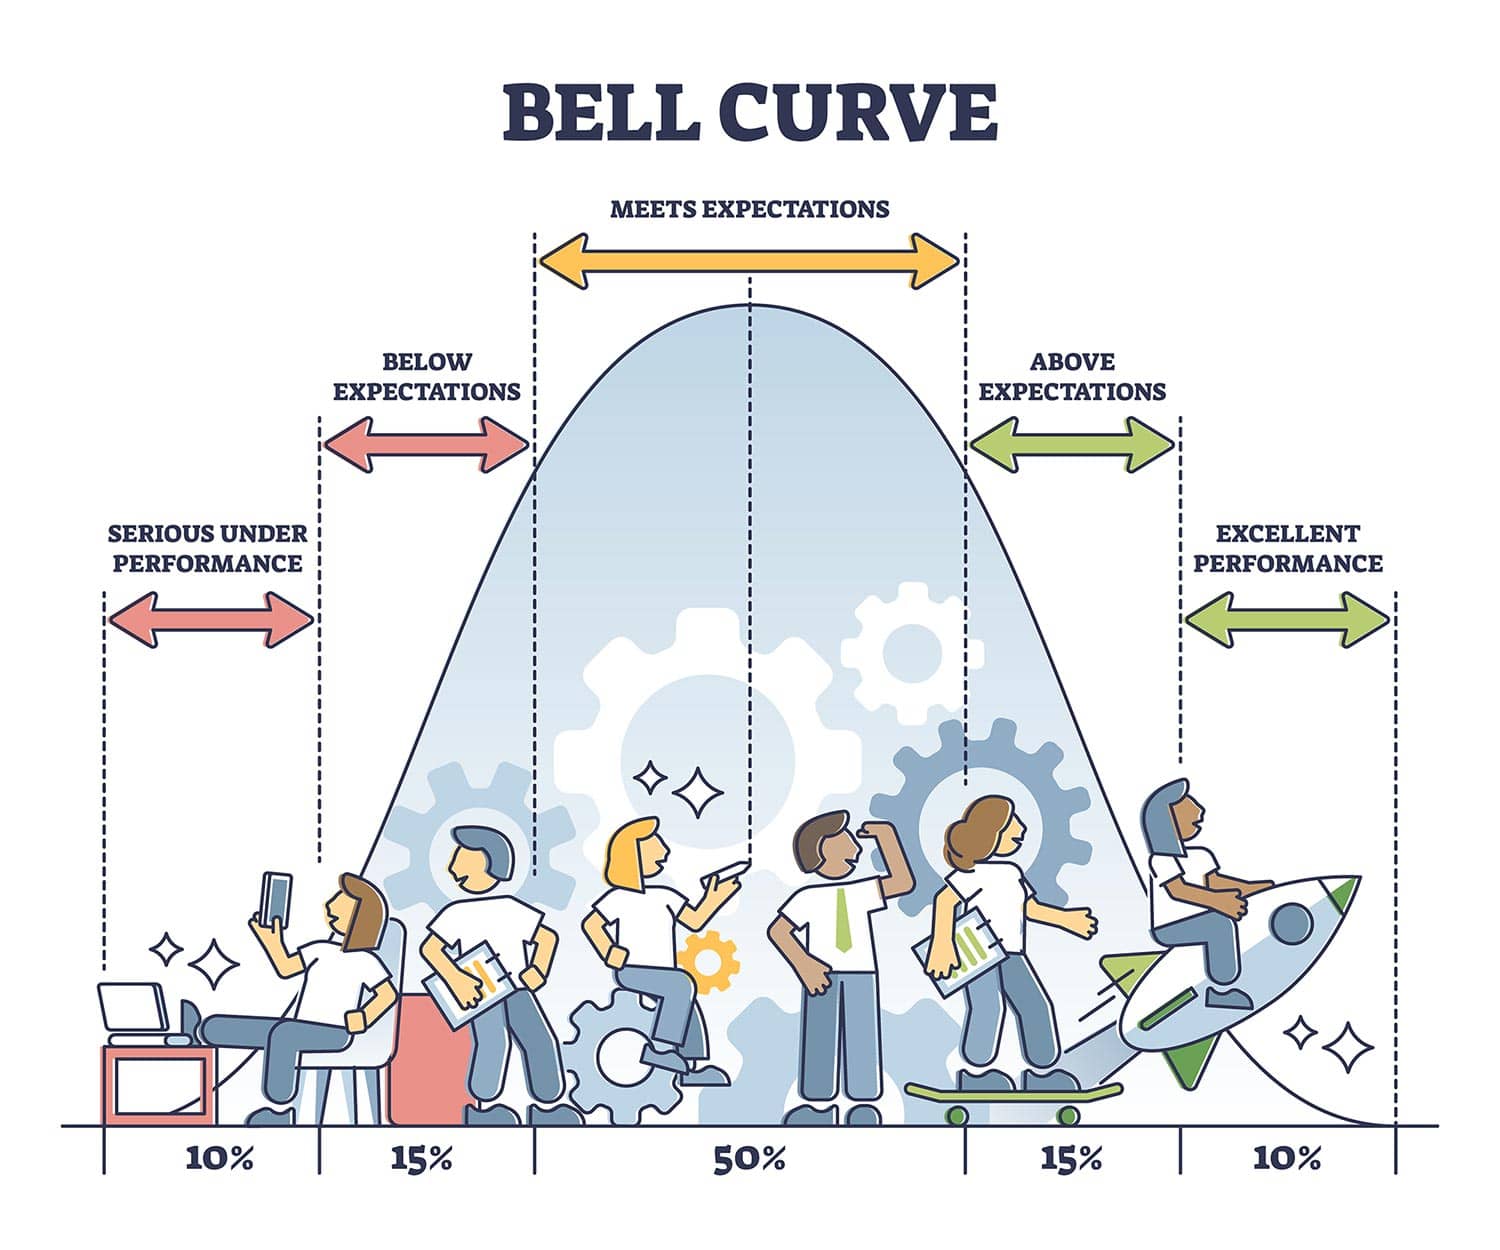
Normal distribution (bell curve)
[Variability of Returns] Symmetric, bell-shaped frequency distribution that is completely defined by its average and standard deviation.
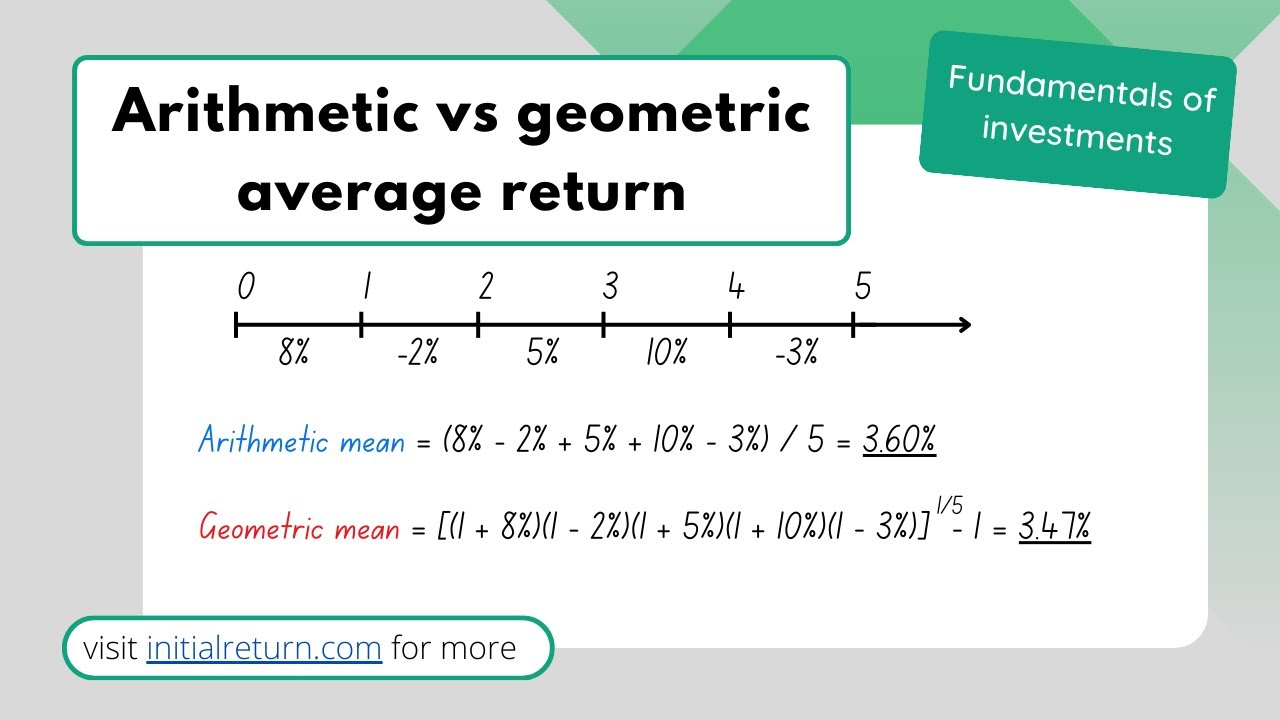
Geometric Average Return
[Average Returns] Average compound return earned per year over a multiyear period. It is a more useful for long-term periods. What was your average compound return per year over a particular period?
____________ < arithmetic average unless all the returns are equal
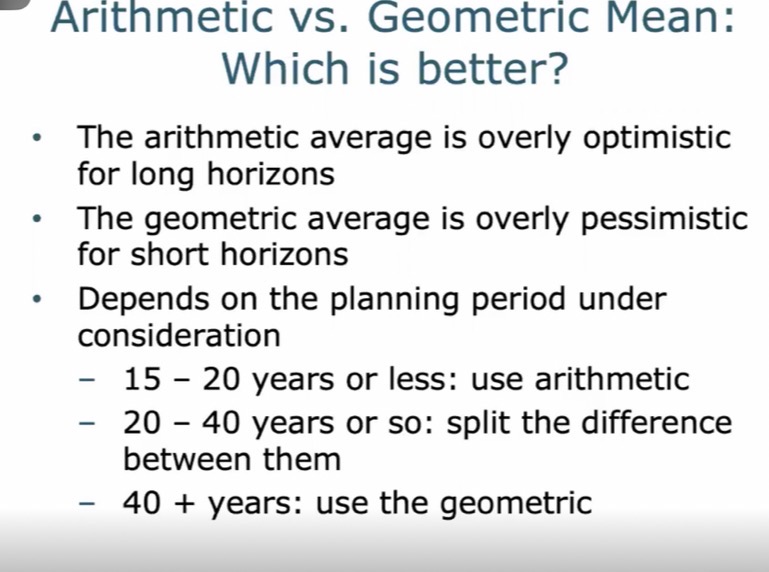
Arithmetic vs. Geometric Mean: Which is better?
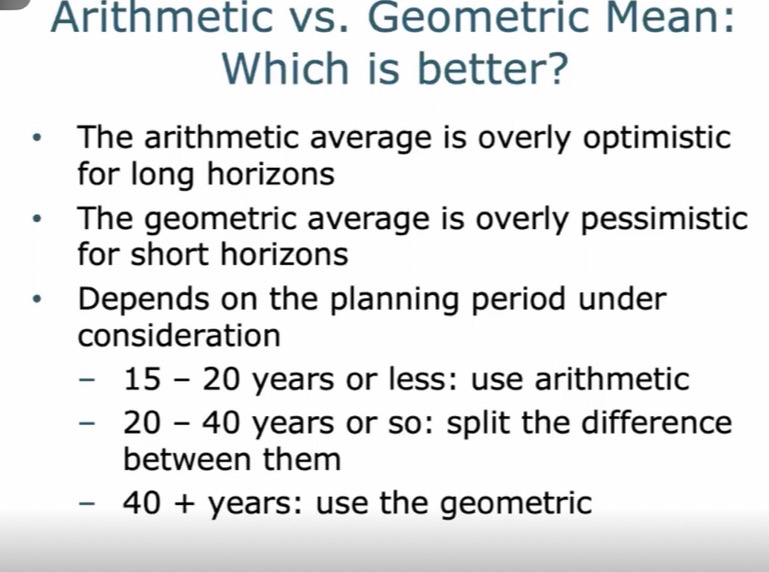
Arithmetic Average Return
[Average Returns] Return earned in an average year over a particular period. It is a more useful for short-term periods. What was your return in an average year over a particular period?
Efficient Capital Market
[Capital Market Efficiency] Market in which security prices reflect available information.
Stock prices are in equilibrium
Stocks are "fairly" priced
Informational efficiency
If true, you should not be able to earn "abnormal" or "excess" returns
Efficient markets DO NOT imply that investors cannot earn a positive return in the stock market
Efficient Market Hypothesis
[Capital Market Efficiency] Hypothesis that actual capital markets are efficient.
Overreaction and correction
[Types of Market Efficiency] price over-adjusts to the new information; it overshoots the new price and subsequently correct.
Delayed reaction
[Types of Market Efficiency] price partially adjusts to the new information; eight days elapse before the price completely reflects the new information.
Efficient market reaction
[Types of Market Efficiency] price instantaneously adjusts to and fully reflects new information; there is no tendency for subsequent increases and decreases.
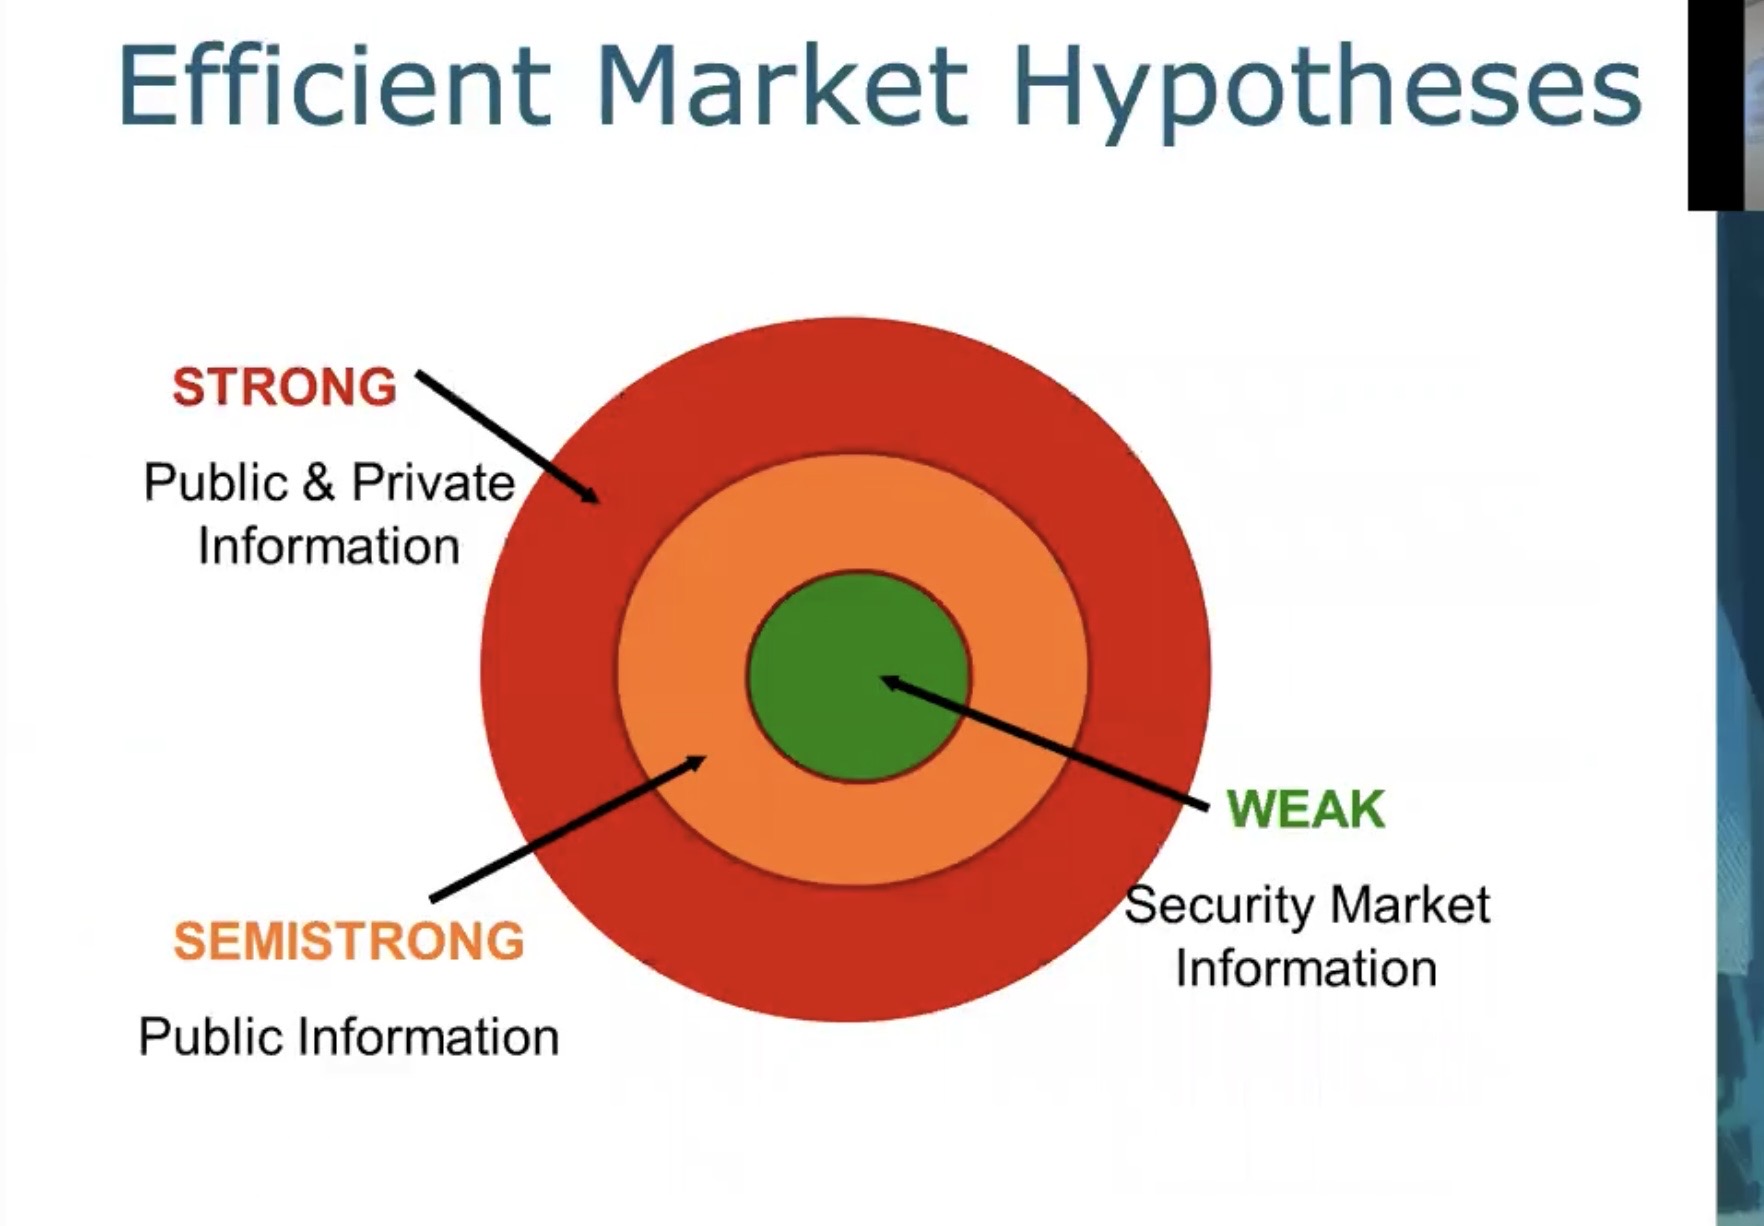
Strong Form Efficiency
[Forms of Market Efficiency] All information of every kind is reflected in stock prices.
Prices reflect all information, including public and private
If true, then investors can not earn abnormal returns regardless of the information they possess
Empirical evidence indicates that markets are NOT strong form efficient
Insiders can earn abnormal returns (may be illegal)
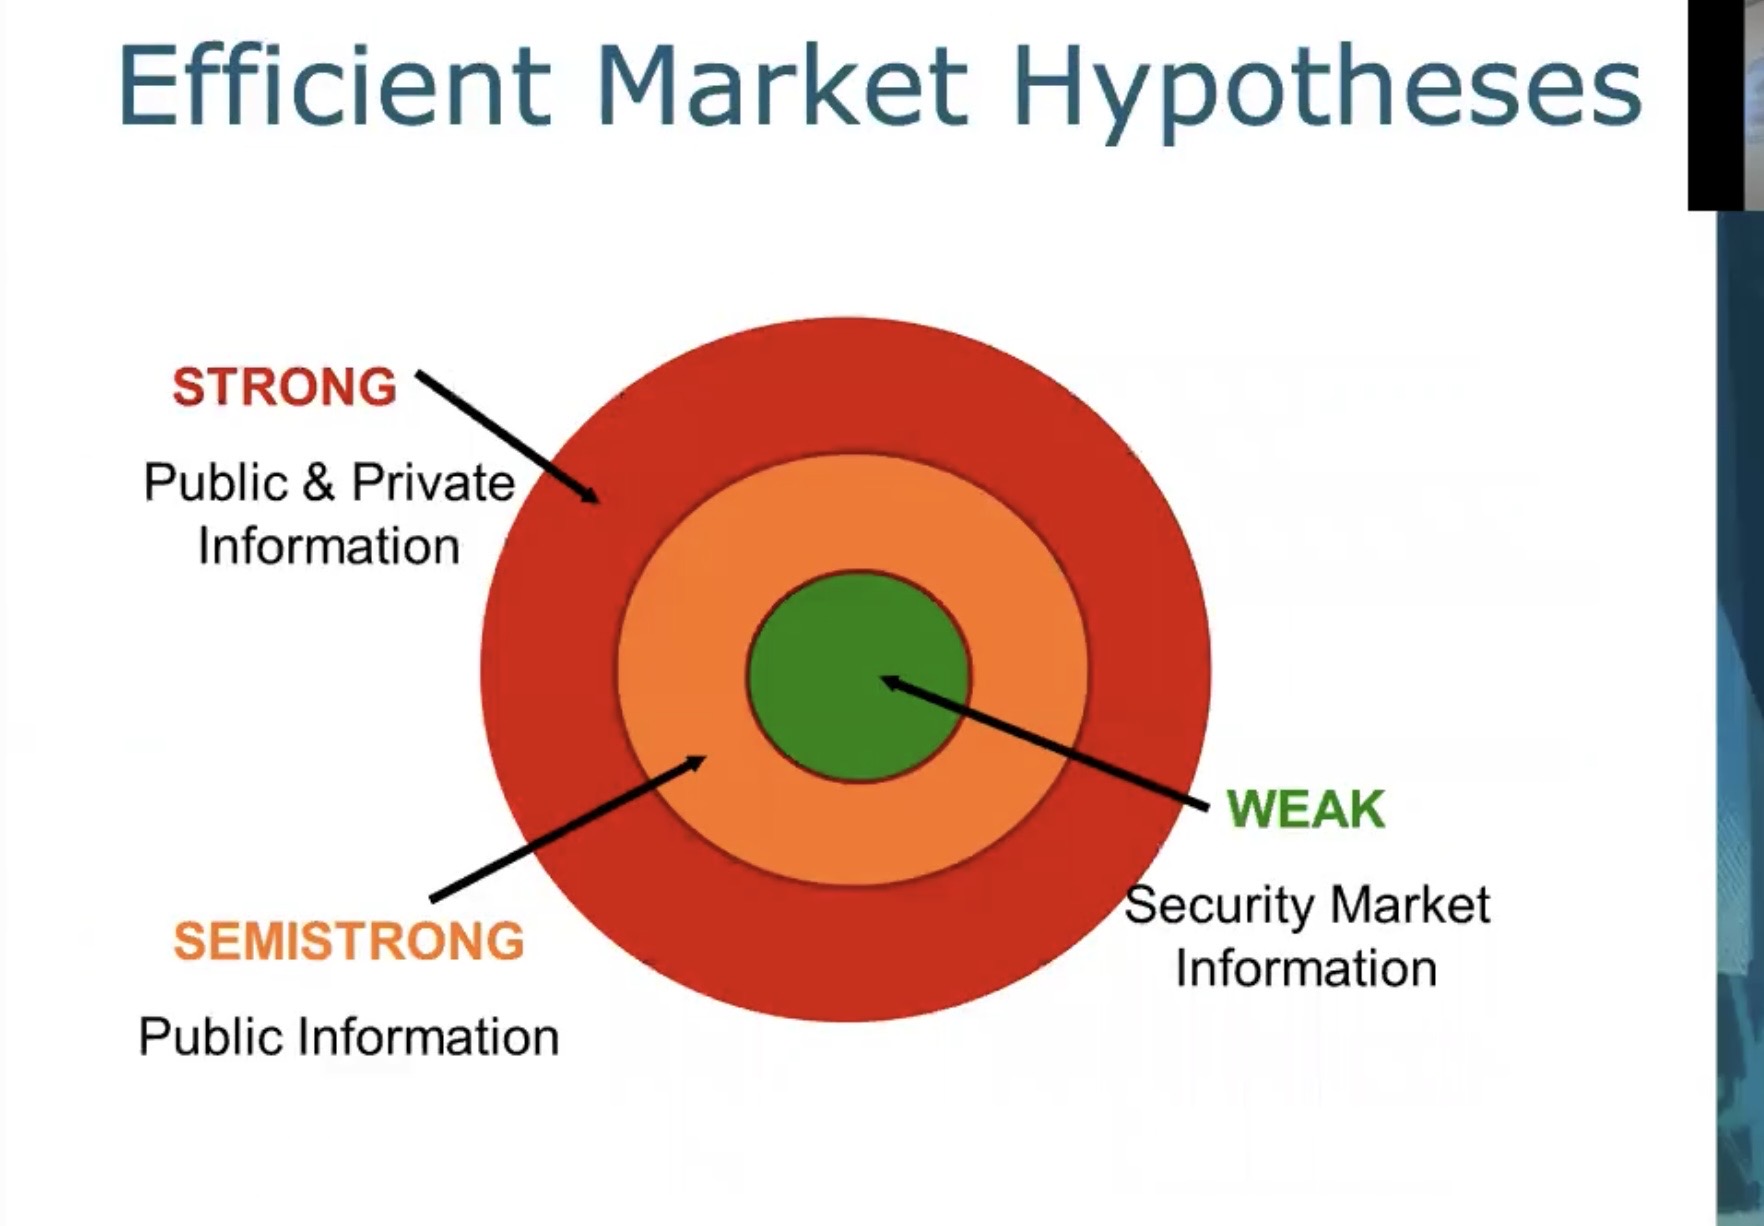
Semi-strong Form Efficiency
[Forms of Market Efficiency] All public information is reflected in the stock price.
Prices reflect all publicly available information including trading information, annual reports, press releases, etc.
If true, then investors cannot earn abnormal returns by trading on public information
Implies that fundamental analysis will not lead to abnormal returns
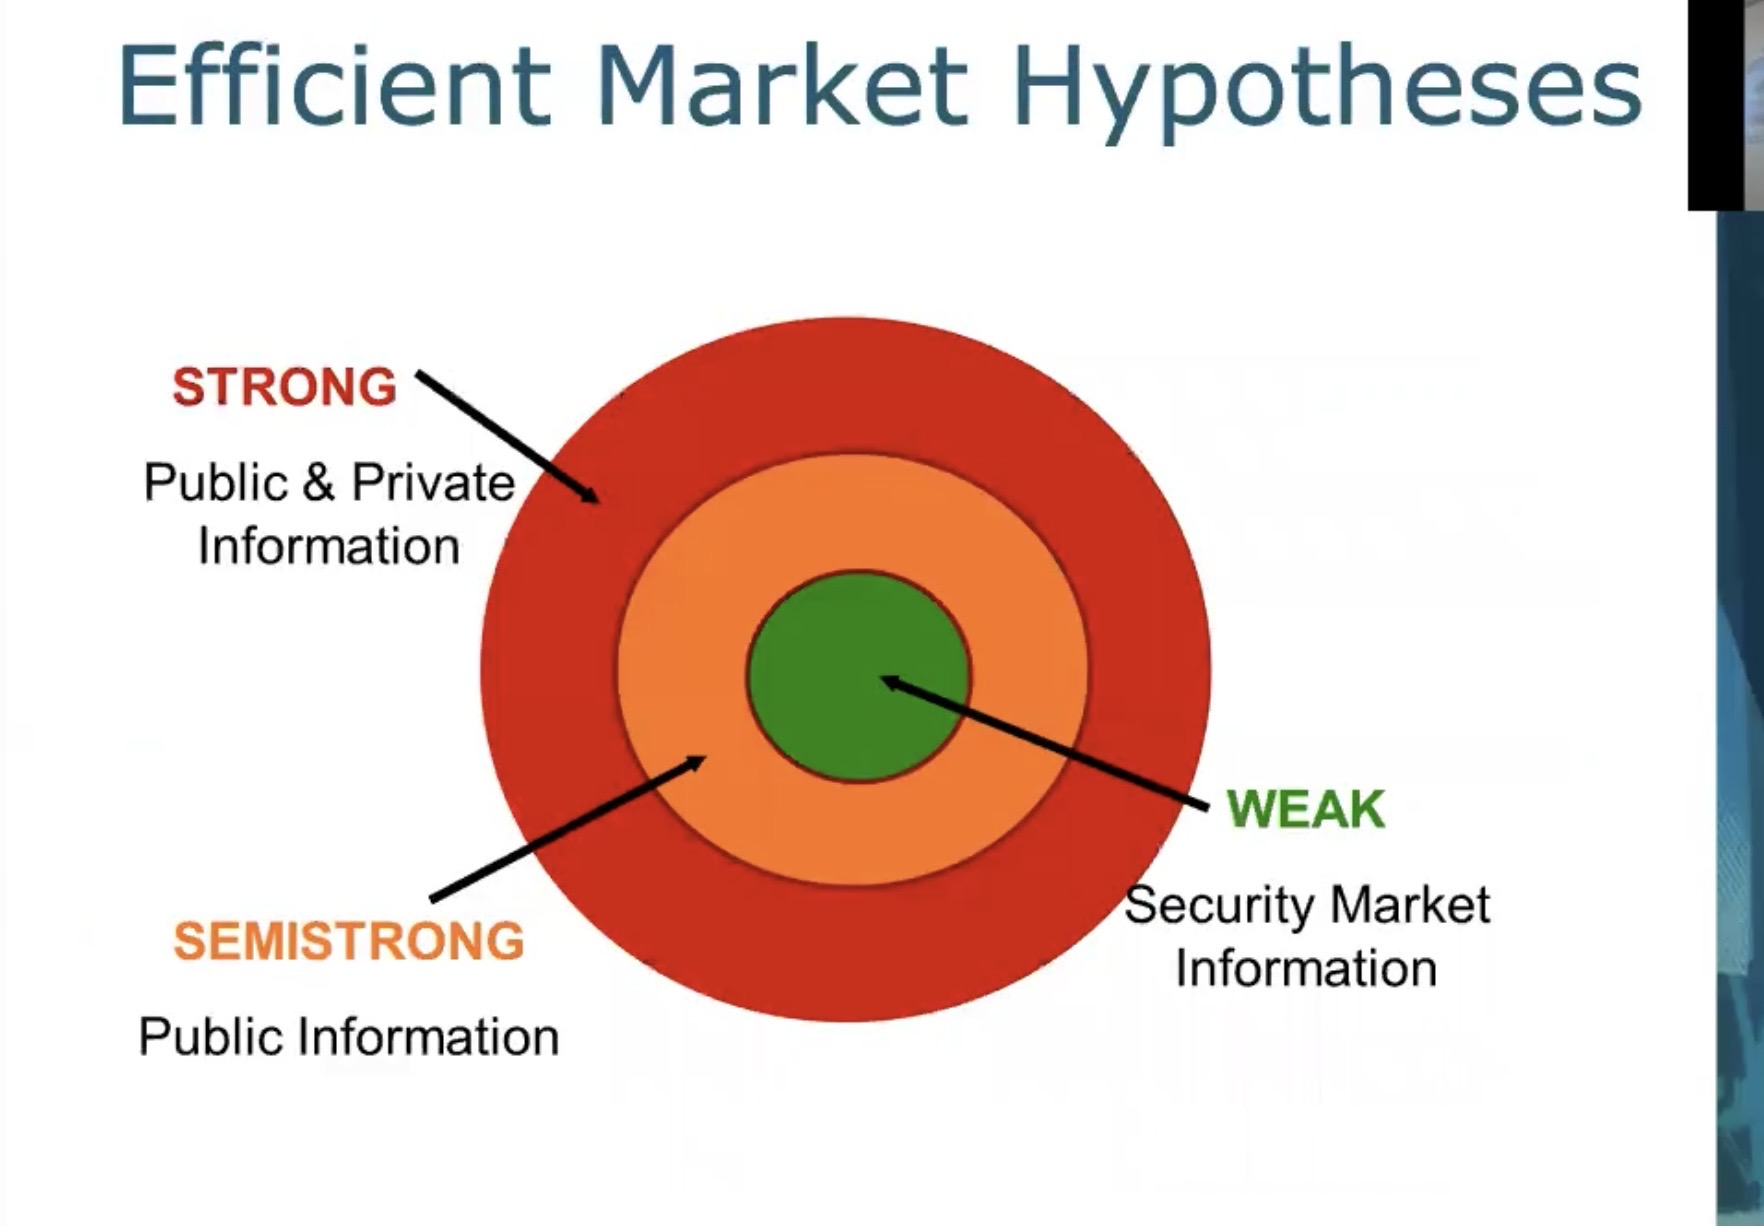
Weak Form Efficiency
[Forms of Market Efficiency] The current price of a stock reflects its own past prices.
Prices reflect all past market information such as price and volume
If true, then investors cannot earn abnormal returns by trading on market information
Implies that technical analysis will not lead to abnormal returns
Empirical evidence indicates that markets are generally weak form efficient
Efficient Market Hypothesis Misconceptions
EMH does not mean that you can’t make money
On average, you will earn a return appropriate for the risk undertaken
There is no bias in prices that can be exploited to earn excess returns
Market efficiency will not protect you from wrong choices if you do not diversify.
Capital Market History
Prices do appear to respond very rapidly to new information, and the response is at least not grossly different from what we would expect in an efficient market
The future of market prices, particularly in the short run, is very difficult to predict based on publicly available information.
If mispriced stocks do exist, then there is no obvious means of identifying them