2. How the Macroeconomy works (AS)
1/151
There's no tags or description
Looks like no tags are added yet.
Name | Mastery | Learn | Test | Matching | Spaced | Call with Kai |
|---|
No analytics yet
Send a link to your students to track their progress
152 Terms
The circular flow of income
How money, goods and services circulate within an economy between households, firms and the government
Economic agents
Groups that play a role in the economy by producing, buying or selling
Examples of economic agents
Firms, governments, households/consumers, workers
Circular flow of income model + assumptions
Model 1 (Closed Economy) assumptions:
No foreign trade
No government
All income and revenue spent
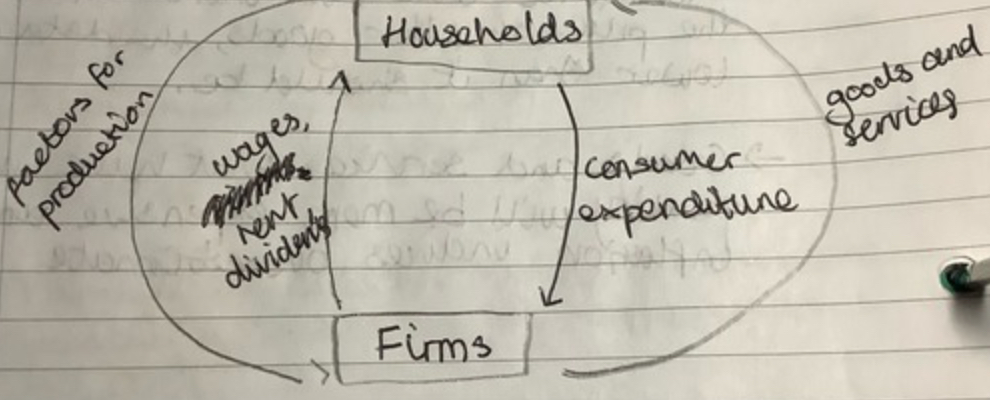
Factors of production (resources)
Land, Labour, Capital, Enterprise
Factors of production rewards
Land --> Rent.
Labour --> Wages.
Capital --> Interest.
Enterprise --> Profit.
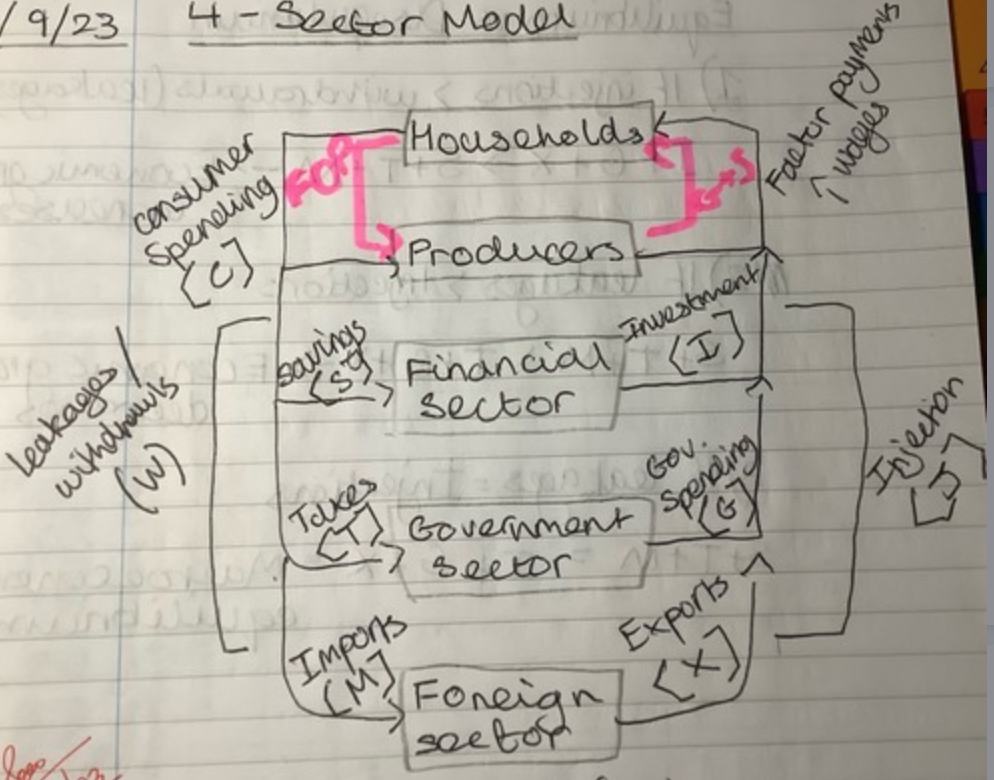
4 sector model
Households, firms, financial sector, government sector
Equilibrium: S + T = I + G
Aggregate Demand
the total demand for final goods and services in an economy at a given time
Aggregate Supply
the total amount of goods and services in the economy available at all possible price levels
AD is the same as
National income which also = Real GDP
AD=
C+I+G+(X-M)
C+I+G+(X-M)
consumption + investment + government spending + (exports - imports)
(X - M) or (Exports - Imports)
Net exports
If injections > leakages
I + G + X > S + T + M —> Economic growth increases
If Leakages > Injections
S + T + M > I + G + X —> Economic growth decreases
If leakages = injections
S + T + M = I + G + X —> Macroeconomic equilibrium
S, T, M
Savings, Taxes, Imports (Leakages)
I, G, X
Investment, Government spending, Exports (Injections)
Living standards/ Standard of living
The amount of goods and services available to produce in a country which measures material wealth
Two most common ways to measure standard of living
1) Real GDP per capita
2) Gross National Income (GNI)
Limitations of GDP per capita as a measure of standard of living (Give 3)
-Doesn't count unpaid work such as family care, housework and volunteering
-Doesn't effectively measure pollution, safety and health
-Assumes production rewards are divided equally among everyone
-Ignores distribution of income
-Ignores changes in working hours + leisure hours + working conditions
-Rising GDP may be unsustainable, negative externalities (pollution)
-Ignores improvements in life expectancy
-Defensive expenditures do not improve SofL
-Ignores innovation and improvements in product quality
-Ignores non-monetary factors: freedom of speech, corruption, gender equality, crime rate, homelessness, shadow economy
-Regional inequalities
-Doesn't measure deprecation of capital
-Doesn't measure debt value
-Doesn't measure free services on the web
Shadow economy
illicit economic activity existing alongside a country's official economy, e.g. black market transactions and undeclared work.
3 other ways to measure Standard of Living/Quality of Life
-Human development index (HDI)
-Purchasing Power Parity (PPP)
- Gallup's standard of living (U.S.)
- Gross National Income (GNI)
Gross National Income (GNI)
The value of the output of goods and services produced in a country in a year, including money that leaves and enters the country
Which country has the highest standard of living, using different measures.
- GDP per capita=Luxembourg
- World Bank=Macao (China)
- U.N. Development Index=Norway
Why is GDP a useful measure of Standard of Living (Give 3)
-Quantitative
-Internationally agreed standards
-National income data helps to make cross-country comparisons
- GDP can be used to satisfy wants and needs because increase in GDP=increase in disposable income
-Indicates when a country is materially better or worse off in terms of jobs and incomes
-Good measure of production
-Increase in GDP= better education, healthcare and environmental protection
Income as a measure of standard of living
-GNI per head at PPP
-GNI is a better measure as it reflects spending power
Health as a measure of standard of living
-Life expectancy at birth
-Proxy measure, e.g. number of doctors, sanitation, etc.
Education as a measure of standard of living
-Expected mean years of schooling for children and actual mean years of schooling for adults.
-Previously "adult literacy rate"
National income
Measures the monetary value of the flow of output of goods and services produced in an economy over a period of time.
Most commonly used measure of national income is
GDP
Gross National Income (GNI) measures
The final values of incomes flowing to UK owned factors of production, whether they are in the UK or overseas
GNI=
GDP + Net property income from overseas
Primary income can come from overseas investments such as
Interest, profits and dividends
The income method as a measure of national income
Adding up all the money earned by people and firms in producing this year's output, wages and salaries+ rent+ profits+ interest
The output method as a measure of national income
Combined value of the new and final output produced in all economy sectors: manufacturing, financial services, transport, leisure and agriculture
The expenditure method as a measure of national income
A method used to measure the value of aggregate output of an economy, which adds up all spending on final goods and services produced within a country within a given time period. C+I+G+(X-M)
Purchasing Power Parity (PPP)
How many units of one country's currency are needed to buy the same basket of goods and services as can be bought with a given amount of another currency.
Example of PPP
If Coca Cola price in UK was £1, and $1.50 in U.S. then exchange rate=1.50 (US price/UK price)
Aim of PPP
To make comparisons between two currencies
PPP is used by
World bank, United Nations, European Union
The Big Mac index
Tool for calculating purchasing power parity that compares prices of a Big Mac throughout the world. Extent to which market exchange rate result in goods costing the same
When was the Big Mac index published
1986, the Economist
AD Curve
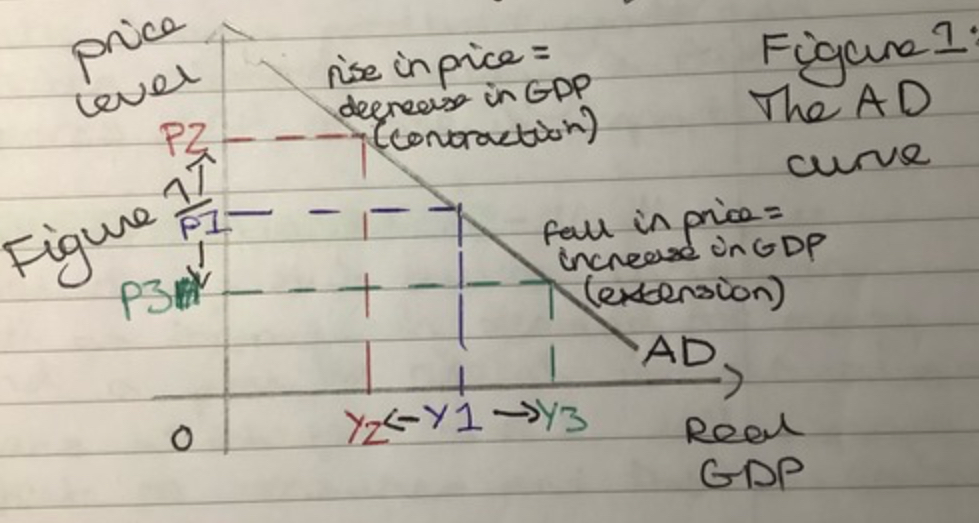
The AD curve shows
the quantity of all goods and services demanded in the economy at any given price level
AD-AS model shows the relationship between
Price level and real GDP
Why does the AD curve slope downward?
wealth effect, interest rate effect, exchange rate/trade effect
AS Curve is
Upward sloping
Wealth effect
As price level rises, the real value of income falls and consumers are less able to buy what they want or need.
Exchange rate effect/trade effect
A rise in the price level of country x could make foreign produced goods and services cheaper, causing a fall in exports and a rise in imports
interest rate effect
if the price level rises, causes inflation and an increase in demand for money and a possible rise in the interest rates or loans which then has a deflationary effect on aggregate demand
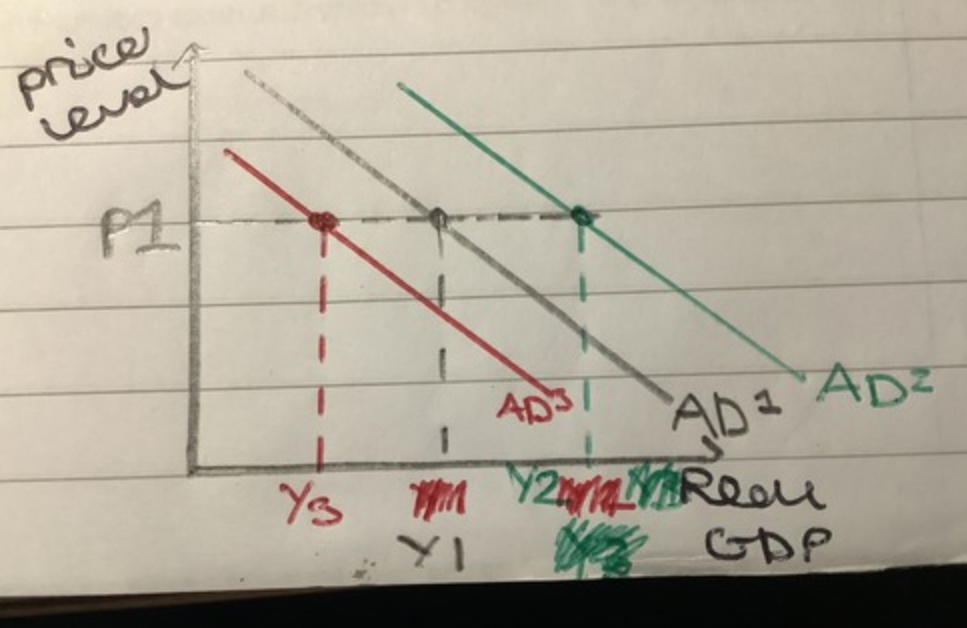
Shift in AD
Increase moves from AD1 to AD2, outward shift to the right
Decrease moves from AD1 to AD3, inward shift to the left
AD curve is
Downward sloping
Determinants of consumption (C) (Give 3)
Real disposable income - income tax
Employment and job security
Interest rates and availability of credit
Household wealth and indebtedness
Consumer confidence (linked to job prospects and level of unemployment
Asset prices (the wealthier people are, the more likely they are to spend money)
Increase in GDP - consumption chain of analysis
Increased consumption, higher disposable income, AD increases
Stock market crash - consumption chain of analysis
Less consumer spending, low confidence, decreases AD
Increase in all income tax rates - consumption chain of analysis
Lower consumer spending, lower disposable income, AD decreases
Increase in funds available for lending by banks - consumption chain of analysis
More willing to lend, Increase consumer spending, AD increases
Low consumer confidence - consumption chain of analysis
Less consumer spending, hold off purchases because concerned about future income losses, decreases AD
Decrease in interest rates - consumption chain of analysis
Increases consumer spending, lower cost of borrowing and reward for saving, AD increases
Increase in benefits payments - consumption chain of analysis
Increased consumer spending, higher disposable income for benefit recipients, AD increases
Deregulation of rules around credit card limits - consumption chain of analysis
Increased consumer spending, lend larger amounts, AD increases
Over 8 months of deflation - consumption chain of analysis
Fall in consumer spending, hold off on purchases due to expecting further deflation, AD decreases
Rise in house prices - consumption chain of analysis
Increased consumer spending, higher confidence due to higher wealth, Increases AD
Investment (I)
The addition of capital stock to the economy or expenditure by firms on capital.
Examples of investment
-GM spends $250 million to build a new factory in Michigan
-New factories and other buildings for machinery or research+development
What do firms do when they can't afford investment
Borrow
What is capital investment vital to
Long-run economic growth
investment in human capital
Investment in education and training of workers (apprenticeship)
gross investment
the total amount spent on purchases of new capital and on replacing depreciated capital
Depreciation of capital
the decrease in the value of a nation's capital stock over time
net investment=
gross investment - depreciation
Gross investment > deprecation
Net investment positive
Depreciation > Gross investment
Net investment negative
Factors affecting investment
- Interest Rates
- Real disposable incomes
- Capacity utilisation - full employment
- Profit levels
- Corporate tax rates
- Access to credit
- Price of capital equipment
- Expectations of future demand
Government spending (G)
Spending by the public sector (government) on goods and services such as education, healthcare and defence
Total UK gov spending in 2015
£745bn, 43% of GDP
Increased gov spending leads to
Increased AD, high short term growth, potential inflation
Current spending (public services)
Salaries paid to NHS workers, drugs used in healthcare, road maintenance budget, army logistics supplies
Capital spending (public infrastructure)
Construction of new motorways bridges and airports, new NHS equipment, flood defence schemes, extra defence equipment
Transfer payments (welfare made available through social security system
Job seekers allowance, child benefit, state pension, housing benefit, income support
Public Sector Net Cash Requirement (PSNCR)
The amount that the UK government needs to borrow every year to pay for public spending when its expenditure is more than income
Factors influencing levels of government spending
Politics, fiscal policy measures, cost of borrowing, level of economic activity, population/demographic changes, trade openness
Net exports positive
trade surplus
Net exports negative
trade deficit
The UK has had a trade XXX since XXX
Deficit, 2000
Exports are
goods produced domestically and sold overseas, represent an injection into circular flow of income, boost AD
Imports are
Purchasing foreign foods rather than domestic goods, purchased overseas, leakages from the circular flow of income
Factors influencing net exports
High levels of economic growth, increase in real disposable income, exchange rate, inflation rate, increase in productivity, degree of protectionism, international competitiveness
The multiplier effect
Injections of new demand for goods and services into the circular flow of income stimulate further rounds of spending.
Who founded the multiplier effect
John Maynard Keynes
Multiplier=
1/(1-MPC)
Marginal Propensity to Consume (MPC)
Measures the degree to which a consumer will spend or save in relation to a raise in pay
Change in national income=
Value of multiplier (k) x Change in injections
MPC=
change in consumption/change in income
If an individual gains an extra £10 and spends £7.50, then the MPC will be
7.5/10 = 0.75
Marginal Propensity to Save (MPS)
Change in savings following a change in income
MPS=
change in saving/change in income
MPC+MPS=
1
Average propensity to consume (APC)=
total consumption/disposable income