stats test: Exam 2: Scatterplots, Correlation, Regression, Experimental Design
1/56
Earn XP
Description and Tags
Mon Nov. 10
Name | Mastery | Learn | Test | Matching | Spaced | Call with Kai |
|---|
No study sessions yet.
57 Terms
scatterplot
relationship between two quantative variables, one on x and other on y axis
correlation coeff represents what?
r
what is r?
r is the strength of a linear relationship between two variables
ranges from -1 to 1
the abs value of the r is how strong it is
the negative/positive sign is which direction the linear relationship is going in
0 = weakest
1 = strongest
what reps coef of determination
r²
what is r²
(r² x 100) % of the variation in the response variable can be explained by its linear relationship with the explanatory variable
what is association
association is when a change in one variable changes the other variable
association can be positive negative linear nonlinear strong weak
association does not mean causation
does association prove causation and why?
NO because association does not prove direct change in another variable - for that you need a good randomized experiment with a control group - cannot be conducted from correlation alone
association can be…
pos, neg, nonlinear (montonic - ½ of a semi circle looking graph, quadratic - semi circle), linear, no correlation, weak, strong
does an experiment prove causation?
only a well-designed experiment can prove causation
correlation
measures the strength of the linear relationship
how close data points follow a linear pattern
does not imply one change in a variable directly causes a change in the other
what is a residual in words?
the difference between the predicted value by the LSRL and the actual data point on the scatterplot
real value (y) - predicted value (y with v on top)
if a residual is positive then?
lsrl underpredicted the value
if a residual is negative then?
lsrl overpredicted value
least squares regression line (LSRL) - whats formula?
y with a v on top = b0 + b1(x)
what is b1
slope
what is b0
when x = 0, which is the y intercept
what is the least squares regression line (LSRL)? how to find on graph (manually)?
so as we said its y with v on top = b0 + b1x
its the line “best fit” for predicting the response variable from the explanatory
so to reiterate we use the explanatory variable to predict the response variable
the LSRL tries to minimize the sum of the least squared residuals
how to find slope
r multiplied by the standard deviation of y values over the standard deviation of x values
sy = stan dev of y values
sx = stan dev of x values
r(sy)/sx
r (standard deviation of y values)
/ standard deviation of x values
as said previously what does the LSRL try to do?
the LSRL tries to minimize the sum of the least squared residuals
what is the sum of squared residuals
the vertical distance between observed y value and predicted y value
what key info does b0 tell us
what the response variable will be when our explanatory variable = 0
how to find b0
b0 = ybar - slopexbar
ybar = mean of all y values
slope = b1 = r x (sy/sx)
x bar = mean of all x values
mean of all y values - mean of all x values (r (SDy/SDx)
what are scatterplots vs residual plots?
scatter = LSRL + o.g. values
residual = x axis is the explanatory variable in o.g. values, and the y axis is the residuals (so that value the y value - y with a v on top value, which is the predicted value by the LSRL)
what is an influential point?
any point if removed would change EITHER the y intercept or the correlation
what happens if you remove/add an influential point?
affects r and/or affects y intercept
what is homeoscadastic
ms. weatherspoon def: when the varaibility (spread) of residulas is approx constant across all values of explanatory variable
simplified: so as you move along the x axis (as explanatory varaible increases) there isn’t a pattern for the residuals increasing or decreasing it remains random - like the residuals dont increase or decrease as the explanatory increases
what’s a good residual plot?
when the points are spreed = homeoscadastic
observational study def
record what happens naturally w/o intervention
experiment def
actively impose treatments on experimental units and observe the results
confounding variable def
a factor related to the explanatory varaiable that will influence the response variable
so like if you want to have a good experiment what do you have to make sure about your explanatory variable?
that confounding varaibles that are related to the explanatory varaibles which may influence the response variable are accounted for through some type of system (ex rbd, blocking, control)
experimental units def
people receiving treatment
treatment
what is done/not done to the exp. units
what are the steps for designing a good experiment?
comparison
RA (a) label, (b) randomize, © assign
replication
control
what is replication?
Replication means having many subjects in each treatment so your conclusion is more trustworthy.
me explaining: replication means like making sure you have a lot of test units for your experiment - bc the more people tested on the more legitimate your conclusion - so amount of test subjects/ exp. units
what is control?
control means controlling for other variables: so having a control group and/or blocking possible confounding variables
what is comparison?
being able to compare to sets of data (ie control group vs received treatment group)
RA meaning:
randomly assigning exp. units to treatment groups
placebo effect def
when a fake treatment “works” - conciousness infiltrated in
how do we prevent placebo
double/single blind study
single blind study def
exp. units dont know which treatment they are receiving
double blind study def
exp. units and researchers/ppl adminstering the treatments dont know which treatment they are receiving
what is RBD? (randomized block design)
grouping subjects into blocks based on a shared characteristic (which is a confounding variable) that may affect the response. RA exp. units treatments within each block
so if ms. weatherspoon asks how to draw diagram of completely randomized - what do you do?
name population - RA - exp. units r put into either control group or treatment group - compare the results
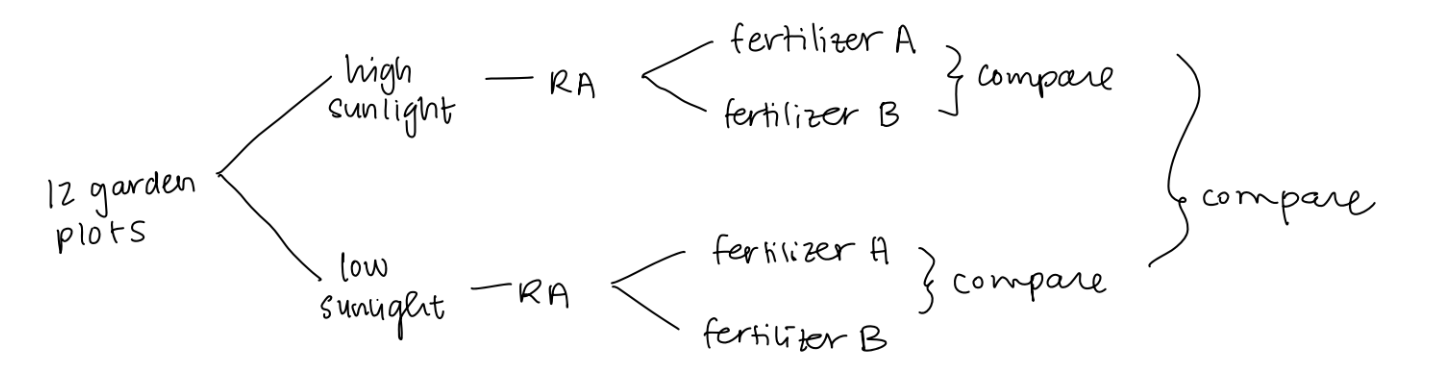
so if ms. weatherspoon asks how to draw diagram of RBD - what do you do?
name population (exp units) - split into confounding variables or their characteristic groups - RA in each block - the RA leads into control or treatment - compare the control and treament within each block - compare the two blocks data
ex is attached
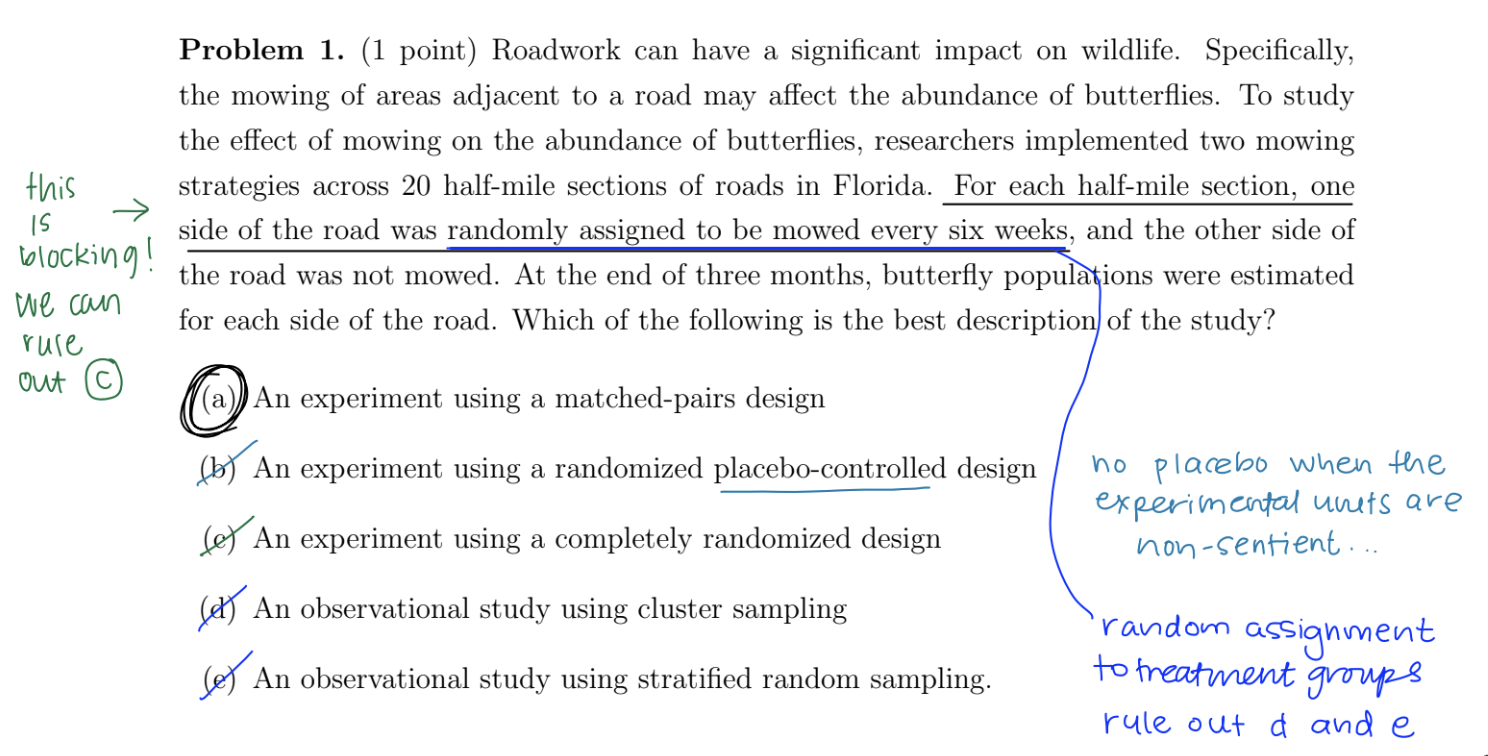
what is matched pairs?
RBD where each block has exactly 2 exp units, the exp units r similar in some way - they receive diff treatments
so like twins are each block, each twin gets a diff treatment, the twins share 100% same of the dna
crossover def
each subject receives multiple treatments in sequence, but randomly assigned order
crf - completely randomized factorial
testing all treatments simultaneously and getting all possible treatment combos
rbd is similar to what type of grouping / organization
strata

how do u do this
plug into calc - gives you the LSRL line
how do you find a residual from this line?
calc what the predicted thing is by plugging in x into the equation you found
getting the y value for the x value from the data set
y value - predicted value
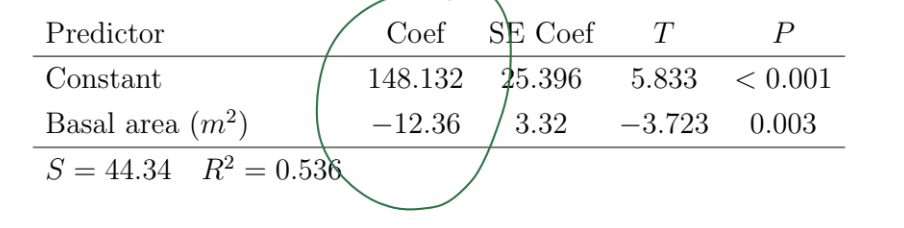
in this photo - if i told you to make a equation - how would you do it?
so - only look at the first 2 values for constant and basal area
top one is the y value
bottom one is the slope
so it would be
y with a v on top = -12.36x + 148.32
REMEMBER top = y
bottom = slope
ONLY FIRST 2
reminder
blocking in situations with two exp units for each block does classify as matched pairs
reminder
it can only be an experiment if you’re ACTIVELY imposing treatments on the exp units
You use a residual plot to
check how good the regression model is
statistically significant
results we obtain are unlikely to occur purely by chance (<5% chance)
if statistically significant then we have…
convincing evidence that the treatment CAUSED the difference