Decision Trees
1/6
There's no tags or description
Looks like no tags are added yet.
Name | Mastery | Learn | Test | Matching | Spaced | Call with Kai |
|---|
No study sessions yet.
7 Terms
Decision Trees
A form of diagrammatic analysis used to help businesses with making decisions where there are a number of different options from which to select
Decision trees are particularly useful in situations where chance (or probability) plays an important role in likely outcomes
Decision trees build probability of success and failure into the decision-making process, which helps to provide an effective and clear structure for presenting options through the 'expected values', which are the financial returns that can be gained for each option, taking into account both success and failure of each course of action
Components of a decision tree

Drawing Decision Tree: 1st step
The drawing of a decision tree starts with a decisions node (square). Decision nodes represent points where a business has to make a choice between alternatives.
From this decision node we draw out lines towards the right for each possible option or choice, and write the option along the line
At the end of each line, we consider the likely outcome of a decision. If the result of taking that decision is uncertain, we draw a circle - a chance node

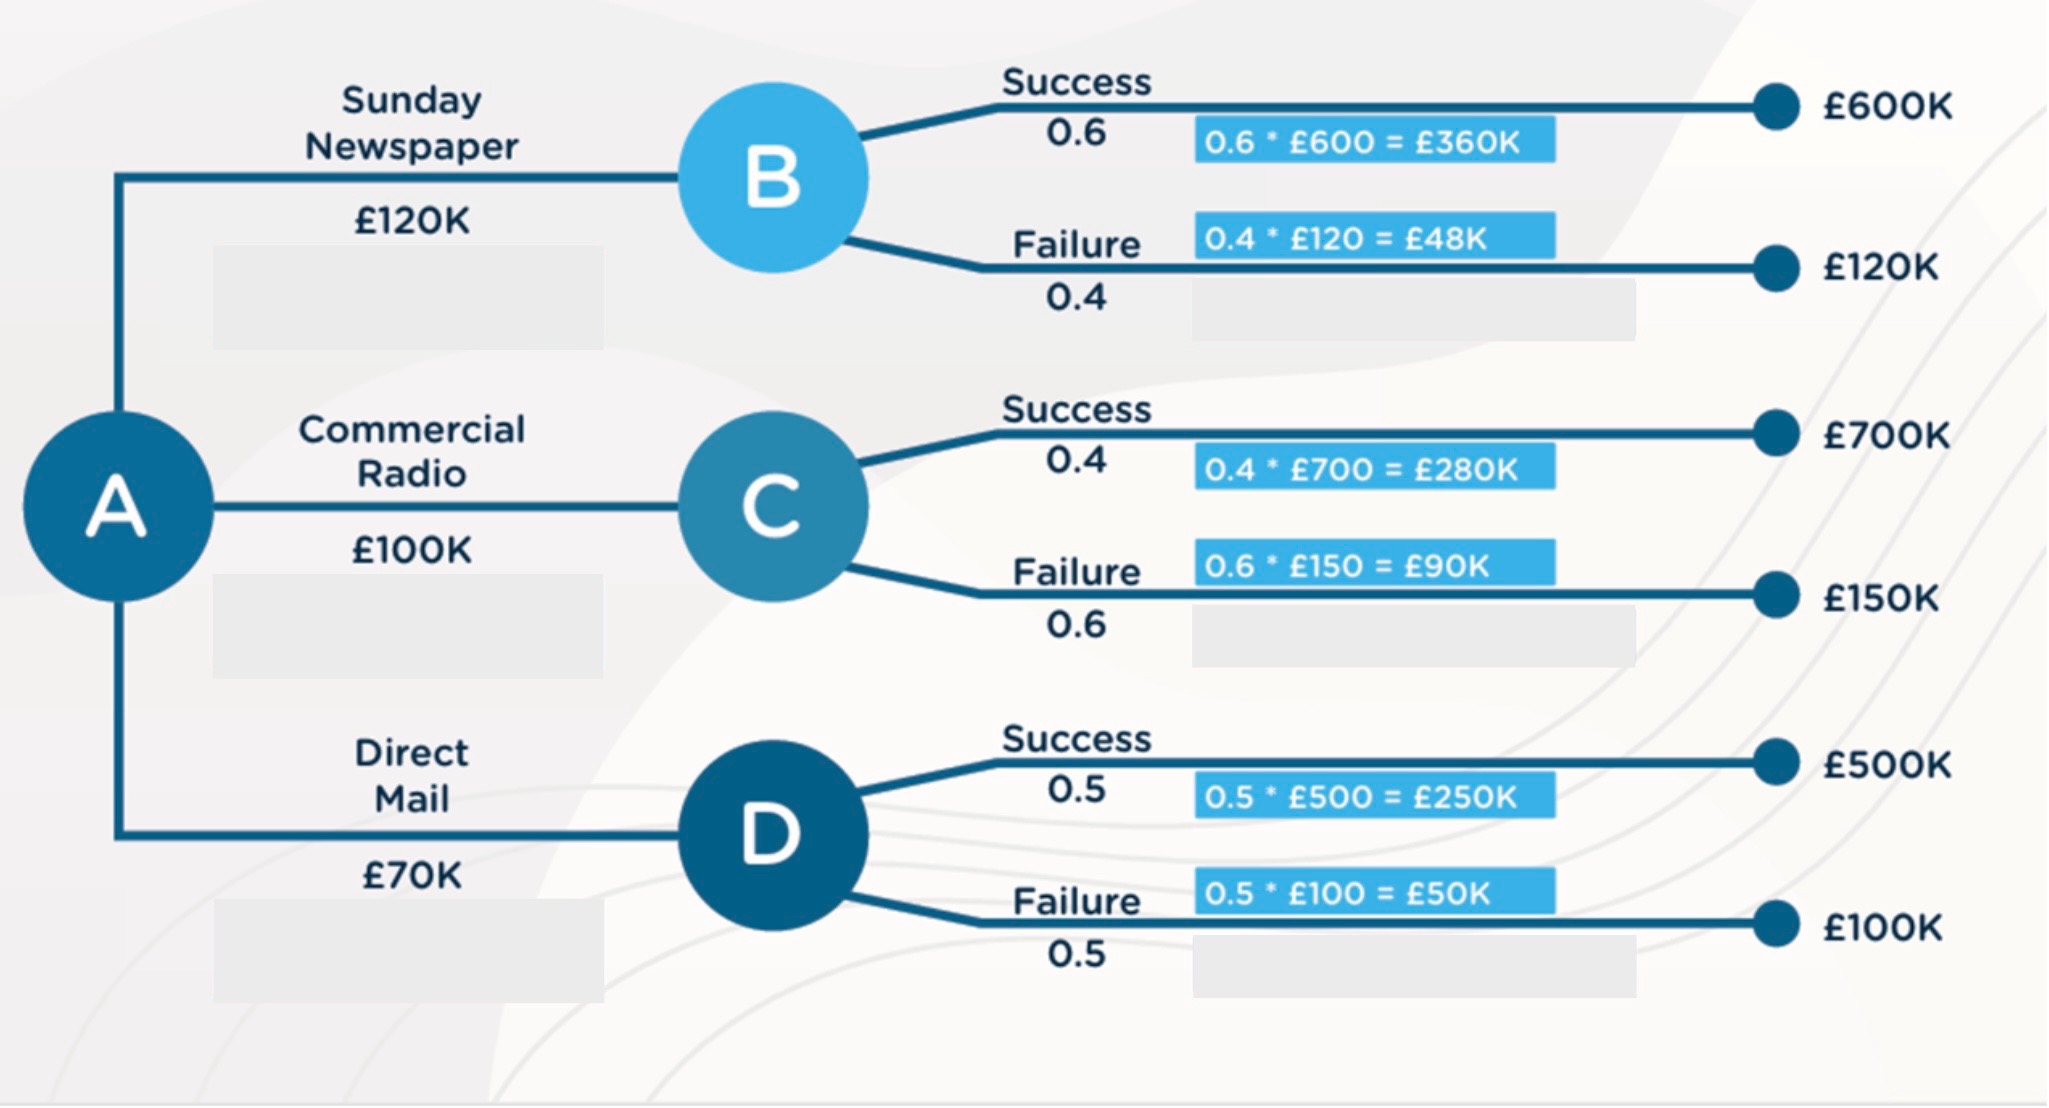
Drawing Decision Tree: Step 2
From each Chance Node draw 2 lines and label them with the 2 possible outcomes (success/failure) and probabilities for the 3 options
For each option multiply the probability with the estimated revenue E.g. 0.6 x £600 = £360K
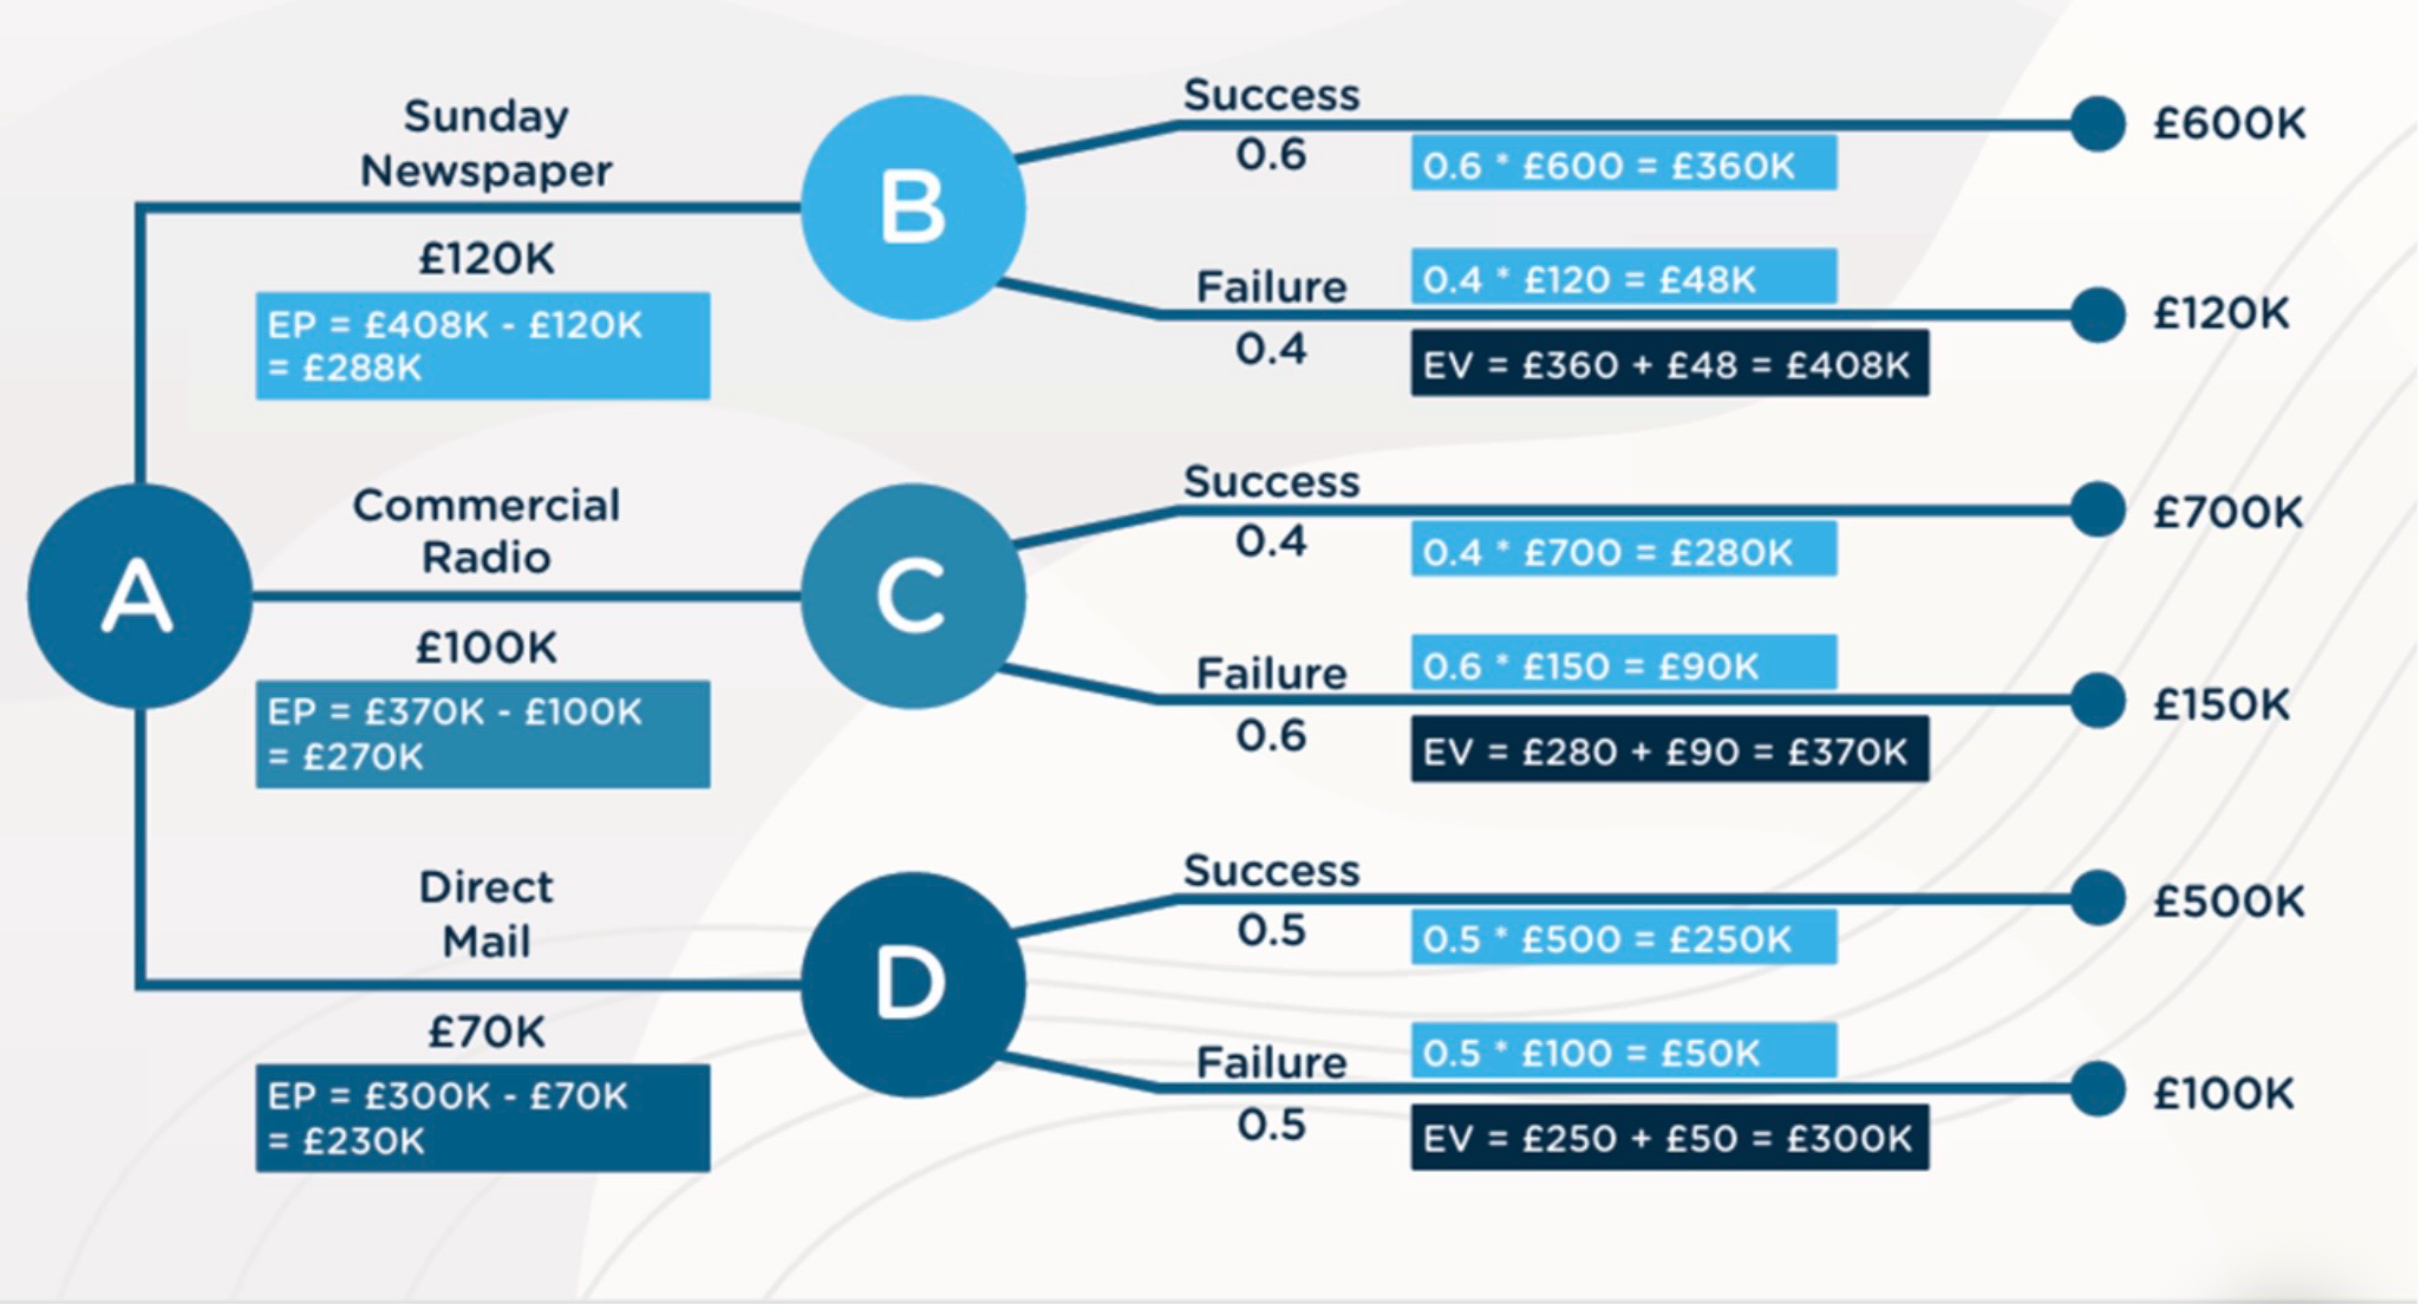
Drawing Decision Tree: Step 3
Calculate the expected value by adding the values from both outcomes and take away this value from the cost to get the expected price E.g. EV= £360 + £48 = £408K
EP= £408K - £120K = £288K
Then choose the highest value E.g. Sunday Newspaper
Benefits of Decision Trees
Clearly lay out the problems so that all options can be considered
Allows managers to analyse fully the possible consequences and risks of a decision
Provide a framework to quantify the values of outcomes and the probabilities of achieving them
Likely costs are considered
Limitations of Decision Trees
Use probabilities which only gives an estimate, these may be inaccurate
Can oversimplify a decision and focus too much on the financial outcome
Don’t include other factors such as manpower considerations, managers’ opinions and marketing issues
Can be time consuming to construct
Uses quantitative data only