BIN300 W5 Spurious associations
1/14
There's no tags or description
Looks like no tags are added yet.
Name | Mastery | Learn | Test | Matching | Spaced | Call with Kai |
|---|
No analytics yet
Send a link to your students to track their progress
15 Terms
Spurious associations due to
mixture of populations, black cows more milk than red cows, association between color locus and milk production
family structure, some families with high milk production, same families happen to have allele A (from particular sire), association between A-allele and milk, A-allele may be at other chromosome than milk
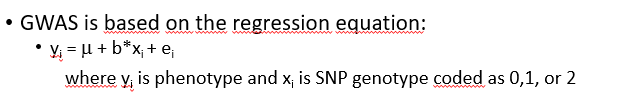
GWAS is based on the regression equation
In statistics: spurious association =
non causal relationship, pure coincidence, other confounding factor that creates the relationship
spurious assocaition
human disease genetics
avoided by balancing the cases and controls
within every family with a disease case also pick a control individual
doubles genotyping costs (otherwise controls could be taking form earlier study)
livestock spurioius association
few large families, family structure is very strong, important ot account avoid spurous association
Q-Q plot
Quantile-Quantile plot
shows associaon problems
expected value of a statistic (with known distribution) against actual value
e.g. highest expected t-statistic (from t-distribution) agianst highest t-value found
under Ho: straight line with slope 1
GWAS study: plot expected P-value against actual P-values
expected P-value under H0: uniform distrbution between 0-1
plot -log(Pvalue)
to spread Pvalues that are close to - (i.e. significant Pvalues)
minus to make high values significant (instead of low values)
QQ plot
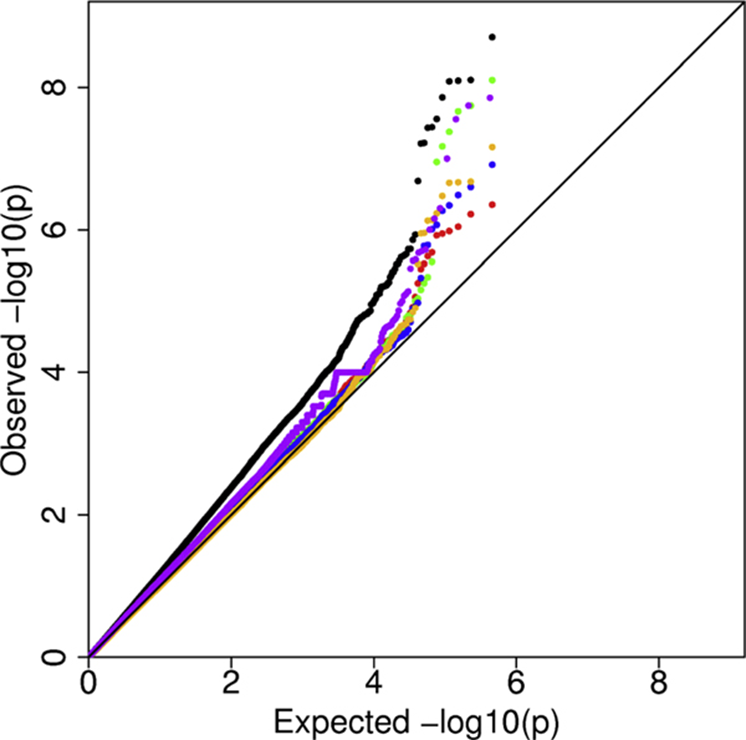
H0: expected points on black line
Blue points/: ok results, most points on black line, highest Pvalues exceed black line, significant results
black pints: spurious association: low Pvalue points show inflated values, dont trust most extreme results
lambda is slope of points, measure of spurious association, lambda=1: no spurious association
definition of spurious association
non-random association between SNP and QTL at other chromosome
more broad definitions: SNP and QTL at same chromosome, but at different positoin, this may be seen as QTL signal that is not at the exact QTL position, associaiotn between SNP and enviornmental effects
ass
assocation betwen SNP and QTL at different chromosome?
SNP and QTL come from same pedigree
if pedigree relationships strong: can predict QTL and SNP
thus SNP can also predict QTL, even when on different chromosome
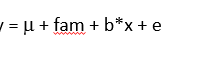
Transmission-disequilibrium test (TDT) test
correct for family effect (pedigree is same within family)
tests whether effect is same within all families, fam uses a lot of degrees of freedom, relatively low power of the test
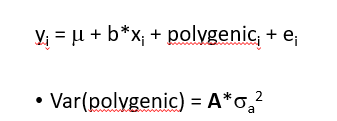
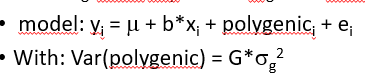
polygenic effect (A)
fit effect of background genes for every animal
A coorelation matrix based on pedigree, e.g. fullsibs have 50% of genes in common Aij =0.5, instead allocating i and j to family or not → more finescale distinctions: how many genes have i and j in common
requires variance component analyses for every snp
estimate sigmaa2 and sigmee2 for every SNP
polygenic effect G
use polygeneic effect with correlation matrix G (genomic relationships)
G uses actual SNPs on SNPchip to determine how many alleles in common, accounts for what happens at the genome, e.g. fullsibs may have 45% of genes in common instead of 50% (as assumed from pedigree)
tests whether SNP x explains more than the average SNP on the SNPchip
H0: SNP x explains about the same variance as any other SNP in the genome, instead of H0: SNP x explaisn no variance
Does this solve the spurious assication problem
TDT
G MATRIX
A MATRIX
Q-Qplot
TDT- test: yes
Fitting polygeneic effect with G matrix: yes
Fitting polygeneic effect with A matrix: no, may have more or less alleles in common than indicated by pedigree
test whether spurious associations are solved by Q-Q plot
spurious association in livestock
very important, due to mixture of poulatuions and family structure
can be detected by q-q plot, may be solved by TDT test, fitting polygeneic effect, using pedgree relatinship matrix A and G