Latent Heat
1/13
There's no tags or description
Looks like no tags are added yet.
Name | Mastery | Learn | Test | Matching | Spaced |
|---|
No study sessions yet.
14 Terms
Limits of Motion
(1)

Energy Input
(2)

Melt
(3)

Evaporate
(4)

Freeze
(5)
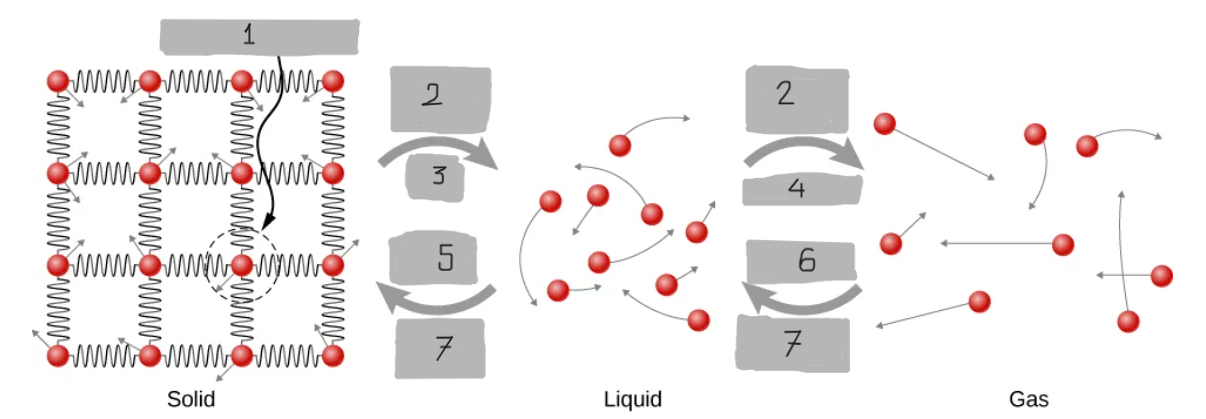
Condense
(6)

Energy Output
(7)

Heating Curve
A graph of temperature v/s heat added showing sloped segments
Temperature changes
What do the sloped segments in the graph of temperature v/s heat added represent.
Phase changes
What do the flat segments in the graph of temperature v/s heat added represent.
Q = mcΔT
Mathematical representation of the sloped segments in the graph of temperature v/s heat added
Q = mL
Mathematical representation of the flat segments in the graph of temperature v/s heat added
Dew Point
The temperature at which air becomes saturated with water vapor and condensation begins for a given humidity.
Evaporative Cooling (Sweating)
When sweat evaporates, it absorbs heat from the skin (Q = mL_v),
Cooling the body
More energy is needed to evaporate water below 100°C than at 100°C because molecules have less thermal energy.