4.1 national income
1/53
There's no tags or description
Looks like no tags are added yet.
Name | Mastery | Learn | Test | Matching | Spaced | Call with Kai |
|---|
No analytics yet
Send a link to your students to track their progress
54 Terms
The multiplyer
The idea that an initial injection can result in a rise in national income greater than this injection
Marginal propensity to consume
The proportion of additional income that is spent on goods and services in the economy
Marginal propensity to save
The proportion of additional income that is saved and thus leaks out of the circular flow
Marginal propensity to import
The proportion of additional income that is spent on imports
MPC formula
Δc/Δy
MPS formula
1-MPC
MPM formula
Δm/Δy
Formula for the multiplyer
1/(mps+mpm+mpt)
Aggregate demand
The total demand for an economies goods and services at a given price level in a given time
Aggregate supply
The total output that producers in an economy are willing and able to supply at a given price level in a given time
Formula for aggregate demand
GDP
Factors that influence consumption
Level of income
Availability of credit
Interest
Income tax
Factors that influence investment
Cost of capital goods
Business people’s expectations
Government expenditure (e.g. grants)
State of technology
Factors that influence exports
Level of incomes abroad
Exchange rates
Government incentives
Competitiveness
Factors that influence imports
Availability of goods
Price of goods
Levels of income
Exchange rates
Factors that affect the rate of saving
Future expectations
Price levels
Interest rates
Demographics
Effects an increase in savings might have
Reduce spending
Reduce inflation
Exchequer: decreased VAT but increased DIRT
Economic growth
A real increase in GDP over a period of time
Recession
Two consecutive quarters of negative economic growth
Positives of economic growth
Increased employment
Improved exchequer
Improved standard of living
Decreased emigration
Negatives of economic growth
Inflationary pressure
Use of scarce resources (e.g. fossil fuels)
Increased demand for imports
Uneven distribution of wealth
Economic consequences of a recession
Reduced consumer spending
Reduced standards of living
Decline in investments
Reduced government revenue
Uses of national income statistics
Comparing the standard of living in different countries
Assist the government in formulating economic policy
Determine EU contributions/benefits
Limitations of national income statistics
Population change is not considered
Social cost (e.g. increased pollution)
Shadow economy is not taken into account
Nature of the goods produced is not considered (e.g. goods made for war)
NFIA
The difference between incomes earned by foreign factors of production in Ireland and sent abroad Vs income earned by Irish factors of production abroad and returned to Ireland
GDP
Value of all goods and services produced by Irish and foreign owned factors of production in the domestic economy
GNP
Value of all goods and services produced by Irish-owned factors of production in the domestic economy and abroad
GNI
The total income that is earned by Irish residents and businesses regardless of where that income is earned
GNI*
GNI without the influence of multinationals
GNDI
Income available to the nation for gross savings and for final consumption
Formula for GDP
Y = I+C+G+(X-M)
GNP formula
GDP - NFIA
GNI formula
GNP + EU subsidies - EU contributions
GNI* formula
GNI - Adjustments
GNDI formula
GNI* - foreign aid
Why is GDP higher
Repatriation
Remittance
Repayment of interest
Repatriation
When a company sends profits earned abroad back to its home country
Remitance
When an migrant sends money back to their country of origin
Shadow economy
All economic activity which goes unrecorded by national income statistics
Economics effects of the shadow economy
Loss of tax revenue
Decline in legitimate business
Increased government expenditure on enforcement
Standards of products declines
Business cycle
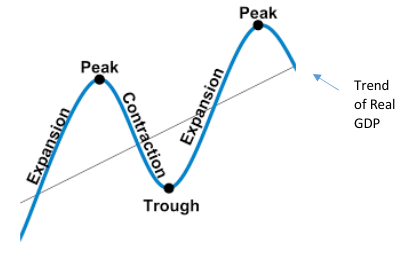
Features of a business cycle
Expansion
Peak
Recession
Depression
Trough
Recovery
Causes of a recession
Decline in consumer confidence
Decrease in investments
External shock
Inflation and deflation
Positive demand shock
A sudden increase in demand. This causes a shift of the AD curve to the right
Negative demand shock
A sudden decrease in demand. This causes a shift of the AD curve to the left
Positive supply shock
A sudden increase in output which causes a shift in the AS curve to the right
Negative supply shock
A sudden decreases in production causing the AS curve to shift to the left
Macro equilibrium
Where aggregate demand intersects with aggregate supply
At current market prices
This means GDP/GNP/GNI is measured using the prices that were in effect during the period measured, without adjusting for inflation
At factor prices
This means GDP/GNP/GNI is measured using the prices paid to factors of production
Expansion
Initial stages of economic growth driven by low intrest rates and prices.
This encourages consumers and firms to borrow.
This leads to increased investment and consumption
There are optimistic expectations
Peak
The economy is at its maximum capacity
Shortages occur for raw material and labour
There is inflation
Property bubbles develop
Central banks increase intrest rates leading to a fall in investment and consumption, lowering aggregate demand
Recession charectersists
A fall in real GDP for two consecuitive quarters.
The initial fall in aggregate demand fuels negative business expectations as there appears to be demand side shock
There is increased unemployment
Investment falls
Trough
Lowest point on the downward curve. It marks the point from which the economy begins to recover