Data Analysis Exam Review
1/82
There's no tags or description
Looks like no tags are added yet.
Name | Mastery | Learn | Test | Matching | Spaced |
|---|
No study sessions yet.
83 Terms
Hypothesis
Null hypothesis
X does not cause Y or is not associated with Y
Type I error
False positive (wrongly rejecting a null hypothesis)
Type II error
False negative (failure to reject a null hypothesis that ought to be rejected)
Statistical significance
Allows us to measure whether data we observe is attributable to random chance alone
Descriptive data
Meant to reflect some truth about the world as it is
Mean
The average, x̄, or result of adding up all numbers (n) in a given set, then dividing by the number of numbers
Median
The middle, or the number in the middle when all numbers in a given set are arranged from smallest to largest
Mode
The most common or repeated observations
Normal distribution
Data that are distributed normally are symmetrical around their mean in a bell shape
Standard Deviation
Measure of how disperse the data are from their mean; how spread out the observations are - assigns a single number to a dispersion around the mean
The _ the standard deviation, the closer the data points tend to be to the mean
Lower
The lower the standard deviation, the ____ the data points tend to be to the mean
Closer
Standard error
Measure of the dispersion of the sample means (in the underlying population)
The standard error=
Standard deviation of the sample means
Large standard error
Sample means are spread out widely around the population mean
Small standard error
Sample means are clustered relatively tightly around the mean; so the more representative it is of the overall population
Ordinal Variables
Have a clear order to them; can be ranked
Ordinal Variable Eg.
Party ID ordered from left (1=Strong Democrat) to right (7=Strong Republican)
Categorical Variables
Observations correspond to categories/classes that do not necessarily have intrinsic ordering
Categorical Variable Eg.
Male vs female (0, 1)
Numerical Variables
Exact numbers that are evenly spaced apart
Numerical Variables Eg.
Exact income in dollar amounts, age, etc.
Formula for formulas in Excel
= FORMULA NAME(range: in parentheses)
Correlation
Measures the degree to which two phenomena are related to one another
Two variables are positively correlated if
A change in one is associated with a change in the other in the same direction
Two variables are negatively correlated if
A change in one is associated with a change in the other in the opposite direction
Correlation coefficient
Encapsulates the association between two variables in a single descriptive statistic
Correlation of 0 (or close to it)
Variables have no meaningful association with one another
Spurious correlation
Two variables appear to be directly related, but a hidden third variable actually influences both, or when the relationship exists purely by coincidence without any underlying causal mechanism
Expected value (or payoff)
Sum of all the different outcomes, each weighted by its probability and payoff; tells you whether a particular event is "fair," given its price and expected outcome
P-Value
A number between 0 and 1 that expresses the probability that the null hypothesis is true
Probability
Study of events and outcomes involving an element of uncertainty; not about the world we see, but about all the possible worlds
"Black swan" events
When events that may occur only "very rarely" do eventually happen
Expected Value
Way to more precisely understand the value of a decision - a shorthand for understanding the stakes of a choice
Calculate Expected Value
Weigh (multiply) all possible outcomes by their probability and payoff and then sum them
Law of Large Numbers
The more independent observations you draw randomly from a population, the closer the mean of those observations will get to the mean of the population
Selection bias
When mechanism for sorting individuals into one group or the other is not random; participants are not representative of the population
Publication bias
Positive findings are more likely to be published than negative findings, which can skew the results that we see
Recall bias
When participants do not remember previous events or experiences accurately; recalling the past based on the present or things that have since happened
Survivorship bias
When researchers focus on individuals, groups, or cases that have passed some sort of selection process while ignoring those who did not
Healthy user bias
People who faithfully engage in activities that are good for them are fundamentally different from those who don't
Central Limit Theorem
"A large, properly drawn sample will resemble the population from which it is drawn" - If we know about a population, we can make inferences about a sample, and vice-versa
Causal inference
Study of what we can learn about whether X causes Y, and if so, what effects X has on Y (causal hypothesis)
Experiments
Most common and strong way to learn about the effect of X on Y
Causal Effect
Compares the outcomes of different treatment values to quantify the impact of a treatment
Causal Effect Formula
Yi(1) - Yi(0)
Confounders
Things we do not directly observe that may be affecting the relationship we are interested in
Some experimental basics
Treatment, Subjects or participants, Potential outcomes, Average treatment effect/average causal effect, Randomization
Average treatment effect (ATE)
Average of the causal effects (treated potential outcome - untreated potential outcome) for all subjects
Three core assumptions of experimental analysis
Randomization, Noninterference, Symmetry
Randomization
Allows us to assume that potential outcomes are unrelated to pre-treatment covariates or characteristics
Noninterference
Each subject's potential outcomes reflect only whether that subject is treated or not -- a subject's potential outcomes are not affected by the treatments that other subjects receive
Symmetry
Identically structured treatments
Compliance
Whether or not people completed their assignment
Intent-to-Treat (ITT)
All participants who were enrolled and randomly allocated to treatment are included in the analysis and are analyzed in the groups to which they were randomized
Attention
Were people paying attention to your study? Or did they just give you a random number to make you happy?
Pre-registration
Declaring your expectations in advance of what you'll find
Demand effects
People infer what you're trying to do and respond accordingly
T-test
Determines whether the mean difference between two groups (experiment and control/placebo) is statistically significant
If the t-test is a value higher than 1.96 OR lower than -1.96
The associated p-value is .05 or less
Statistical significance p-value
0.5 or less
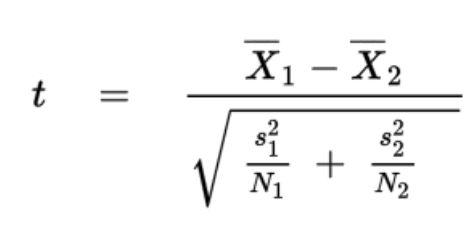
T-test formula for experimental data
Regression
Tool used to understand relationships between independent and dependent variables
Regression Equation
Y = a + bX
Y in Regression Equation
The outcome variable we are interested in (dependent variable)
X in Regression Equation
Independent variable
a in Regression Equation
The y-intercept (the value for x when y is zero)
b in Regression Equation
The coefficient associated with each X independent variable
Bivariate Regression
Just one dependent and one independent variable
Multivariate Regression
One dependent variable and many independent variables
Regression Coefficient
Measures the average change in the Y variable if the X variable changes, holding everything else constant
R Squared (R^2)
Measures the amount of variation in the Y that is explained by your regression
0 in R^2
None of the Y is explained by your regression
1 in R^2
All of Y is explained by your regression
Confidence interval
Gives an estimated range of values that is likely to include the "actual" number you are looking for
Types of variables
Categorical, Ordinal, Nominal, Dummy/binary, Continuous
Ordinal
Variables that can be ranked
Nominal
Variables that cannot be ranked
Dummy/binary
Variables that only have two types of observations (almost always 1's and 0's)
Continuous
Observations are numbers that have intrinsic ordering, with potentially infinite range (eg. height, weight)
Standardization
Achieved by converting everything into standard deviation units
Running a regression in R
Object name ← lm (dependent variable ~ independent variable, data = data set name)