AP2 - practical 1 - heart
 Call Kai
 Learn
Learn Practice Test
 Spaced Repetition
 Match
Match Flashcards
 Knowt Play
1/118

There's no tags or description
Looks like no tags are added yet.
Name | Mastery | Learn | Test | Matching | Spaced | Call with Kai | Chat |
|---|
No analytics yet
Send a link to your students to track their progress
119 Terms
heart

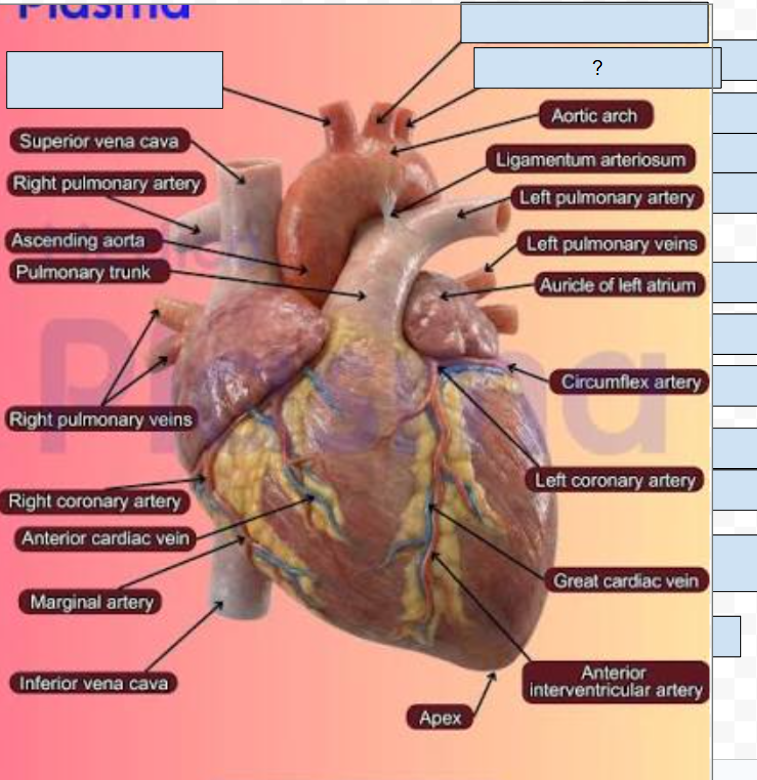
left lung

fibrous pericardium fused to the diaphragm

diaphragm

right lung

superior vena cava

right pulmonary artery

ascending aorta

pulmonary trunk

right pulmonary veins
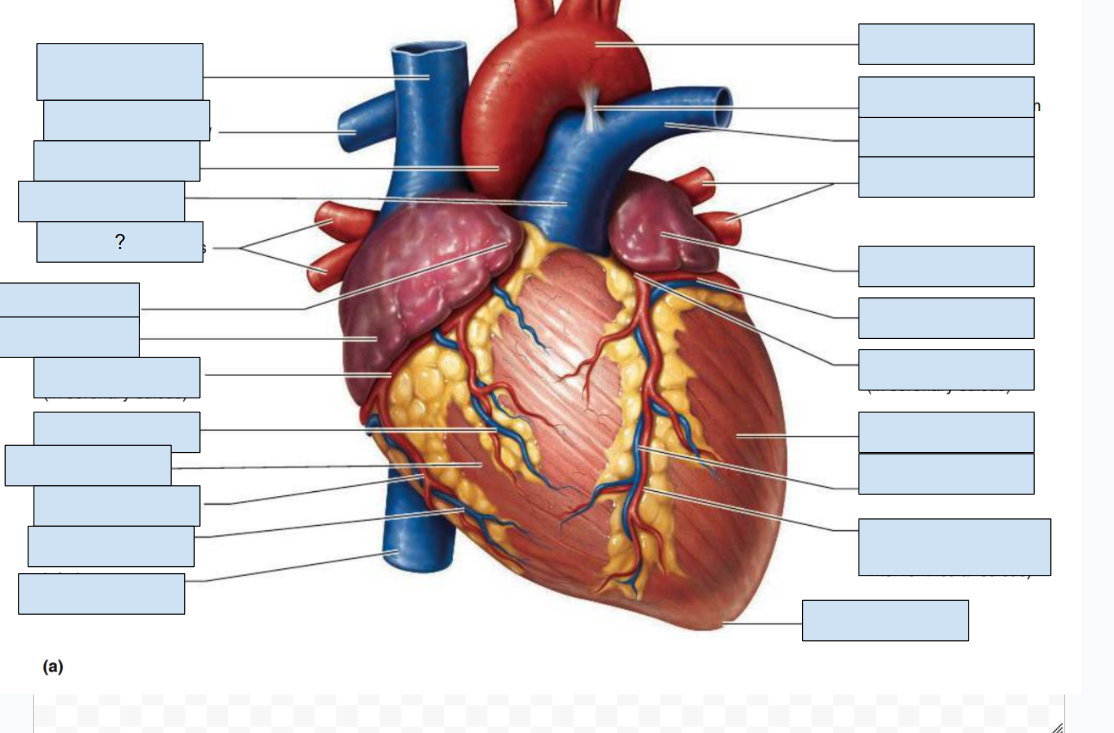
right auricle

right atrium

right coronary artery

anterior cardiac vein
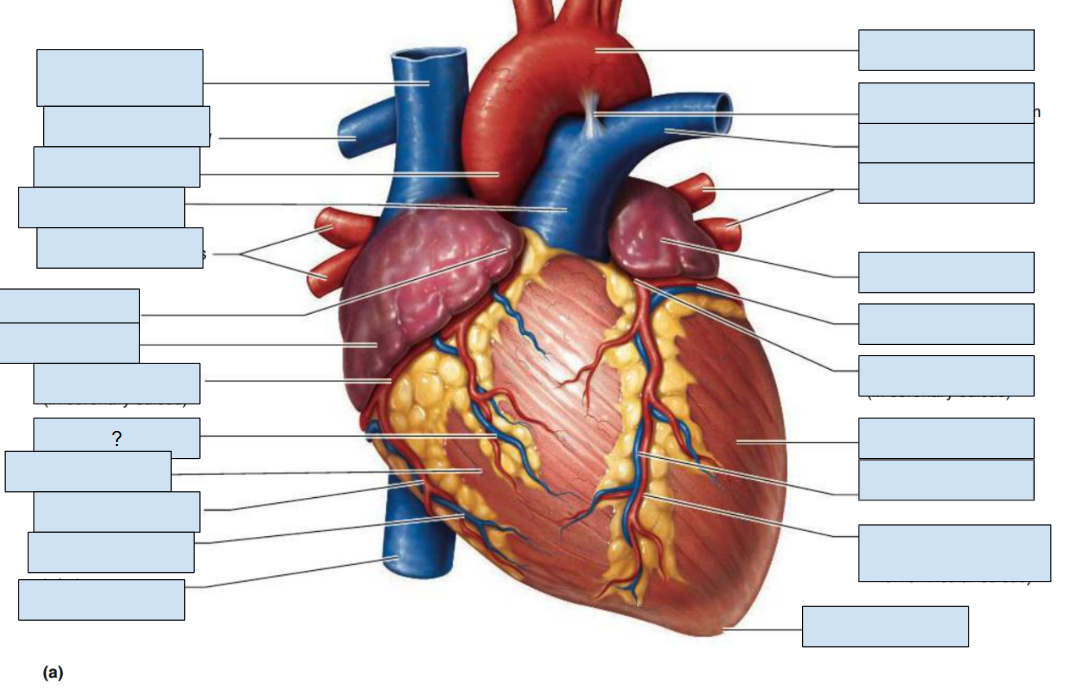
right ventricle

right marginal artery
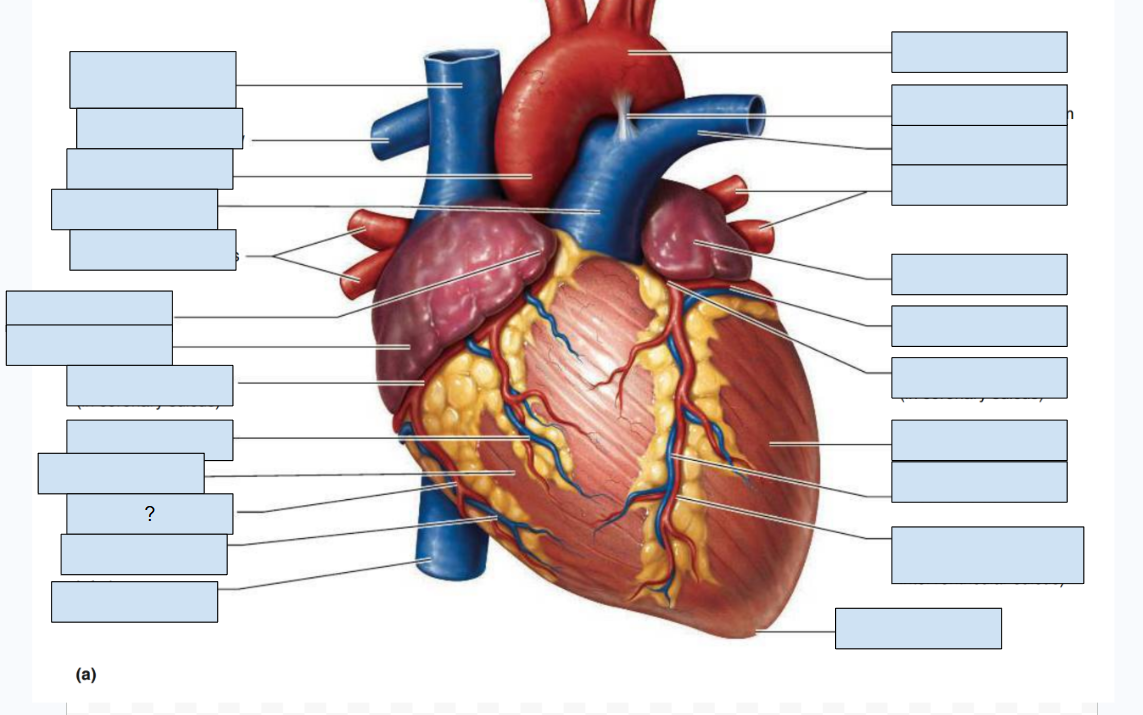
small cardiac vein
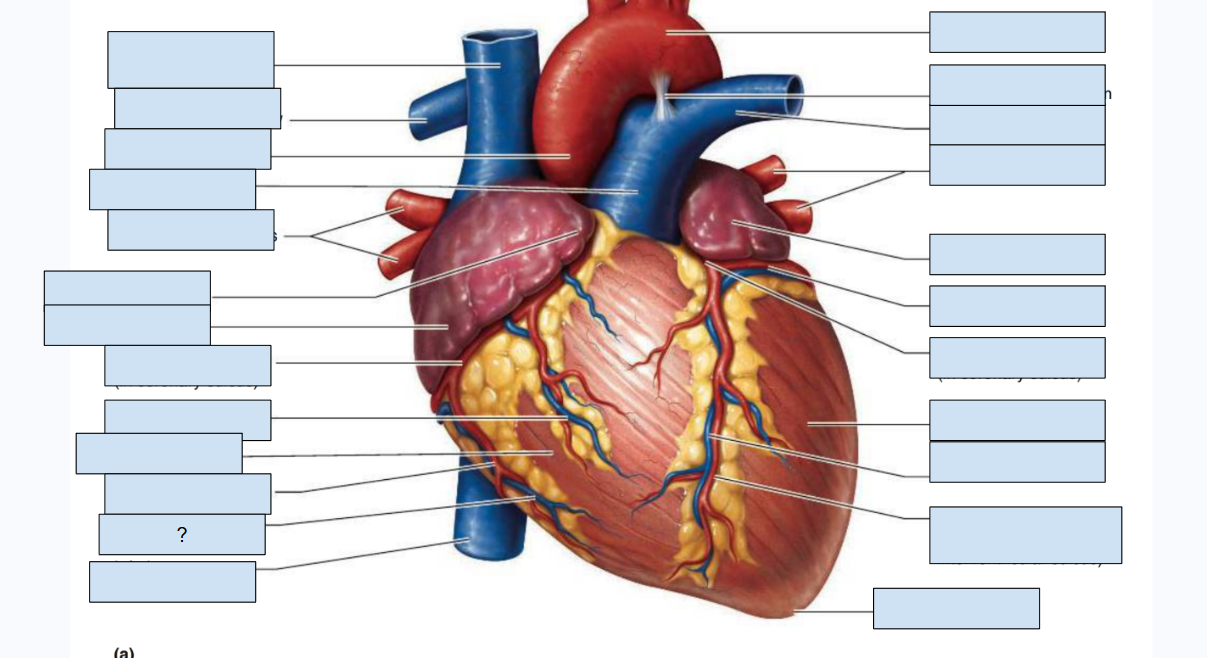
inferior vena cava

aortic arch
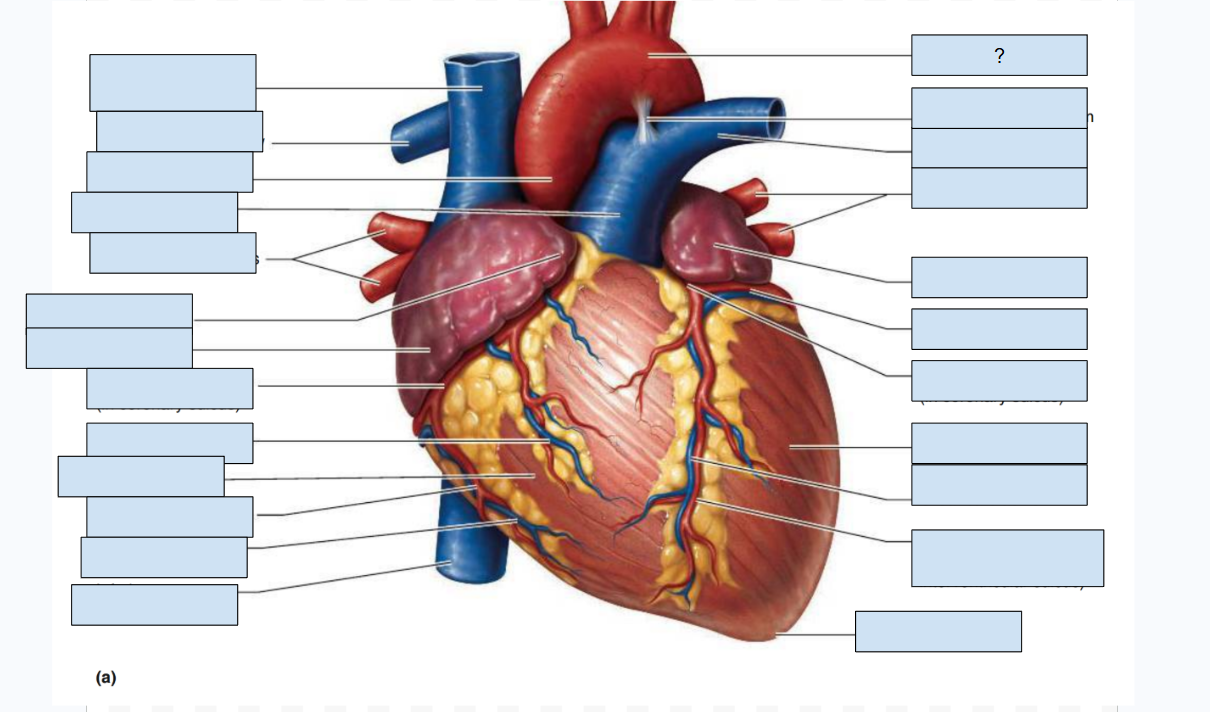
ligamentum arteriosum

left pulmonary artery

left pulmonary veins

left auricle
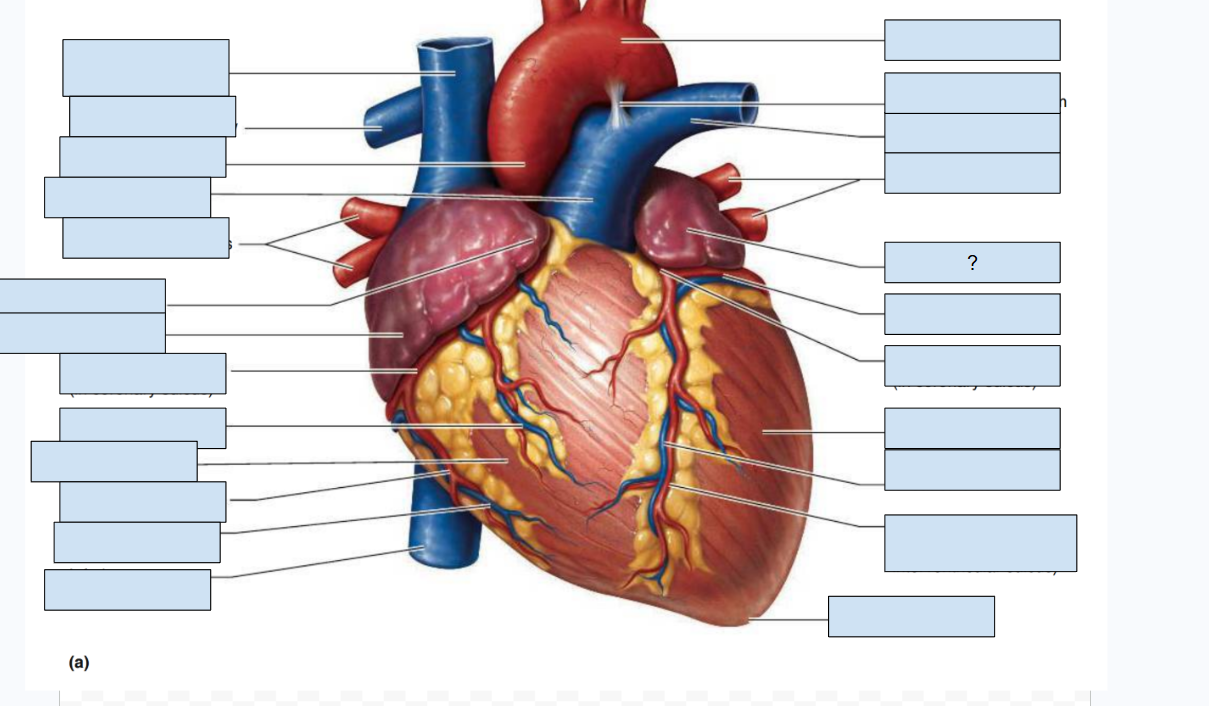
circumflex artery

left coronary artery

left ventricle

great cardiac vein

Anterior interventricular
artery (in anterior
interventricular sulcus)
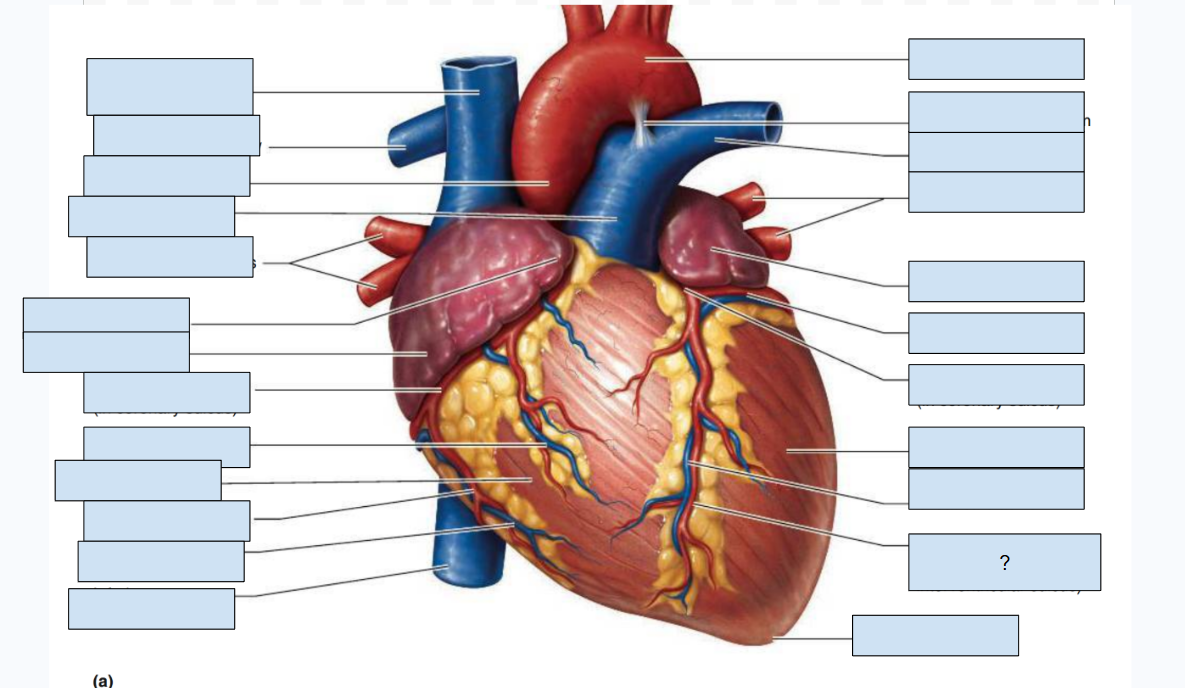
apex

brachiocephalic artery

coronary sinus

coronary sulcus
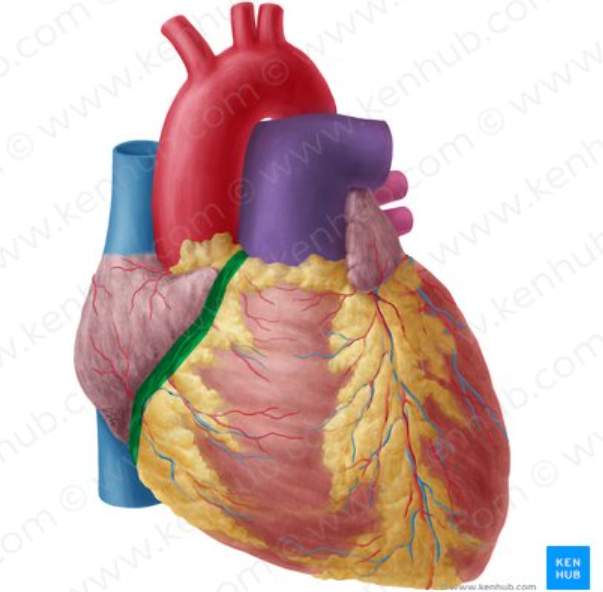
anterior interventricular sulcus
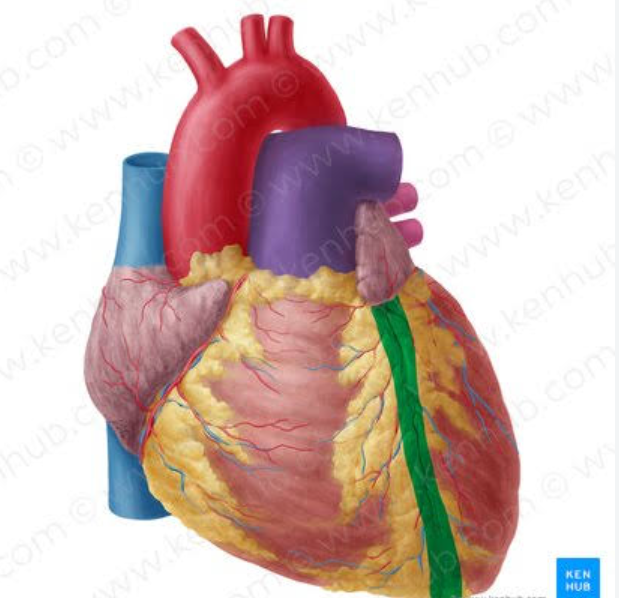
posterior interventricular sulcus

left common carotid artery

left subclavian artery
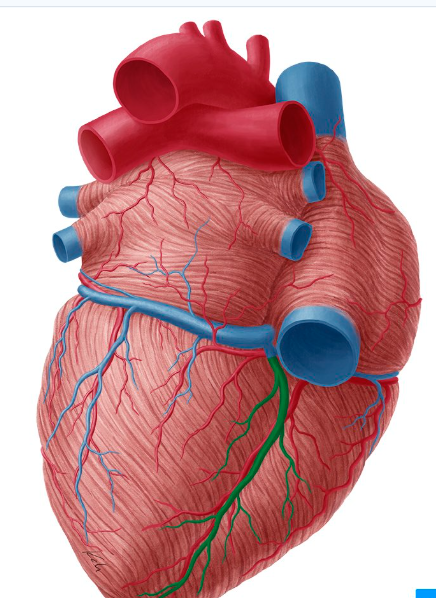
posterior interventricular artery

middle cardiac vein
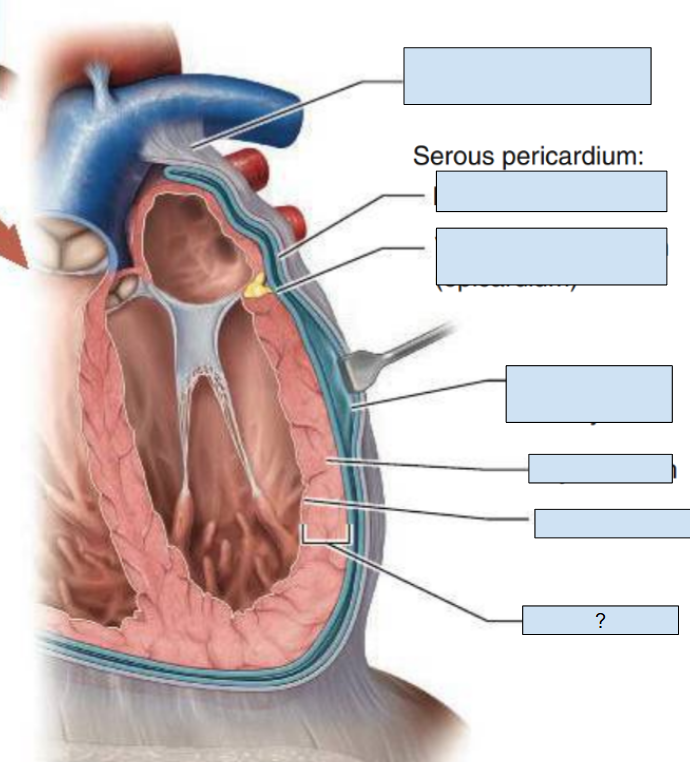
fibrous pericardium

parietal pericardium
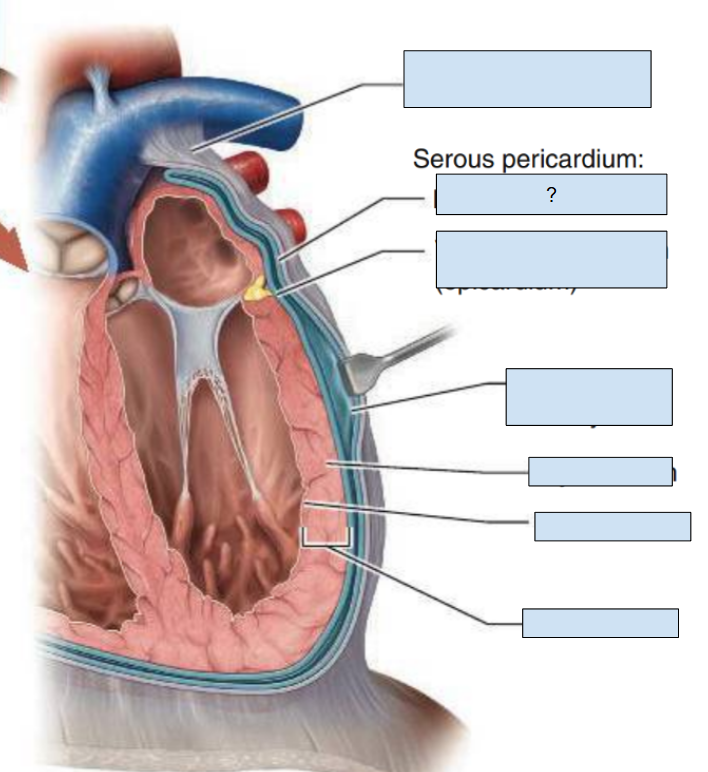
visceral pericardium
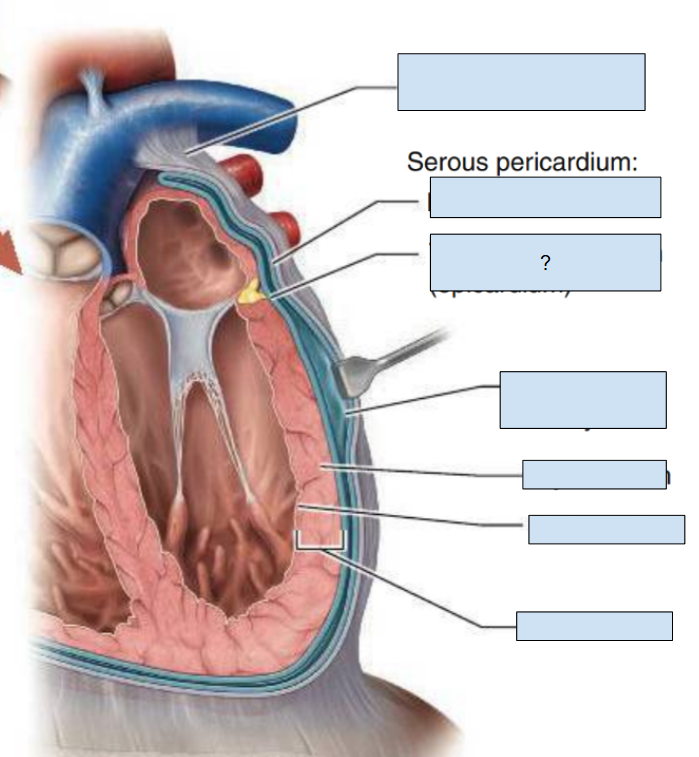
percardial cavity

myocardium
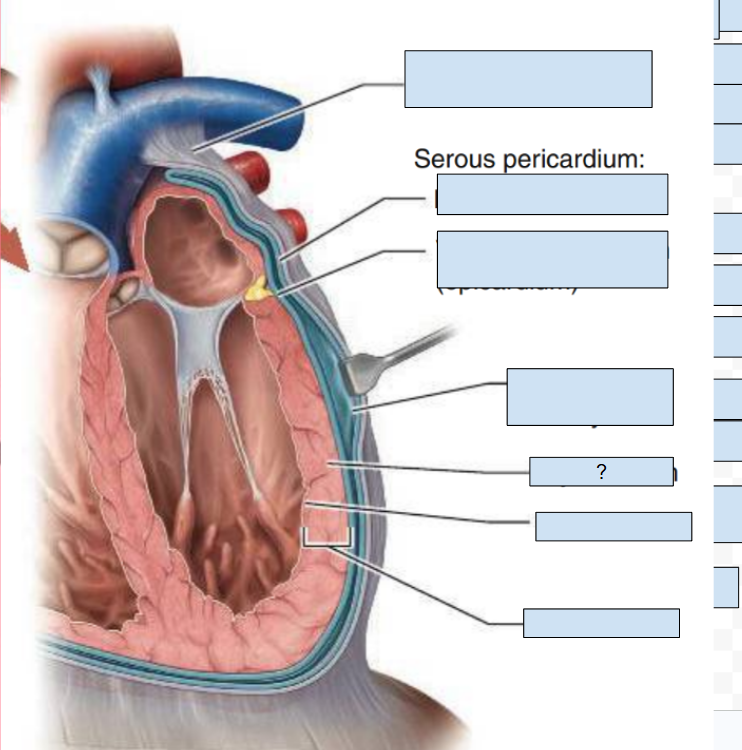
endocardium

heart wall
coronary sinus

coronary sinus

cardiac muscle

cardiac vs skeletal muscle tissue
Feature | Cardiac Muscle Tissue | Skeletal Muscle Tissue |
Control | Involuntary (autonomic nervous system & intrinsic pacemakers) | Voluntary (somatic nervous system) |
Location | Heart walls (myocardium) | Attached to bones via tendons |
Fiber Architecture | Branched network | Long, unbranched cylindrical fibers |
Nuclei | Single (or occasionally double) central nucleus per cell | Multinucleated (peripheral nuclei) |
Cell Communication | Intercalated discs with gap junctions | Separated by connective tissue (no gap junctions) |
Contraction Rhythm | Continuous, rhythmic self-excitation | Required neural impulse per contraction; variable force |
Fatigue Resistance | Extremely high (rich in mitochondria and myoglobin) | Low to moderate (susceptible to lactic acid buildup) |
auscultation lab procedure
Summary:
Preparation: Watch the Pre-Lab Video on heart auscultation in Mastering A&P (Exercise 17) and sanitize the stethoscope eartips and diaphragm using an alcohol pad.
Setup: Put on the stethoscope and tap the diaphragm lightly to confirm sound transmission.
Auscultation & Recording: Place the diaphragm sequentially over the tricuspid, bicuspid (mitral), aortic, and pulmonary valve areas. Listen across several cardiac cycles to identify the S1 and S2 ("lubb-dupp") sounds, describe the audio observations, and record both your partner's and your own heart rates in beats per minute (bpm).
Bradycardia:
A slower-than-normal resting heart rate, typically defined as fewer than 60 beats per minute (bpm) in adults.
Tachycardia
A faster-than-normal resting heart rate, typically defined as greater than 100 beats per minute (bpm) in adults.
Murmur
An abnormal, unusual sound (such as a whooshing, swishing, or rasping) heard during heart auscultation. It is caused by turbulent blood flow in or near the heart, often resulting from valve dysfunction (stenosis or regurgitation) or structural defects.
Physiology of Heart Sounds
S1 ("lub"): The first heart sound is caused by the closure of the atrioventricular (AV) valves (mitral and tricuspid valves) at the onset of ventricular systole (contraction), as blood pushes back against the closed valves.
S2 ("dub"): The second heart sound is caused by the closure of the semilunar valves (aortic and pulmonary valves) at the onset of ventricular diastole (relaxation), preventing backflow from the aorta and pulmonary trunk back into the ventricles.
S1 ("lub")
The first heart sound is caused by the closure of the atrioventricular (AV) valves (mitral and tricuspid valves) at the onset of ventricular systole (contraction), as blood pushes back against the closed valves.
2 ("dub")
The second heart sound is caused by the closure of the semilunar valves (aortic and pulmonary valves) at the onset of ventricular diastole (relaxation), preventing backflow from the aorta and pulmonary trunk back into the ventricles.
EKG procedure
Setup & Recording
Prep: Have the subject remove metal jewelry and sit still with arms resting on legs.
Attaching Leads:
Left wrist: Negative (black)
Right wrist: Positive (red)
Right ankle: Ground (green)
Pulse Sensor: Attach the transducer to the left middle finger pad.
Record: Keep cables slack and record while the subject sits still and breathes quietly.
Data Calculations (Average over 3 cycles for each)
Heart Rate: Divide 60 by the average R-R interval (time between R wave peaks).
Pulse Rate: Measure time between peaks on the pulse pressure trace and compare to the R-R interval.
P-R Interval: Measure start of P wave to initial Q deflection.
R-T Interval: Measure R wave peak to T wave peak.
T-R Interval: Measure T wave peak to the next R wave peak.
Sinoatrial (SA) node
Location: Upper right atrial wall
Function: Known as the pacemaker; initiates cardiac impulses. From the SA node, impulses travel to atrial cells and the AV node via gap junctions in the intercalated discs.
Atrioventricular (AV) node
Location: Interatrial septum
Function: Delay signal that permits ventricular filling. From the AV node, impulses move to the AV bundle
Atrioventricular (AV) bundle
Location: Superior interventricular septum
Function: Only electrical connection between the atria and ventricles. From the AV bundle, impulses travel to the bundle branches.
Right and left bundle branches
Location: Run down the interventricular septum toward the apex
Function: Impulses travel down the left and right bundle branches to the terminal branches of the Purkinje fibers.
Purkinje fibers
Location: Ventricular wall and papillary muscle
Function: Conduction myofibers. Impulses spread into the papillary muscles and through the ventricular wall to produce contraction
P wave
Atrial depolarization on an EKG
P-R interval
Atrial systole on an EKG
QRS complex
Ventricular depolarization
R-T interva
Ventricular systole on EKG
T wave
Ventricular repolarization on EKG
T-R interval
Ventricular diastole
P wave
Duration: 0.06–0.11
Description: Start of the P wave to the return to the isoelectric line (baseline representing the absence of electrical activity). Represents atrial depolarization (electrical event prior to systole).
0.06–0.11
p wave duration
QRS complex
Duration: <0.12
Description: Start of the Q deflection to the return of the S deflection to the isoelectric line. Represents ventricular depolarization
<0.12
QRS complex duration
T wave
Duration: 0.16
Description: Start of the T deflection to the return to the isoelectric line. Represents ventricular repolarization (electrical event prior to diastole).
0.16
T wave duration
R-R interval
Duration: 0.6–1.2
Description: The time between two consecutive R waves. This interval represents the time it takes for an action potential to be generated and spread throughout the heart. It can be used to determine heart rate.
0.6–1.2
R-R interval duration
P-R interval
Duration: 0.12–0.20
Description: The interval from the beginning of the P wave to the start of the Q deflection. The P-R interval is important for several reasons. It is roughly equal to atrial systole, and it indicates the amount of time it takes for electrical signals to travel from the SA node to the AV node.
0.12–0.20
P-R interval duration
R-T interval
Duration: 0.36–0.40
Description: The interval from the peak of the R wave to the peak of the following T wave. During the R-T interval, the ventricles remain depolarized; it is an approximate representation of ventricular systole. During this interval, blood is being forced out of the heart and into the arteries.
0.36–0.40
R-T interval duration
T-R interval
Duration: 0.5–2
Description: The interval between the peak of the T wave of one cardiac cycle to the peak of the R wave of the following cycle. It is roughly equal to ventricular diastole and indicates how long it takes the ventricles to refill with blood following contraction.
0.5–2
T-R interval duration
Q-T interval
Duration: 0.32–0.42
Description: The interval between the beginning of the QRS complex and the end of the T wave. The Q-T interval represents the time of ventricular activity, including both depolarization and repolarization
0.32–0.42
Q-T interval duration
S-T segment
Duration: 0.12
Description: The section of the ECG between the end of the S wave and the beginning of the T wave. The S-T segment represents the isoelectric period when the ventricles are between depolarization and repolarization.
0.12
S-T segment duration
normal sinus rhythm
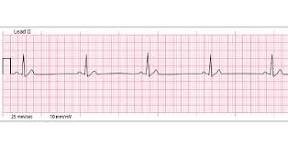
atrial fibrillation
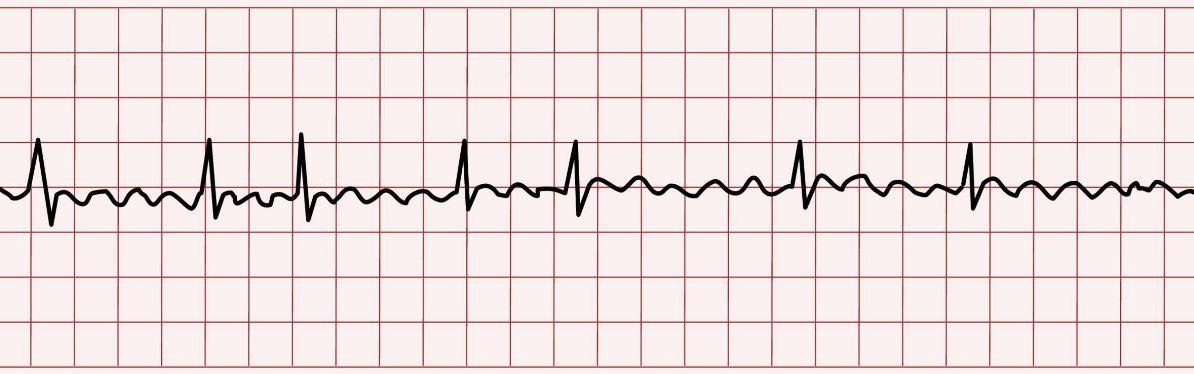
ventricular fibrillation

junctional rhythm
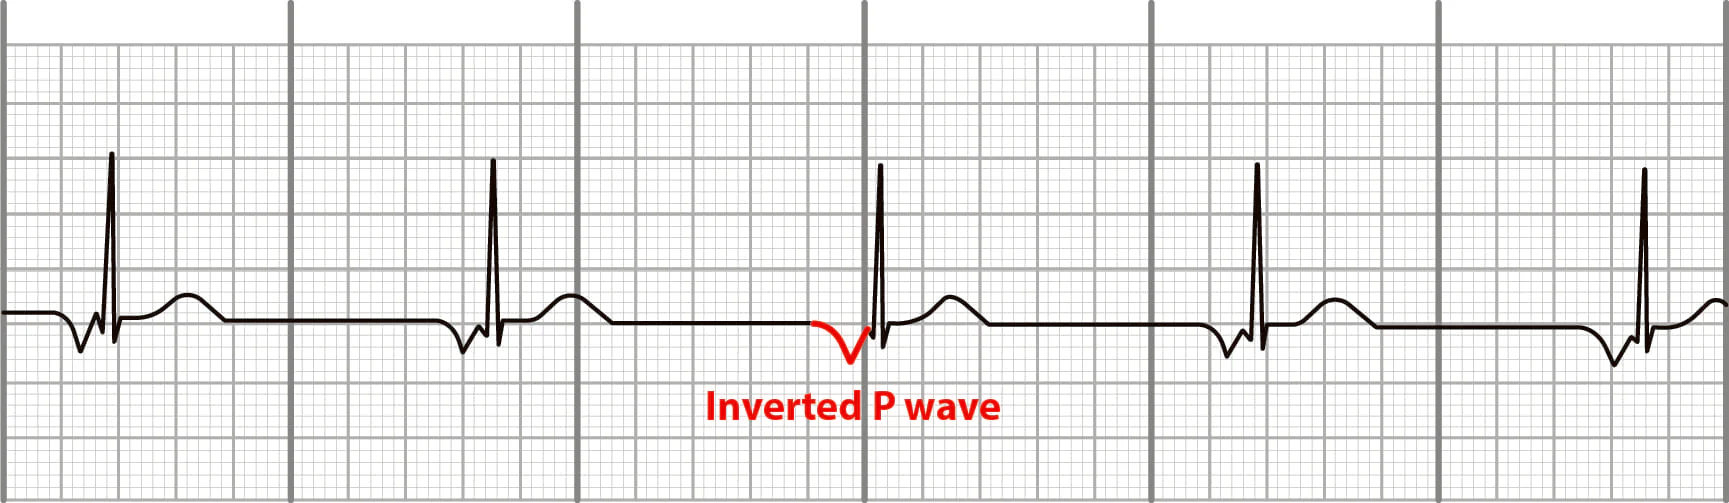
second degree av block type 1 (wenckebach)

second degree av block type 2

electrical pathway of the heart
Sinoatrial (SA) node (Impulse originates)
Atrioventricular (AV) node (Impulse pauses briefly)
Atrioventricular (AV) bundle / Bundle of His (Impulse passes to ventricles)
Right and left bundle branches (Impulse travels toward the apex)
Purkinje fibers (Impulse spreads through ventricular walls)
sinoatrial node
What is the "Pacemaker"?
aorta
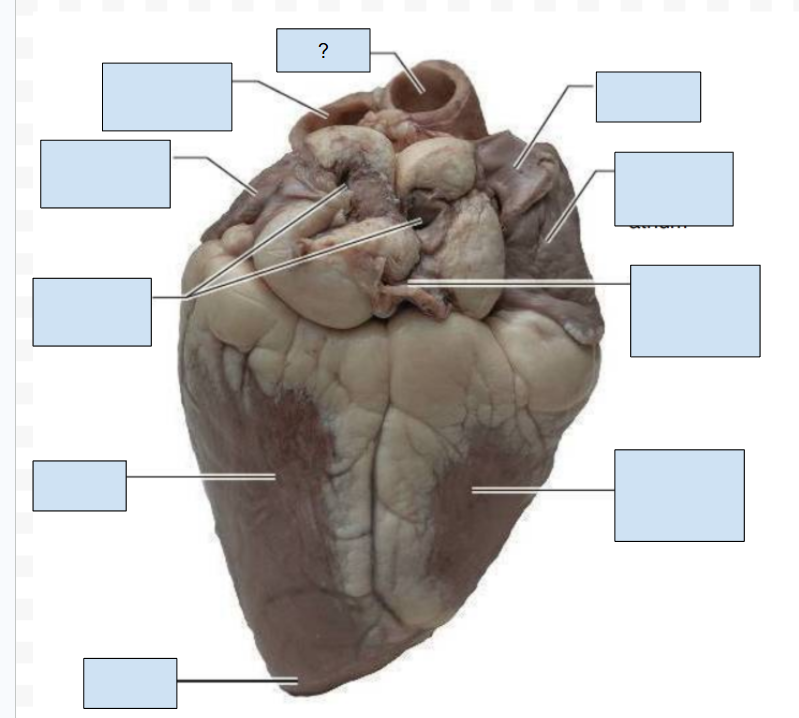
superior vena cava

auricle of the right atrium
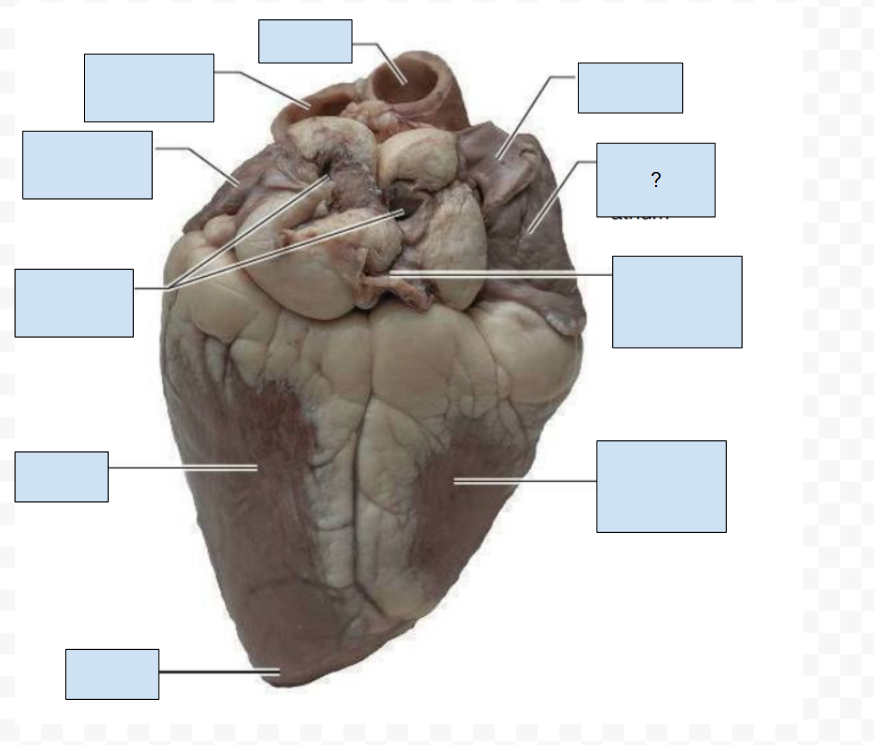
inferior vena cava

right ventricle

apex
