Market Power
1/63
There's no tags or description
Looks like no tags are added yet.
Name | Mastery | Learn | Test | Matching | Spaced | Call with Kai |
|---|
No analytics yet
Send a link to your students to track their progress
64 Terms
Market power
the ability of a firm to manipulate the price of a product either above or below the market equilibrium level. The amount of market power that a firm has determines what market structure it operates on
Market structure
refers to the categorizing of firms in particular industry, based on:
the number and size of firms in the industry
the nature of the barriers to entry and exit
the degree and intensity of price and non-price competition in the market
Perfect competition
a market structure where there is an intensive degree of competition, with no individual firm being large enough to have any market power to influence the price or quantity traded
they are price takers, which means no individual firm is large enough to have the market power necessary to influence the equilibrium output or price
have thousands of firms
free barriers to entry and exit
Make normal profits in the long run
homogenous products
allocatively and productively efficient
consumers and producers have perfect information of the products and prices
demand is perfectly price elastic
Does perfect competition exist in the real world?
It is a theoretical extreme, where there are no firms or industries that can fit these assumptions perfectly in the real world. However, this model is seen as a representation of how competition can impact a market and change the behaviour of firms.
Monopoly
A market structure where there is a single or dominant supplier of a good or service
They have significant market power, enabling them to control enough of the market supply to manipulate prices. Hence, they are price makers, with the ability to charge higher prices for it’s products
They have extremely high barriers to entry and exit, such as high set-up costs and legal barriers. Hence, they can make abnormal profits in the long run
No close substitutes, so they can enjoy their market position. It also implies demand is highly price inelastic.
Examples include Coca-Cola and Tetra Pak (the largest food packaging company in the world)
not allocatively efficient in the long run
Oligopoly
a market structure where a few large firms dominate the industry.
Competition is intense due to the large market power of each of these dominant firms, rather than due to the number of firms in the market
High barriers to entry and exit, which make it difficult for potential entrants to compete with the large and well-established firms in an oligopolistic market
goods are differentiated
Interdependence between oligopolistic firms, such as non-pricing strategies used to attract customers, which directly impact the behaviour of other market leaders in the industry
high market share/concentration ratio for each of the firms
Monopolistic competition
a market structure in which many firms exist but each firm only has a small degree of market power
product differentiation, through advertising and branding
very low barriers to entry and exit, so any firm is free to set up in the market and compete with the existing monopolistically competitive firms
Profit maximization
In economics, it is assumed that produces act rationally by seeking to maximize profit
Profit maximization occurs when the positive difference between TR and TC is at its greatest
For market power, we assume that profit maximization occurs when MC=MR
Total Revenue (TR)
the overall amount of money received by a firm from selling its output of goods and/or services.
For example, Nike and Adidas receive most of their revenues from the sale of sports apparel and sports equipment
Calculated using the formula TR= P x Q, where P= price, Q= quantity sold
Costs
the expenditures of a firm incurred in the production process. Costs can be classified as either fixed or variable:
Fixed costs are expenses that do not change with the level of output, such as rent, salaries and loan interest repayments
Variable costs are expenses that change with the level of output, such as raw material costs and wages.
Total costs (TC)
the aggregate amount of production costs spent on the output of a particular good or serrvice
TC + TFC + TVC, where TFC= total fixed costs, TVC= total variable costs
Marginal revenue (MR)
the additional revenue received from the sale of an extra unit of output
It is calculated by dividing the change in total revenue by the change in the quantity of output
MR= change in TR / change in Q
Marginal cost (MC)
the additional cost of producing an extra unit of output
It is calculated by dividing the change in total costs by the change in the quantity of output
MC= change in TC / change in Q
Why is profit maximizing condition at MC = MR?
When MR > MC, the change in total revenue is greater than the change in total costs, so the firm can increase its output to gain more profit
When MC > MR, the change in total costs is greater than the change in total revenue, so the firm should reduce its output to minimize loss
Therefore, when MC = MR there is no change in profits, that is, this is the level of output where profit is maximized
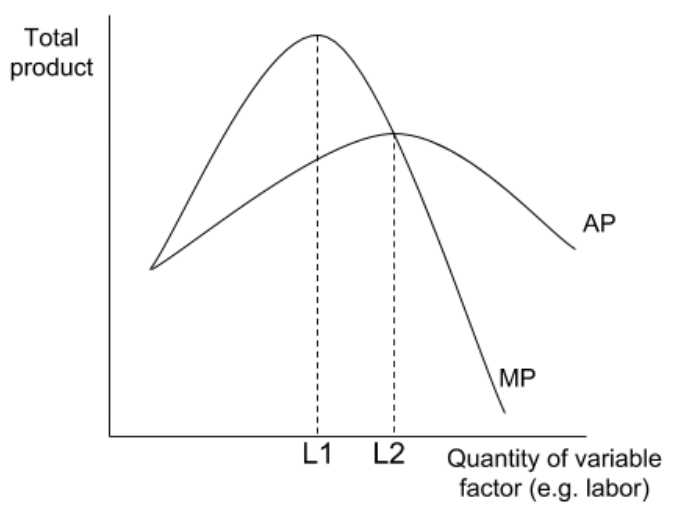
Law of diminishing returns
as more of a variable factor (of production) is added to a fixed factor (of production) the additional to total output will eventually begin to decline.
Total product – total quantity of goods or services produced with given inputs. This simply means the total output being produced.
Average product (AP) – quantity of goods or services produced per some quantity of input. Normally, we choose to calculate the average product of labour: divide the total quantity by the number of workers.
Marginal product (MP) – the additional quantity added to total product as one more unit of a factor is added. For example, a pizzeria adds one more cook and their total quantity of pizzas produced increases by 50, the marginal product of that additional worker is 50.
Law of diminishing utility
which means that as a person receives more of a good, the additional (or marginal) utility from each additional unit of the good declines.
In other words, the first slice of pizza brings more satisfaction than the sixth.
Abnormal profit
refers to the profit of a firm that is over and above its normal profit (AR > AC). Note that economists include implicit/opportunity costs when calculating profit.
Excess of the amount needed to generate a return on the firms investment
Average revenue (AR)
refers to the median price recieved from the sale of a good or service.
AR= TR/Q= P
Average cost (AC)
the cost per unit production
AC= TC/Q
Normal profit
the minimum amount of profit needed to keep a firm in business. Hence, it is also referred to as zero economic profit and occurs at the point where a firm breaks even by covering both economic and implicit costs from its total revenue.
Normal profit= AR = AC
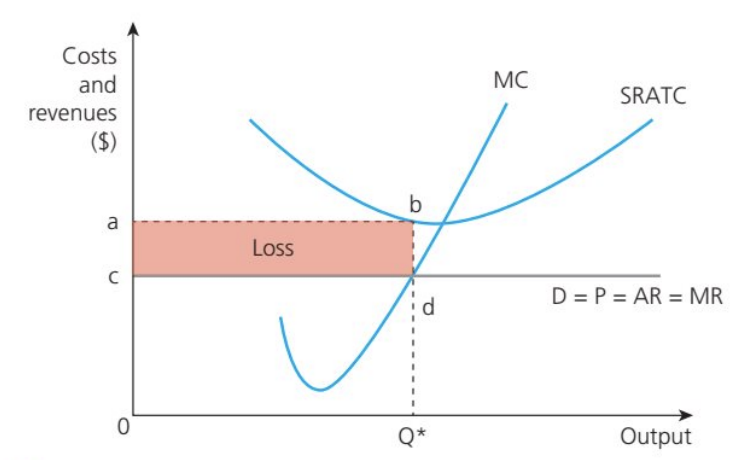
Losses
if production costs exceed total revenue
Loss= AC > AR or TC >TR
This is because the firm’s price (average revenue) is not sufficient to cover its unit costs of production (average costs)
While it is possible for a loss-making firm to remain operational in the short run, this is not sustainable. Firms need to pay their suppliers, workers and financiers so much earn at least normal profit in order to continue operating in the long run
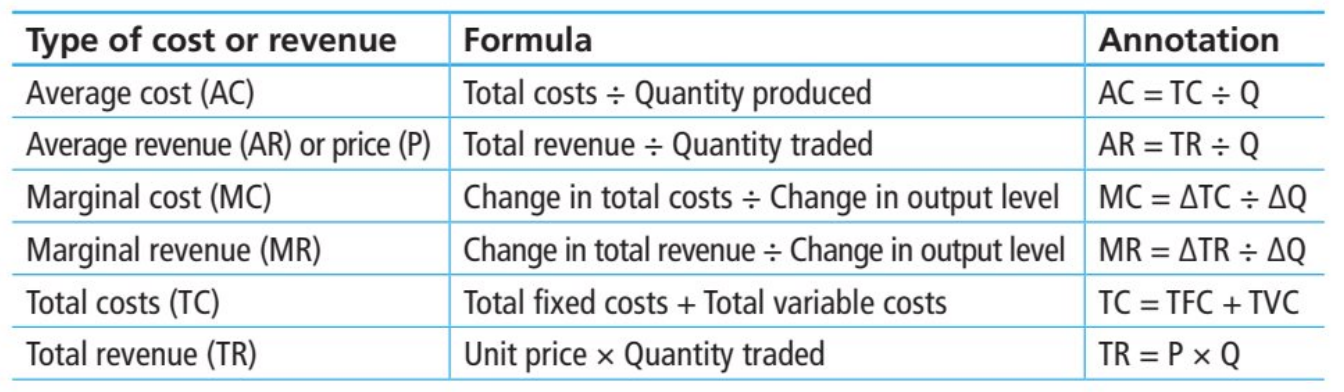
Summary of costs and revenues formulae
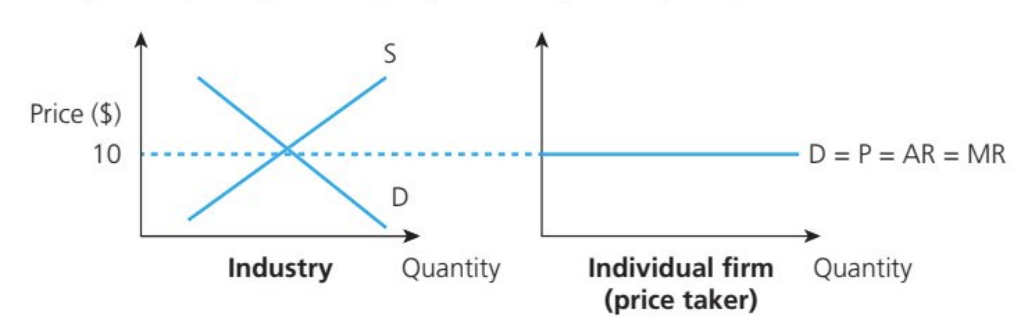
Why are perfectly competitive firms price takers?
extremely high degree of competition with no individual firm being large enough to have any market power to influence the price or the quantity traded
The selling price is determined by the market forces of demand and supply, creating a market equilibrium price that the firm then sells at.
For perfectly competitive firms, the AR and the MR curve are equal as they receive the same price for each successive unit of output, that is AR = MR
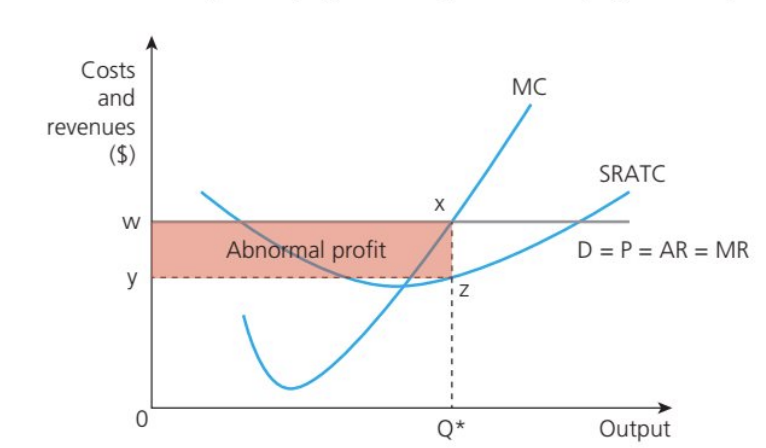
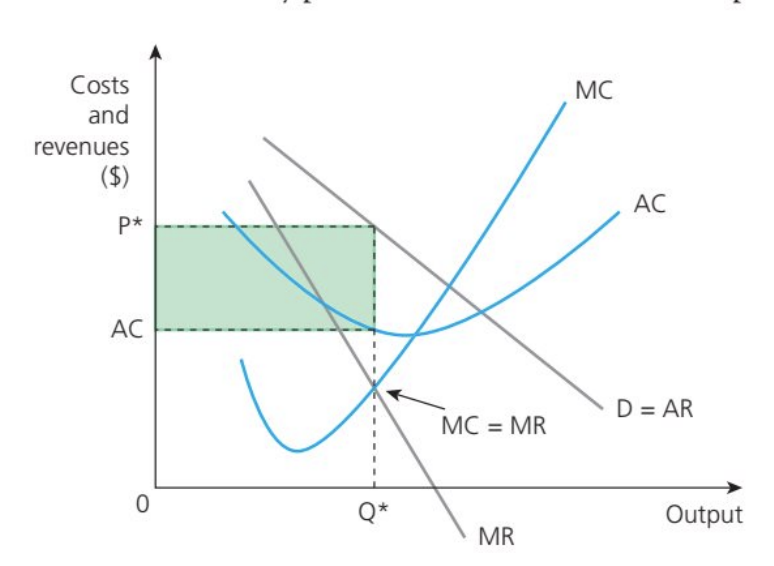
Perfectly competitive firms earning abnormal profits (Short run)
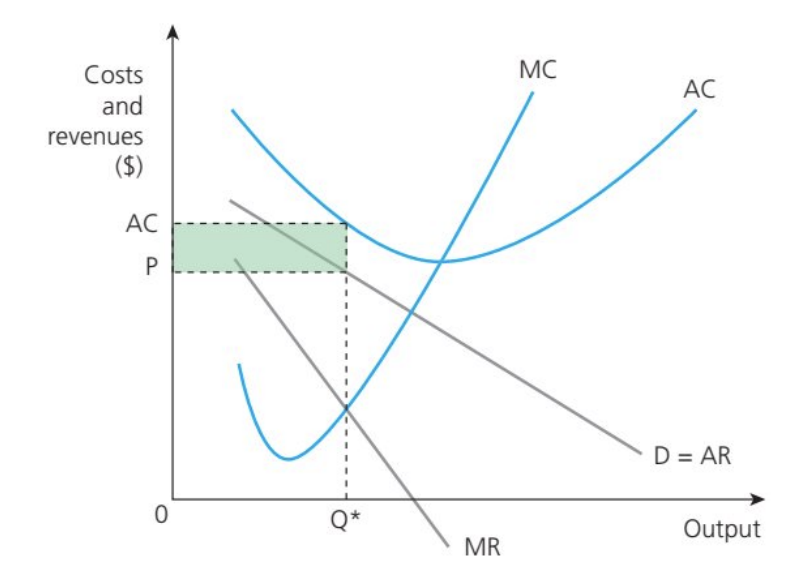
Perfectly competitive firms earning losses (short run)
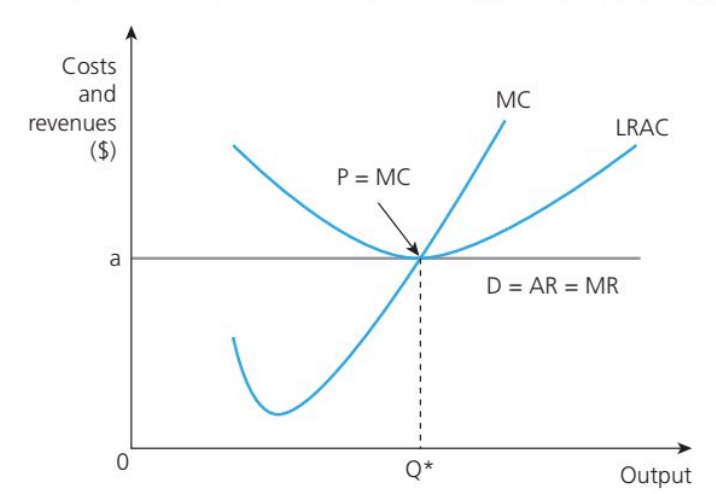
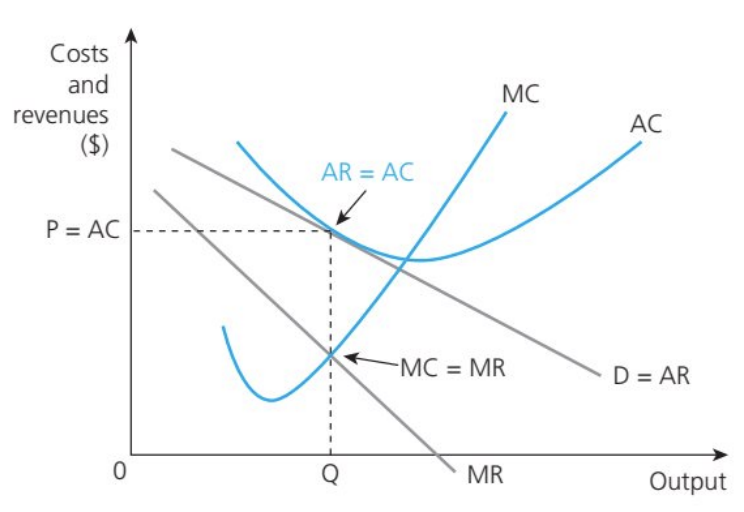
perfectly competitive firms making normal profit (long run)
At Q*, where MC=MR, AR= AC. Hence, firms earn normal profit.
Owing to free entry and exit in the industry (due to no B2E), losses cause firms to exit and price to rise subsequently until normal profits are resumed
Abnormal profit would attract new entrants, thereby reducing the market price until AR= AC where normal profit is earned
Allocative efficiency
Where P= MC
refers to making the best use of an economy’s scarce resources, thereby minimizing or eliminating waste.
Hence, social welfare is maximized if allocative efficiency is achieved, that is, community surplus (the sum of consumer surplus and producer surplus) is maximized
The price that consumers are willing and able to pay matches that of the producer, so it is not possible to reallocate resources in order to make only party better off without making the other party worse off.
What is the only market power that displays allocative efficiency?
Perfectly competitive firms are the only firms that display allocative efficiency (P=MC), while simultaneously being able to profit maximize (MC= MR)
Monopoly diagram (making abnormal profits)
have a downwards sloping demand (D= AR) curve. As there is a single supplier, the firm is the industry so the monopolist must reduce price in order to sell more output
a rational monopolist is assumed to operate at MC=MR
Unlike in perfect competition, a monopolist enjoys market power, so its price is set higher than the marginal costs of production (AR=P > MC), enabling the firm to enjoy abnormal profit in the short and long run.
This is also possible to its extreme barriers to entry and exit
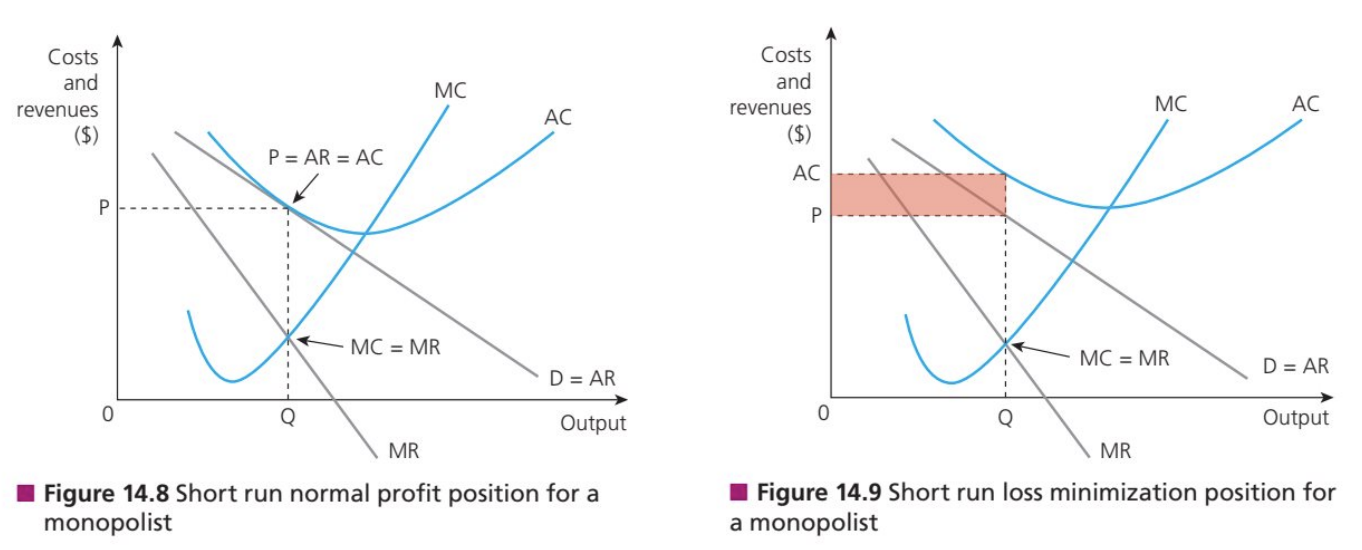
Short run normal profit and short run loss for a monopoly
A monopolist might earn zero eocnomic profit if the monopolist sets the price low enough to intentionally deter potential entrants to the market
the monopolist can make losses in the short run if it deliberately sets the price below unit costs of production, that is AC > P. This is likely due to anti-competitive behaviour to prevent new firms from entering the market
However, the nature of the high barriers to entry and exit means it is assumed that the profit-maximizing monopolist will raise its price above its average cost in the long urn, so that P = AR > MC, and AR > AC.
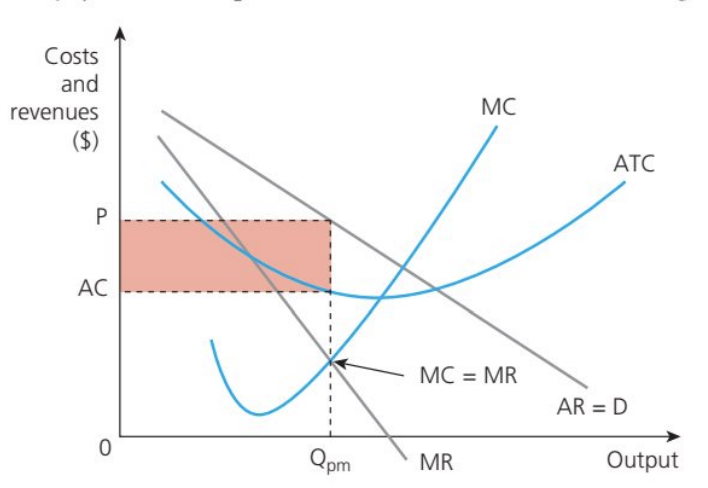
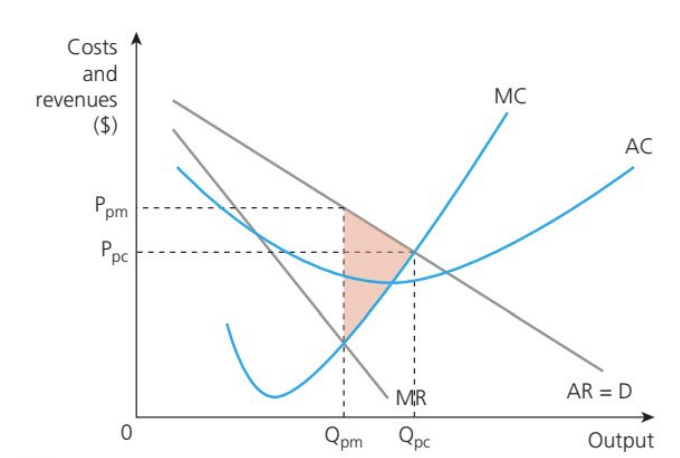
Allocative inefficiency (market failure) and welfare loss in a monopoly
Unlike perfectly competitive firms, monopolies will not achieve allocative efficiency.
lack incentive or competitive pressure to operate at the lowest point of the AC curve (when MC= AC). Instead, the firm limits market supply to Qpm, enabling it to charge a higher price than would be the case in a perfectly competitive market.
The lack of competition in the market means that P > MC at the profit-maximizing level of output (MC=MR).
The resulting welfare loss (consumer + producer surplus) is shown by the shaded area. Hence, monopoly is an inefficient market structure
Natural monopoly
exists when the industry can sustain only one supplier to avoid wasteful competition and to maximize economies of scale by having a single provider.
exist in industries that have extremely high set-up costs, fixed costs and sunk costs (recoverable costs) required to ensure the supply of a good or service. Hence, these costs can deter firms from entering the industry.
For example, it is more economical to have a single supplier of postal services, gas pipes, telephone cables, electricity cables, and railway tracks as a monopolist, which can provide these with substantial cost savings compared with many smaller firms in direct competition with each other.
Hence, trying to increase competition in such industries actually creates a potential loss of allocative efficiency because allowing competition would mean a wasteful duplication of resources
Have the financial ability to invest in R&D, encouraging innovating, expand productive capacity, improve international competitiveness of the economy.
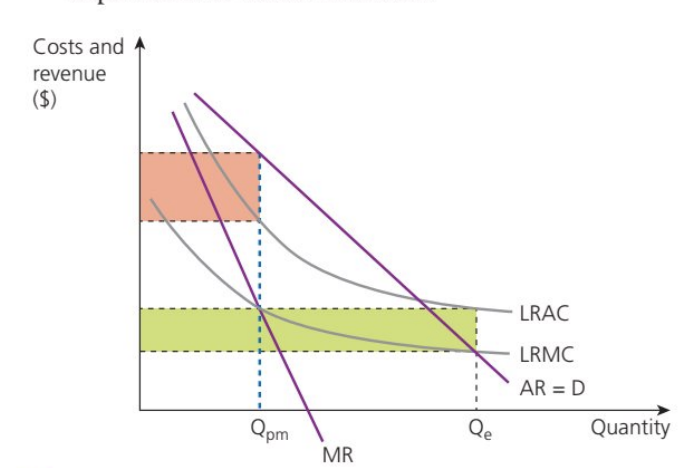
Natural monopoly diagram
The unregulated profit-maximizing monopolist will supply at Qpm, where MC=MR, thus earning abnormal profit (as indicated by the pink area)
The monopolist can achieve huge cost savings by operating at a larger scale along its LRAC curve, supplying Qe output where P= MC, indicating allocative efficiency. However, the firm will make a loss (shown by the green area). The loss can be subsidized by the government to encourage production.
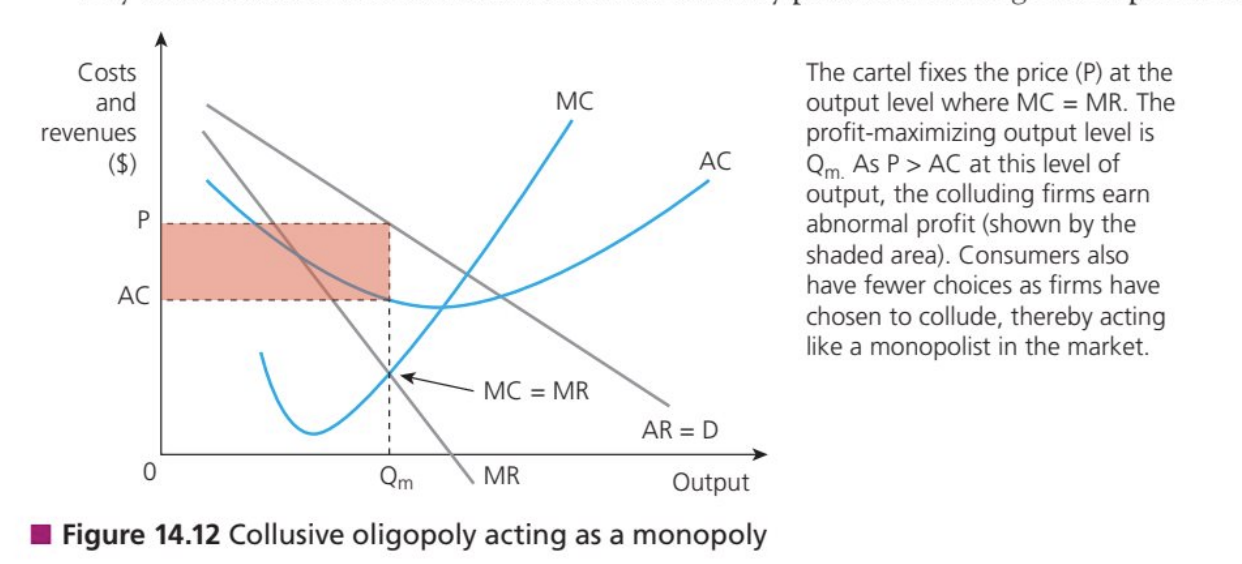
Collusion
The agreement between two or more oligopolistic firms to limit competition by restrictive trade practices, such as price fixing or collectively limiting output, in order to manipulate the market price
Why is there an incentive to collude for oligopolies?
comes from the potential to earn abnormal profits by restricting supply, thereby forcing up the market price and creating artificial barriers to entry, which prevents firms from entering the industry
what are oligopolistic firms called that collude?
cartels
why is identifying cartels difficult?
identifying and breaking up cartels can be challenging as it is often difficult to prove price fixing, especially in the case of tactic collusion rather than open collusion.
What is required for collusion to be effective?
mutual trust within the group of colluding firms
high barriers to entry to prevent potential entrants from competing in the industry
more homogenized products than differentiated
Why do cartels tend to collapse?
as individual firms have a tendency to cheat (lower their price and/or increase output) in order to improve their own profits at the expense of rival firms in the industry.
Non-collusive oligopoly (competitive oligopoly)
exists where firms in the industry compete independently, considering the likely or possible actions of their rivals, that is, there is mutual interdependence.
embark on particular strategies (price and non-price factors) without conspiring with its competitors, yet each firm needs to consider the possible reactions and strategies of its competitors due to their high degree of market power.
Features of firms operating in a competitive oligopoly
Interdependence- consider the decisions and behaviours of their competitors when determining price/non-price strategies, because of each firm’s high market power and the intensity of competition within the industry
Risk of price wars- competition can lead to firms continually reducing their prices in an attempt to gain a competitive advantage by enticing consumers to switch brands. However, price wars tend to be short-lived as it is not in the best interest of firms to continually reduce prices
Incentives to collude- In theory, it can be beneficial for oligopolistic firms to collude and operate as a joint monopoly, so all firms can raise their prices. However, the anti-competitive practices of cartels mean that collusion is illegal in most countries
Incentives to cheat- Despite the probable gains from forming a collusive oligopoly, there are motivations for firms to ‘cheat’ (break away from the agreements of collusion) as they act in their own self-interest at the expense of their competitors.
Allocative inefficiency in oligopolies
allocatively inefficient market structure because firms have the market power to be able to charge more for their product than the marginal cost of production, that is, P = AR > MC
If the industry were exposed to a greater degree of competition, the market would be able to supply more and charge customers a lower price
The existence of market power and asymmetric information causes market failures in the allocation of resources in oligopolistic markets. The suboptimal output and anti-competitive behaviour of firms in the industry contribute to allocative inefficiency.
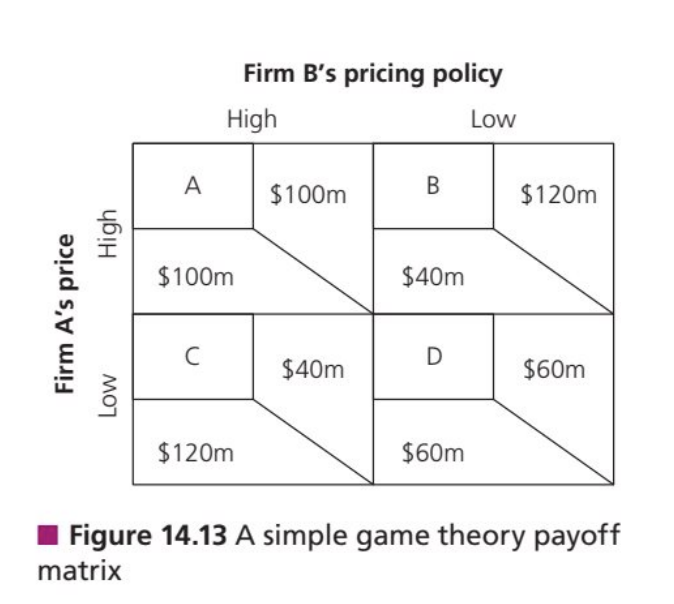
Game theory
An economic model that attempts to explain the nature of interdependence in oligopolistic markets.
considers the actions and behaviours of competitors when making decisions, based on various probable outcomes
It shows that oligopolistic firms can increase their profits through collusion rather than competing independently, although this hinges on symmetrical information. However, the tendency for rival oligopolistic firms to cheat results in a suboptimal outcome for all firms.
A low-price strategy is the optimal strategy for both firms if they are in direct competition, which would generate the two firms a payoff of $60m each.
However, the matrix shows that if both firms agreed to collude and sold their products at a high price, they would receive a payoff of $100m each
Price competition
the use of pricing strategies to compete in an industry.
setting the prices in line with the average price charged by other firms in the industry
setting the price of a product below its cost in an attempt to encourage the customers of rivals to switch
setting a low introductory price for new products to help establish market share
charging a low price to attract customers, raise brand awareness and develop customer loyalty
offering discounts for customers that bulk buy
price rigidity in oligopolistic markets
due to high degrees of market power of rival oligopolists, there is price stability in non-collusive markets, simply because competitors would simply retaliate by matching any price cuts. By contrast, firms would not necessarily follow an increase in price in order to gain a competitive price advantage.
non-price competition
refers to all other forms of competition. as oligopolistic firms can produce differentiated products, non-price competition is a key feature in such markets. Examples include:
advertising used extensively to differentiate between the products of competing firms
branding used in an attempt to gain awareness and customer loyalty
packaging used to distinguish products from rival products and to act as a distinctive selling point
product development such as special features and limited editions of a product or launching innovative products on the market
the quality of service can also give firms a competitive advantage over their oligopolistic rivals
Market concentration
measures the extent to which sales revenue in an industry is dominated by one or more of the largest firms, that is, the significance of the market share of firms.
It is indicative of the degree of market power of these firms in the industry
A concentration ratio
used to measure the degree of market power in an industry by adding the combined market shares of the largest few firms in the market.
the most common method is the Herfindahl-Hirschman Index (HHI)
the Herfindahl-Hirshman Index (HHI)
a method which gives a larger weighting to the market share of larger firms by squaring the value of their market share
hence, the higher HHI number (for a pure monopoly) is 10,000 as the firm has 100% market share
The higher the HHI, the more concentrated (less competitive) the industry will be
Short run abnormal profit for monopolistic firms
The firm operates at Q*, where MC = MR. At this output level, AR = P > AC, so the firm earns abnormal profit (shown by the shaded area). However, in the long run, the absence of barriers to entry means new firms enter the contestable market, attracted by the prospect of abnormal profit. The subsequent increase in supply simply reduces the market price until AR = P = AC, thereby reverting all firms to a position of normal profit.
Short run losses in monopolistic competition
Alternatively, the firm could be in a loss-making position in the short run. Here, the profit-maximizing firm operates at Q* but AC > P. The loss will cause firms to exit the industry, thereby reducing the market supply and subsequently raising the market price until AR = P = AC, that is, the industry returns to a position of normal profit in the long run.
Long run normal profit for monopolistic firms
The nature of free entry to and exit from the industry means firms will earn normal
profit in the long run as AR = P = AC. Monopolistically competitive firms are unable to earn abnormal profit because firms have minimal market power due to the availability of many substitutes in the industry.
Key elements of a market structure diagram
The MC curve intersects the AC curve at its minimum point
the gradient of the MR line is twice that of the AR line
the D= AR for a monopolistically competitive firm is more price elastic than that for a monopolist
the profit-maximizing firm operates at the level of output where MC = MR
Allocative inefficiency in monopolistic competition
Monopolistically competitive firms are not allocatively efficient in the short or long run.
They are unable to operate at the lowest point on the AC curve (where P=MC=AC) as there are limited opportunities for these firms to exploit economies of scale (struggle to get the demand needed to achieve such cost savings)
Inefficiencies mean that consumers are deprived of access to a larger volume of output at a lower price
Inefficiencies also arise with mass differentiated products, as this information overload and misinformation can be inefficient, which can lead to market failure
Benefits of large firms having significant market power
Economies of scale
Abnormal profits
Economies of scale
refer to cost-saving benefits from lower average costs of production due to an increase in the quantity of production. They can be categorized as internal or external.
Internal economies of scale
lower average costs brought about by an increase in the size of the firm itself, such as through specialization and the division of labour (which lead to increased productivity) and efficiency gains.
External economies of scale
the cost-saving benefits from lower average costs due to an increase in the size of the industry in which the firm operates. Hence, all firms in the industry benefit, such as improved infrastructure in the local area.
Why are abnormal profits ideal for large firms?
help finance investment in R&D and hence innovation
help large firms maintain their power in the long run
Risks in markets dominated by one or a few very large firms
Risks in terms of output- A lack of competition means that profit-maximizing monopolists are likely to supply less output than the social optimum, resulting in allocative inefficiency. This results in market failure due to under-provision and under-consumption.
Risk in terms of price- Firms with significant market power are able to charge different customers different prices for essentially the same product owing to differences in their price elasticity of demand. Essentially, this enables the dominant firm to charge higher prices due to the lack of competition
Risks in terms of consumer choice- The lack of competition and the nature of barriers to entry can also lead to a lack of incentives for a dominant firm to innovate and to provide choice for consumers.
Government intervention in response to abuse of significant market power
Legislation and regulation- these are laws and policies are used to control firms with significant market power. Mergers and takeovers can be blocked if the authorities deem these to be anti-competitive. Governments can also use policies to make certain markets more contestable
Government ownership (nationalization)- nationalization of an industry can help ensure the firm is not run primarily for profit, but to provide an important service to the general public. However, the purchase of privately owned assets or industries by a government can be extremely expensive and comes at a large opportunity cost.
Fines- Financial penalties issued by governments for law infringements, usually accounting for a significant portion of their abnormal profits.
Examples of legislation and regulation against abuse of significant market power
The Microsoft Antitrust Case (1998-2001) is a well-known example where U.S. courts ruled that Microsoft had abused its monopoly power by bundling Internet Explorer with Windows, stifling competition.
In the EU, Google has faced multiple antitrust fines, including a €4.34 billion ($5 billion) fine in 2018 for abusing its Android market dominance.
Examples of nationalization in response to abuse of significant market power
The nationalization of banks during the 2008 Financial Crisis saw governments in the U.S. and Europe take control of failing institutions like Royal Bank of Scotland (RBS) to prevent economic collapse.
Another example is France’s EDF (Électricité de France), which remains state-owned to ensure stable energy supply.
Example of fines in response to abuse of significant market power
Google was fined €1.49 billion ($1.66 billion) by the EU for abusing its dominant position in online advertising.
Another example is the Volkswagen Dieselgate scandal (2015), where the company was fined over $30 billion globally for emissions cheating.