Module 3: Bivariate Data
1/30
There's no tags or description
Looks like no tags are added yet.
Name | Mastery | Learn | Test | Matching | Spaced |
|---|
No study sessions yet.
31 Terms
What is bivariate data?
2 variables measured on the same experimental unit that come in data pairs (1 pair/experimental unit)
Data pair is collected independently without bias
How can bivariate data occur? (3 different ways)
2 qualitative variables (ex: gender and major of college students)
1 qualitative and 1 quantitative (ex: gender and height)
2 quantitative variables (ex: height and shoe size)
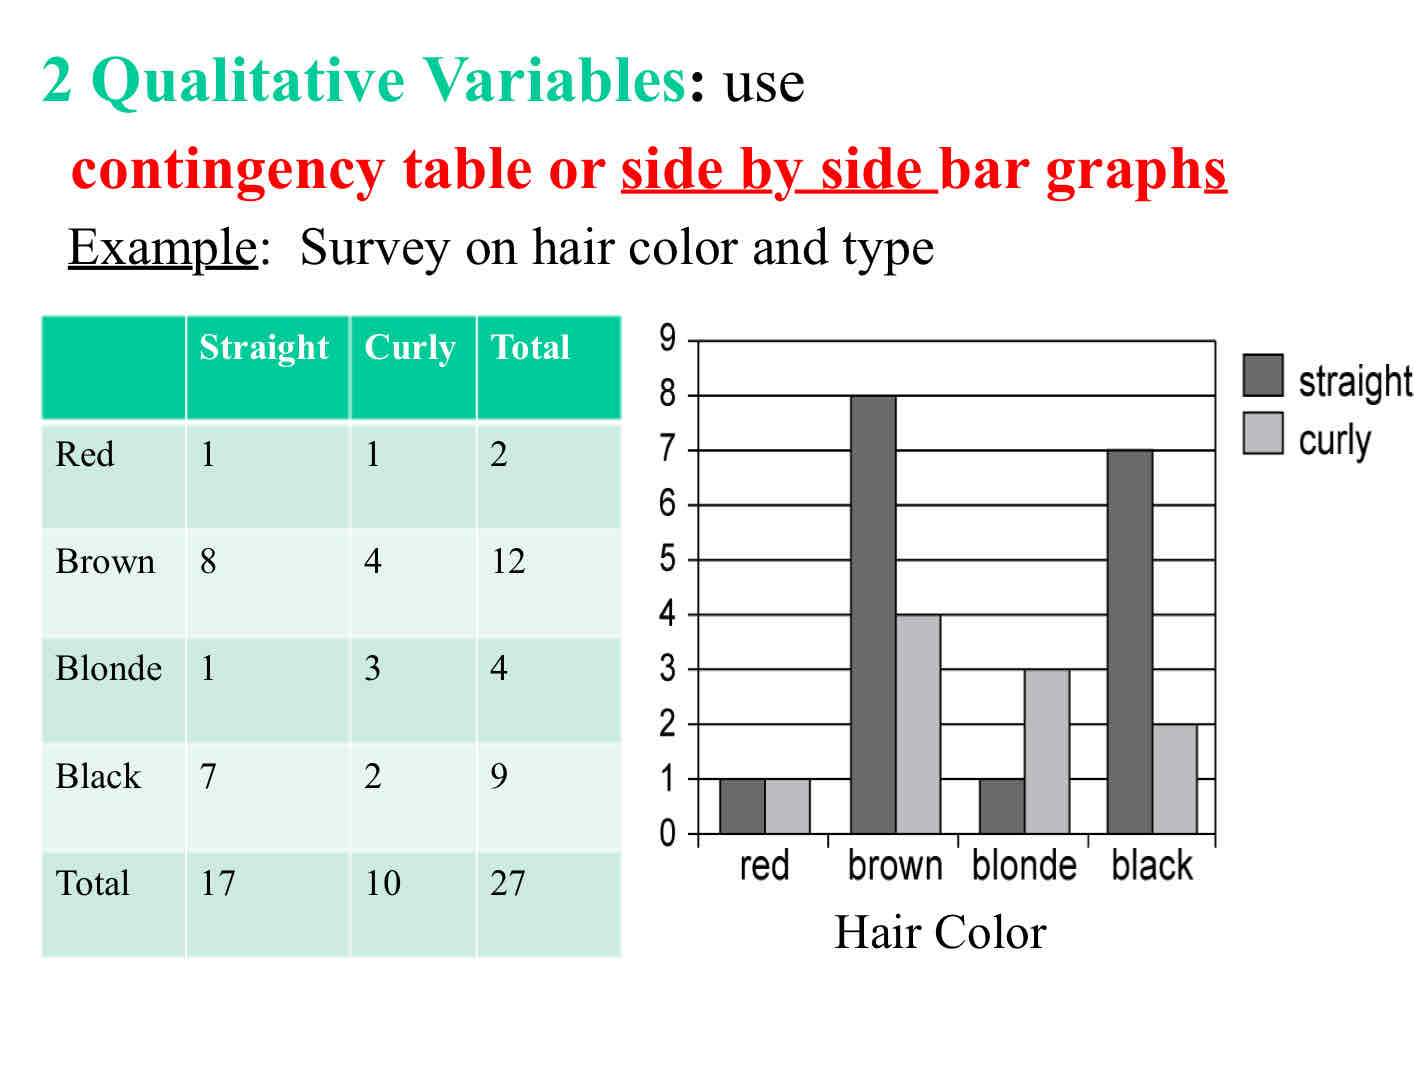
How is data involving 2 qualitative variables showcased?
Involves the usage of contingency table or side by side bar/circle graphs
Ex: survey on hair color and type
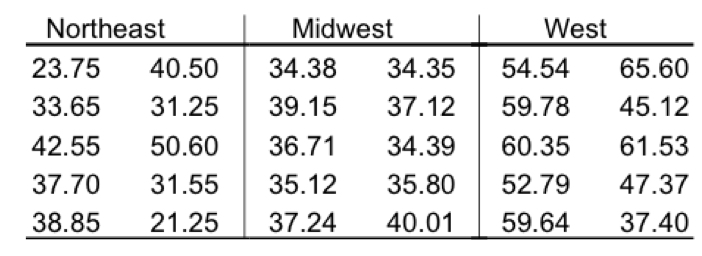
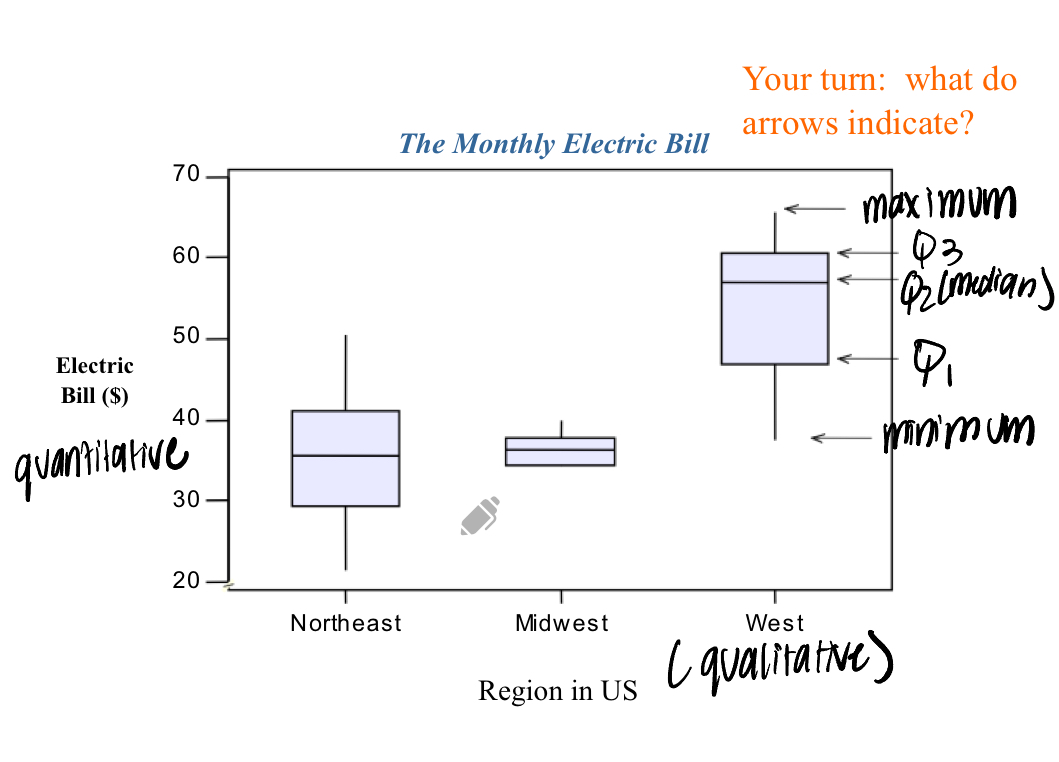
How is data involving 1 quantitative and 1 qualitative variable showcased?
Ex: region vs electric bill
Involves the use of side by side box and whisker graphs to display data
Shows measures of center and spread for each qualitative outcome
Multiple stem and leaf plots or multiple frequency histograms can also be used
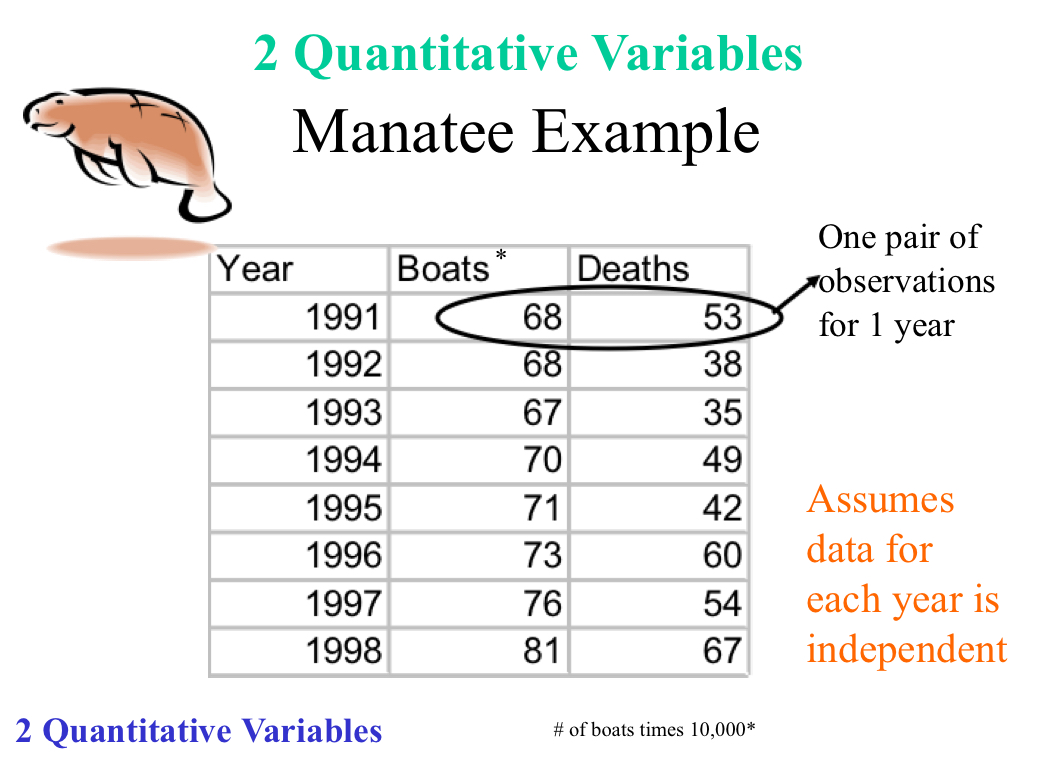
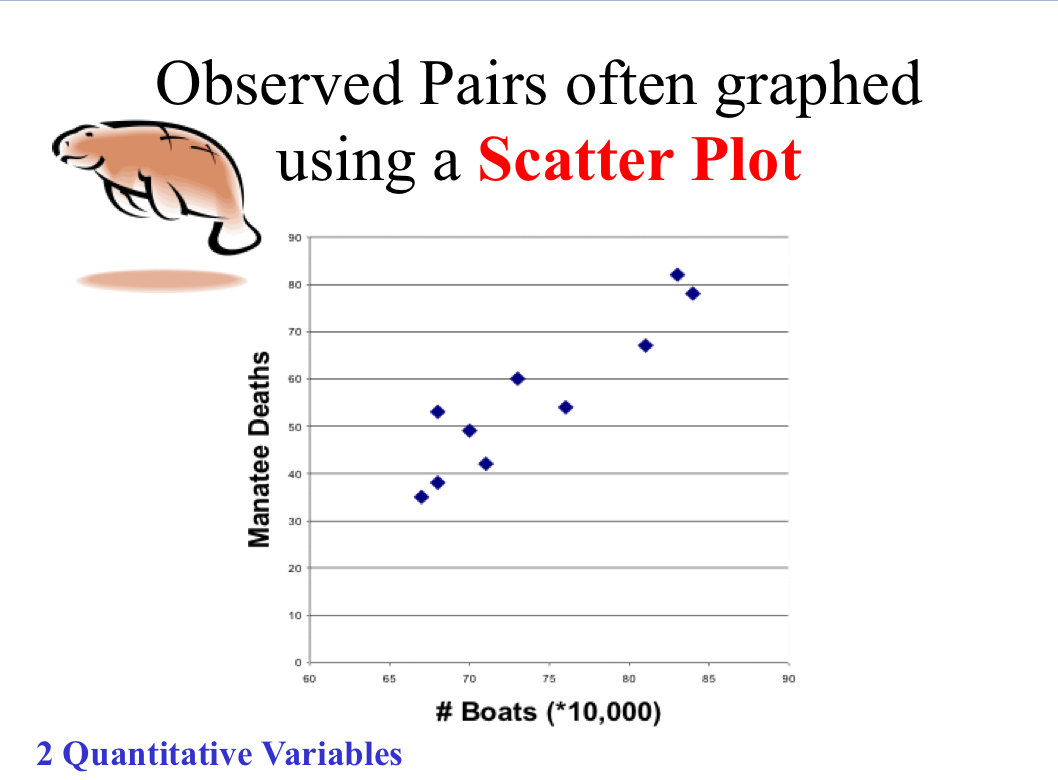
How is data involving 2 quantitative variables showcased?
Ex: Manatee deaths and # of boats per year
Involves a scatter plot with data points
A data point represents two values (x and y variables)
How are 2 quantitative variables analyzed?
Using Correlation and Regression
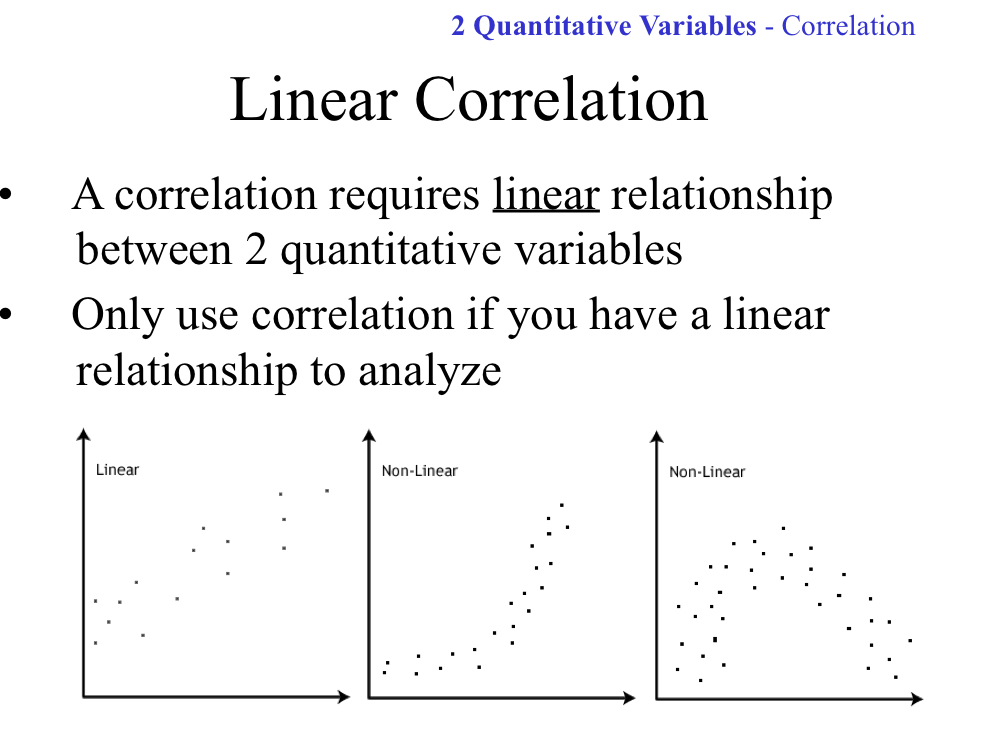
Linear Correlation
Requires a linear relationship between 2 quantitative variables
ONLY used if there is a linear relationship to analyze
Variables are interchangeable so if they are switched then the r will be constant
Correlation Coefficient
Sample statistic coefficient is r
Measures the direction and strength of a linear relationship between 2 variables
Values vary from -1 to +1
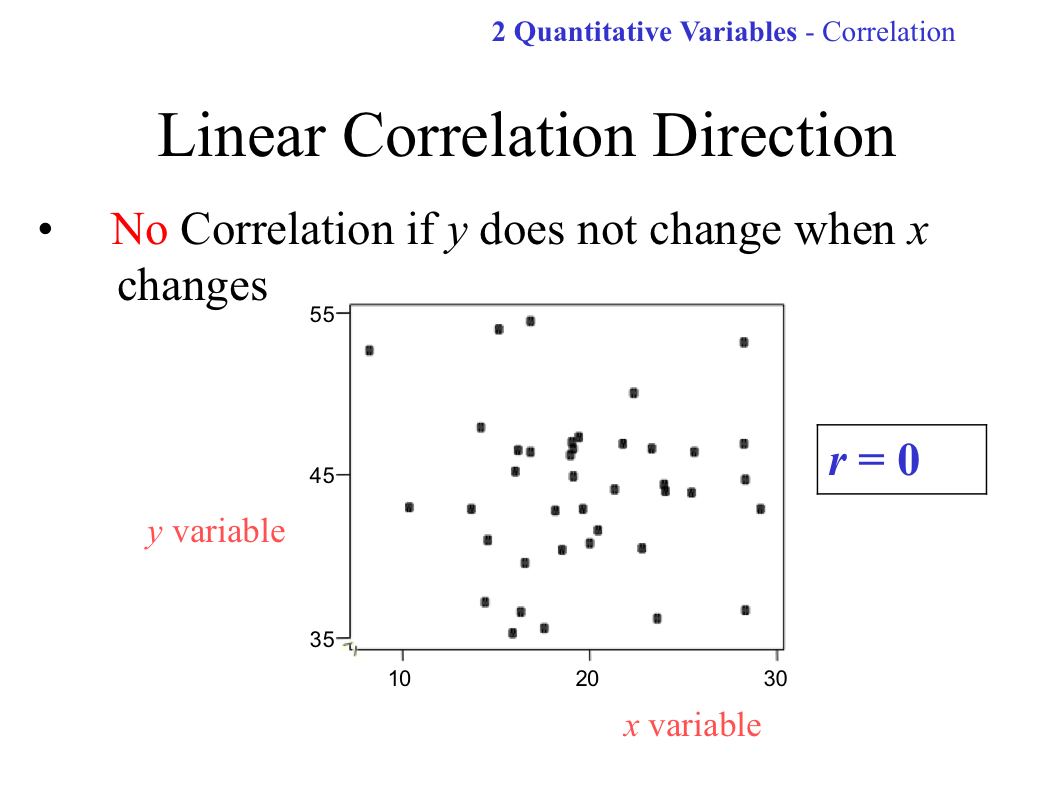
Linear Correlation Direction: No correlation
Can be a scatter, r=0
Indicates that there is no linear relationship between x and y
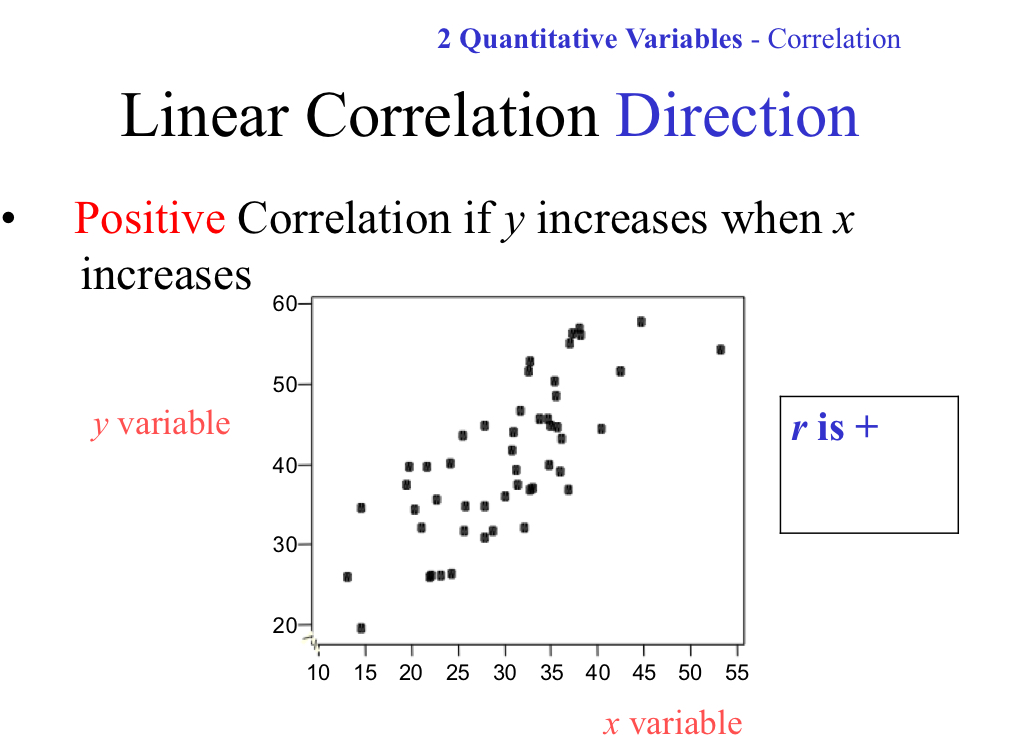
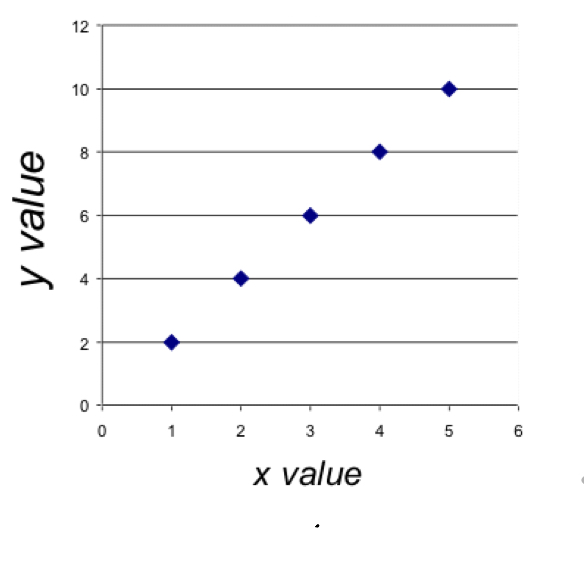
Linear Correlation Direction: Positive Correlation
When y variable increases, the x variable also increases
r is a positive value that is greater than 0 and less than 1
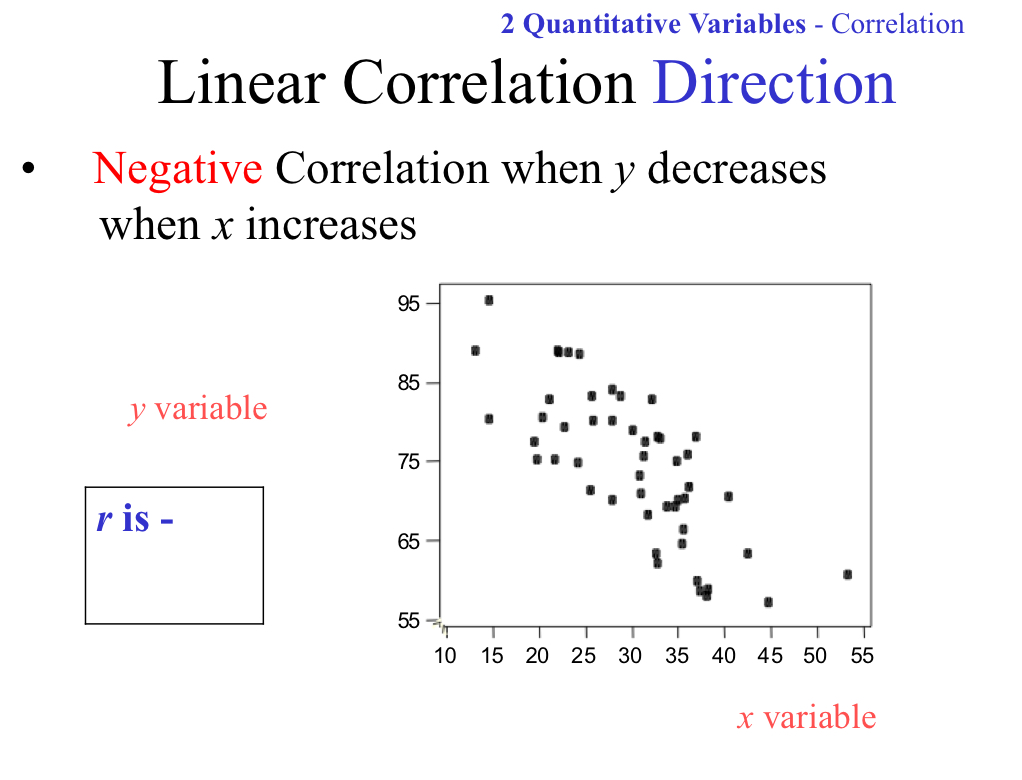
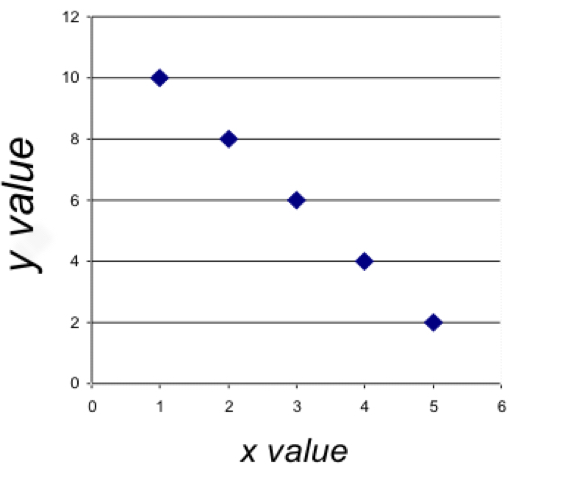
Linear Correlation Direction: Negative Correlation
When the y variable decreases, the x variable increases
r is a negative value that is greater than -1 and less than 0
Linear Correlation Strength : r= +1
Perfect positive correlation
Linear Correlation Strength: r= -1
Perfect negative correlation
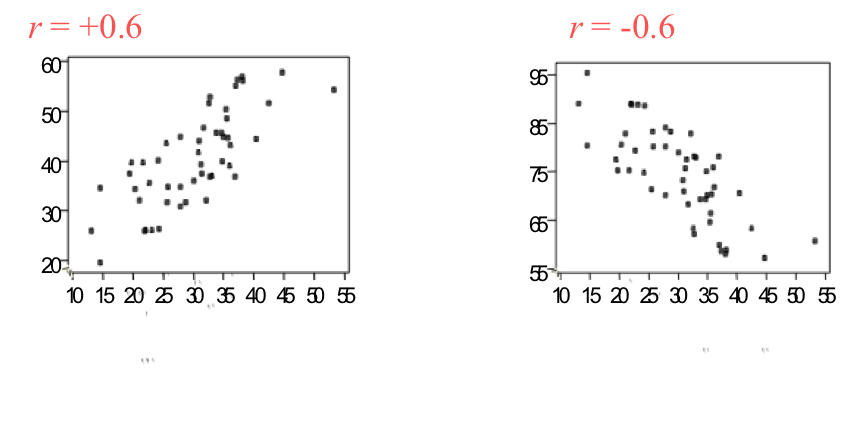
Linear Correlation Strength: r value between -1 and 0 and +1
Intermediate Relationship
Typically values from -0.3 and 0 and +0.3 represents a weak or nonexistent relationship between the variables
Example correlation problem : Researchers at Johns Hopkins recently discovered a correlation between dietary fiber in the diet and colon health. People on a high fiber diet have a lower risk of cancer. Is this a negative or positive correlation?
Negative
The x value is increasing while the y value is decreasing
How can r=0 occur? (3 ways)
A) no trend in data (scattered data plots)
B) as the x variable changes and y stays the same (horizontal line) or the y variable changes and the x stays the same (vertical line)
C) There is a relationship but it is not linear (ex: pyramid line)
A relationship can be missed if it is nonlinear so it should not be analyzed using correlation
Correlation Concerns: Part One
A) Check for nonlinear relationships
If there is a nonlinear pattern, the data may be able to fit a nonlinear model then be analyzed using correlation afterwards
B) Check for Outliers
Can move r closer to +1 or 0
Need a justification to remove valid data from a dataset
C) Correlation is not causation
Most correlations are done on survey data which cannot determine cause and effect
Correlation Problems: Part 2
D) Third Variable Problem
A factor that is not evaluated but does impact 2 variables that are measured
F) Do not extrapolate beyond data set
Do not draw conclusions based on information outside of recorded data
Correct Terminology for Correlation
Correlation explains how X and Y are associated
Terms related with correlation:
Tends to
Linked
Connected
Tied to
Associated
Reporting Correlations
Graphs should include:
Title
Clearly labeled axes
No Regression Line
Statistical Results
Difference between Correlation and Regression
Correlation: asks if 2 variables vary together
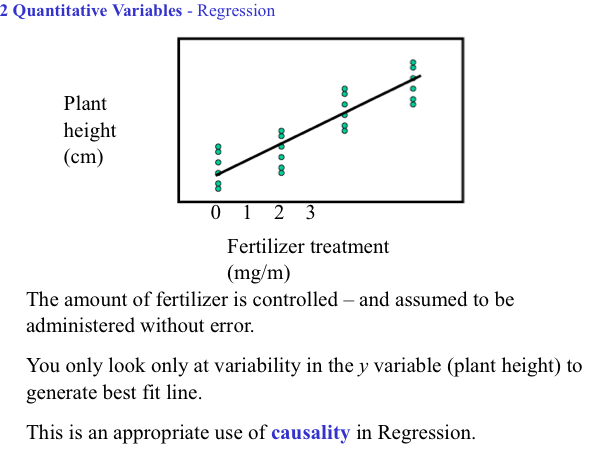
Regression: asks if changes in one variable causes or predicts changes in another variable
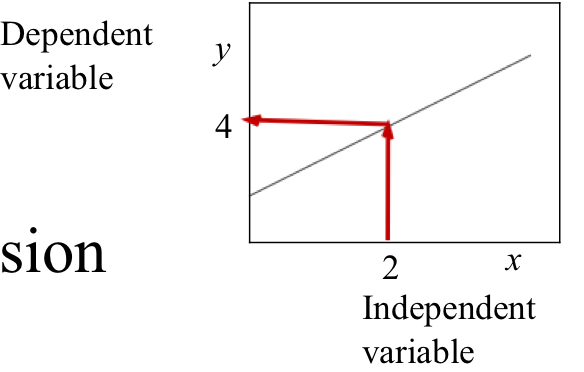
Linear Regression
Predicts a value for y (output/dependent variable) given an x value (input/independent variable)
Ex: mouse growth (gm) is dependent on amount of food given (gm)
Minimizes the variability in the y direction and generates the best fit regression line
Regression: Best Fit Line
Determines the Best Fit Line to the data
Minimizes deviations between line and actual data points vertically
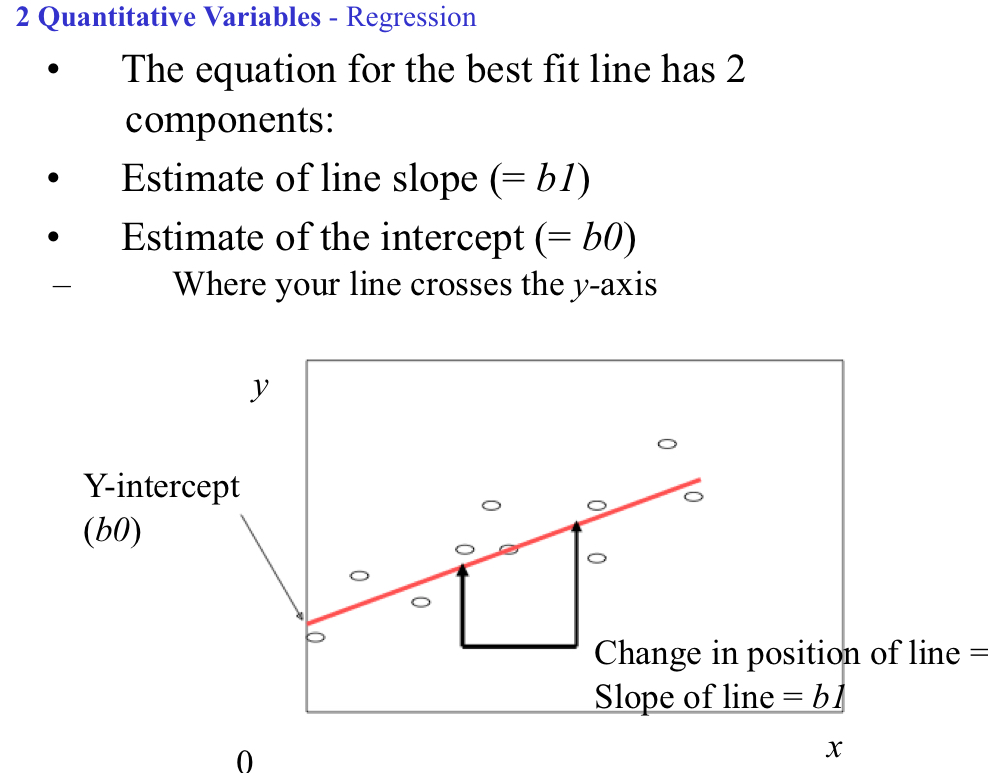
Equation: Y= b0 + b1x
Estimate of line slope= b1
Estimate of the y intercept= b0
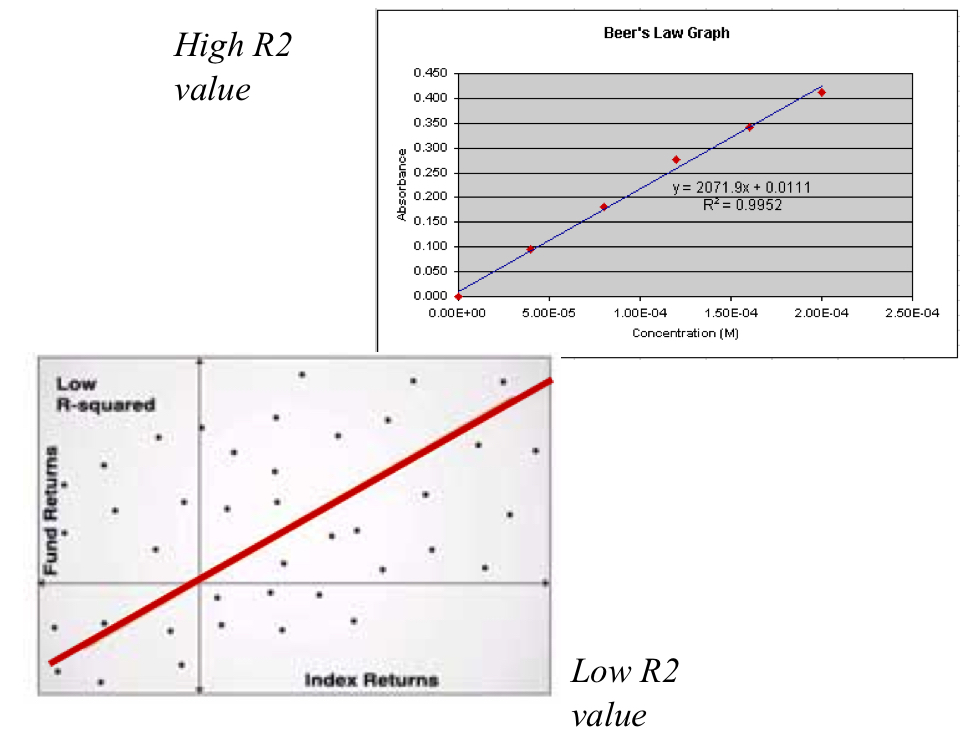
Coefficient of Determination: R2
Measures the amount of variability in the dependent variable (y) explained by the variability in the independent variable (x)
Determines how tight the values are towards the regression line
Varies from 0 to 1
R2=0, no relationship between x and y
R2=1, perfect relationship (ex: straight line for linear regression)
R2 vs r.
r is used for Correlation, gives tightness and direction, values vary from -1 to 0 to +1, can statistically test for relationship between x and y variables
R2 used for Regression, tells tightness (how close points are to the regression line) only, values vary from 0 to 1, not tested statistically
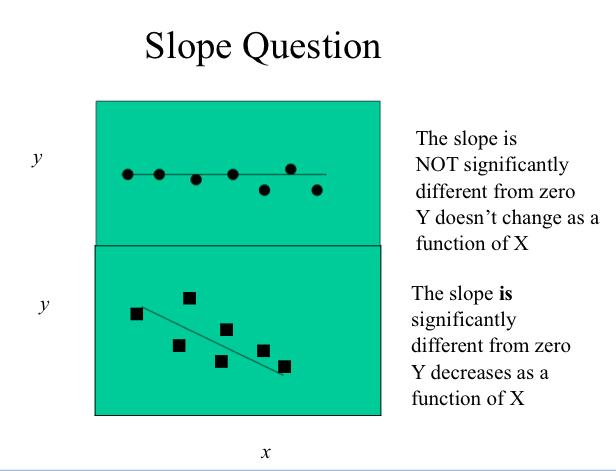
How to test for a relationship for regression?
Ask if the slope of the line (b1) is statistically significantly different from 0
Ask if the intercept (b0) is significantly different from zero
Regression will start at a number far from zero because of intercept
Components for presenting Regression results
Title
Axes labeled units
Line only in the range of data
Equation for line
R2 line
Regression Concerns
Outliers can have a large impact
Never extrapolate beyond range of data
Relationship may be nonlinear, graph data first
Lurking variables if it is survey data
Open to different interpretations
Is it correlation or is it regression?
Correlation looks at the trend of 2 variables while regression asks if the y variable is a function of the x variable
For regression, interpretations depend on if a study is a survey or experiement
Regression: Causality
Can only be shown with controlled experiments
Ex: experiment with 4 levels of fertilizer (0,1,2, and 3 mg/m). 6 plants assigned to each fertilizer treatment, look at how tall they grow in 2 weeks
Regression vs Correlation
Correlation can only be used to compare 2 quantitative variables, can only look at the linear relationship typically using survey data
Regression can include more variables, can deal with curvilinear data, is able to deal with survey and experiment data (causation requires controlled experiment)
Can be used for nonlinear relationships