NURS 360- Exam 2- Statistical Analysis of Quantitative Data & Evaluating Clinical Significance
1/105
There's no tags or description
Looks like no tags are added yet.
Name | Mastery | Learn | Test | Matching | Spaced |
|---|
No study sessions yet.
106 Terms
Purposes of Statistical Analysis in Quantitative Research
To describe the data (e.g., sample characteristics)
To estimate population values
To test hypotheses
To provide evidence regarding measurement properties of quantified variables
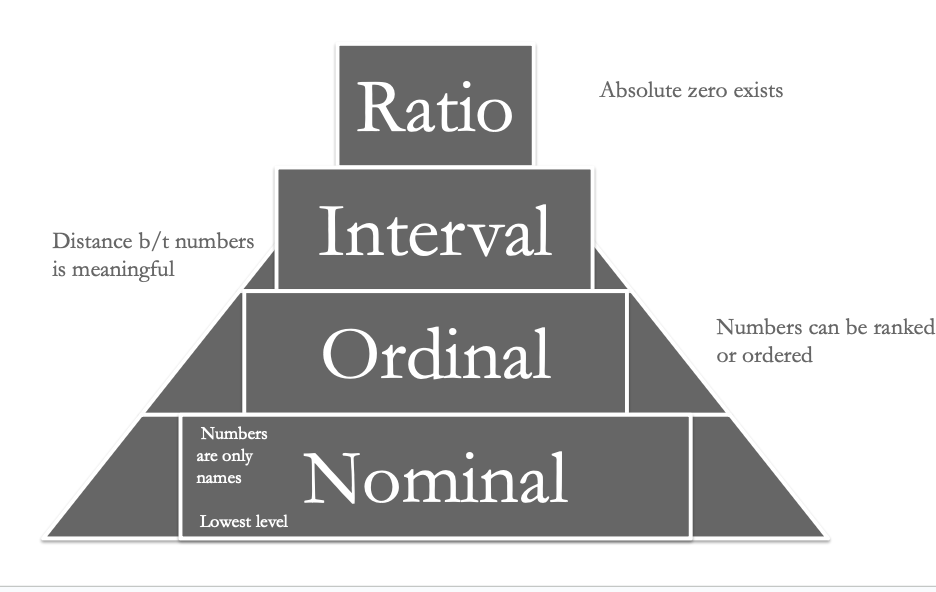
nominal measurement
lowest level; involves using numbers simply to categorize attributes
Names
Lowest level of measurement
Data categorized into groups/categories
Categories should be mutually exclusive
Ex. Male=1 , Female=2, NB=3
ordinal measurements
ranks people on an attribute
2nd lowest level of measurement
Numeric values on continuum but not equal
Ordered and ranked but intervals not equal distance
Ex: Likert scale
Ex: Numeric Pain Scale 0-10
Differences cannot be specified
interval measurement
ranks people on an attribute and specifies the distance between them
3rd level of measurement
Continuum of numeric values where intervals between numbers are equal but lacks a “true zero”
ex. Fahrenheit scale 0 does not = no temperature….
Datum ranked and attributed distance
between are equal
(Equal intervals b/t numbers)
ratio measurements
highest level; ratio scales, unlike interval scales, have a meaningful zero and provide information about the absolute magnitude of the attribute.
Highest level
Numeric values assigned to data
Begin with zero and have = intervals
Ex. Age, # hours studied for a test, many biophysiologic--pulse
Ex. Amount of money in your bank account
0 balance= NO money
levels of measurement
descriptive statistics
Used to describe and synthesize data
Parameters: descriptor for a population
Statistics: descriptive index from a sample
inferential statistics
Used to make inferences about the population based on sample data
Assumes random sampling
frequency distributions
A systematic arrangement of numeric values on a variable from lowest to highest and a count of the number of times (and/or percentage) each value was obtained
Can be presented in a table (Ns and percentages) or graphically (e.g., frequency polygons)
Frequency distributions can be described in terms of:
Shape
Central tendency
Variability
symmetry
symmetric
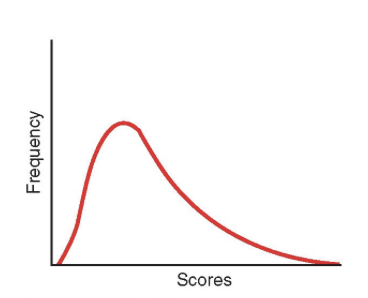
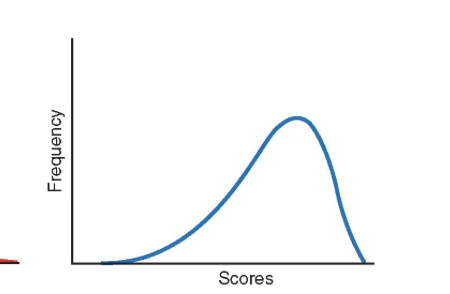
skewed
positive skew
long tail points to the right
negative skew
long tail points to the left
modality
number of peaks
unimodal
1 peak
bimodal
2 peaks
normal distribution (a bell-shaped curve)
multimodal
2 + peaks
mode
the most frequently occurring score in a distribution
Example: 2, 3, 3, 3, 4, 5, 6, 7, 8, 9 Mode = 3
median
the point in a distribution above which and below which 50% of cases fall
Example: 2, 3, 3, 3, 4 | 5, 6, 7, 8, 9 Median = 4.5
mean
equals the sum of all scores divided by the total number of scores
Example: 2, 3, 3, 3, 4, 5, 6, 7, 8, 9 Mean = 5.0
mode
number that occurs most frequently in a distribution
median
useful mainly as descriptor of typical value when distribution is skewed (e.g., household income)
mean
most stable and widely used indicator of central tendency
variability
The degree to which scores in a distribution are spread out or dispersed
homogeneity
little variability
heterogeneity
great variability
range
highest value minus lowest value
standard deviation (SD)
average deviation of scores in a distribution
bivariate description statistics
used for describing the relationship btwn two variables
crosstabs (contingency tables)
correlation coefficients
correlation coefficients
describes intensity and direction of a relationship
Correlation coefficients can range from:
−1.00 to +1.00.
negative relationship (0.00 to -1.00)
One variable increases in value as the other decreases, e.g., amount of exercise and weight.
positive relationship (0.00 to +1.00)
Both variables increase, e.g., calorie consumption and weight.
The greater the absolute value of the coefficient,
the stronger the relationship:
Example: r = −.45 is stronger than r = +.40.
With multiple variables, a _________ can be displayed to show all pairs of correlations.
correlation matrix
Pearson’s r (the product–moment correlation coefficient):
computed with continuous measures
Spearman’s rho:
used for correlations btwn variables measured on an ordinal scale
inferential statics
Used to make objective decisions about population parameters using sample data
standard error of the mean (SEM)
standard deviation of theoretical distribution
theoretical distribution of means for an infinite number of samples drawn from the sample population
Is always normally distributed
Its mean equals the population mean.
Its standard deviation is called the standard error of the mean (SEM).
SEM is estimated from a sample SD and the sample size.
SEM is estimated from:
a sample SD and the sample size
point estimation
a single descriptive statistic that estimates the population value (e.g., a mean, percentage, or OR)
interval estimation
a range of values within which a population value probably lies
Involves computing a confidence interval (CI)
confidence interval (CI)
reflect how much risk of being wrong researchers take.
CIs indicate the upper and lower __________ and the probability that the population value is between those limits.
confidence limits
Hypothesis testing helps researchers to:
make objective decisions about whether results are likely to reflect chance differences or hypothesized effects.
probability
Likelihood or chance that an event will occur in a given situation
how is probability expressed
ower case p with values expressed as per cents
Ex. p=0.34
alpha
evel of significance = probability of making a Type I error
Threshold at which statistical significance reached
Determined prior to data analysis
α (alpha) =
0.05 unless otherwise stated
decision theory
Assumes all groups in a study are components of the same population
To test the assumption of no difference (null hypothesis) a cut-off point is selected prior to analysis
Referred to as level of significance or alpha
Up to researcher to prove there really is a difference
hypothesis testing
Test research hypothesis statistically—disprove null hypothesis
Reject null hypothesis
Significant result
there is a difference between the two groups not as a result of chance
Non-significant result–
any difference or relationship could have been purely chance
If the value of the test statistic indicates that the null hypothesis is improbable, then the result is _______
statistically significant.
A ______ means that any observed difference or relationship could have happened by chance.
nonsignificant result
Type I error
rejection of a null hypothesis when it should not be rejected; a false-positive result
type 1 error
false positive
type 2 error
false negative
type II error
failure to reject a null hypothesis when it should be rejected; a false-negative result
power
the ability of a test to detect true relationships
larger samples = ____
greater power
not statistically significant
type II errors
findings are statistically significant
type I errors
Analysis of 4 parameters
Level of significance (alpha)
Sample size
Power (beta)
Effect size
Tells you how many subjects needed to start and finish the study
bivariate statistical tests
t-Tests
Analysis of variance (ANOVA)
Chi-squared test
Correlation coefficients
Effect size indexes
t-test
Tests the difference between two means
t-Test for independent groups:
between-subjects test
For example, means for men vs. women
t-Test for dependent (paired) groups:
within-subjects test
For example, means for patients before and after surgery
analysis of variance (ANOVA)
Tests the difference between more than two means
sorts out the variability of an outcome variable into two components: variability due to the independent variable and variability due to all other sources
Variation between groups is contrasted with variation within groups to yield an F ratio statistic.
One-way ANOVA (e.g., three groups)
Multifactor (e.g., two-way) ANOVA
Repeated measures ANOVA (RM-ANOVA): within subjects
chi-squared test
Tests the difference in proportions in categories within a contingency table
Compares observed frequencies in each cell with expected frequencies—the frequencies expected if there was no relationship
correlational coefficient
Pearson’s r is both a descriptive and an inferential statistic.
Tests that the relationship between two variables is not zero
Effect size is an important concept in
power analysis.
In a comparison of two group means (i.e., in a t-test situation), the effect size index is
d
Effect size indexes
summarize the magnitude of the effect of the independent variable on the dependent variable.
d ≤ .20
small effect
d = .50
moderate effect
d ≥ .80
large effect
reliability assessment
Test–retest reliability
Interrater reliability
Internal consistency reliability
validity assessment
Content validity
Construct validity
Criterion validity
hypothesis testing
The test used
The value of the calculated statistic
Degrees of freedom
Level of statistical significance
A researcher measures the weight of people in a study involving obesity and Type 2 diabetes. What type of measurement is being employed?
ratio
A bell-shaped curve is also called a normal distribution.
true
The researcher subtracts the lowest value of data from the highest value of data to obtain:
range
A correlation coefficient of −.38 is stronger than a correlation coefficient of +.32.
true
Which test would be used to compare the observed frequencies with expected frequencies within a contingency table?
chi-squared test
six considerations for interpretive task
The credibility and accuracy of the results
The precision of the estimate of effects
The magnitude of effects and importance of results
The meaning of the results; especially causality
The generalizability of the results
The implications of the results for practice, theory, or further research
interpreting research
inferences
inferences
drawing conclusions based on limited information, using logical reasoning.
Evidence-based practice involves
integrating research evidence into clinical decision making.
credibility of quantitative results
Proxies and interpretation
Credibility and validity
Credibility and bias
Credibility and corroboration
CONSORT (The Consolidated Standards of Reporting Trials)
include a flowchart for documenting participant flow in a study
credibility and validity
Linked with inference
Statistical conclusion validity
Internal validity
External validity
Construct validity
researcher’s job r/t credibility and bias
Translate abstracts into appropriate proxies
Eliminate, reduce, or control biases
Look out for biases and factor them into assessment about the credibility of the results
seeking evidence to disconfirm the null hypothesis
Determining quality of the proxies that stand in for abstractions
Ruling out biases
Seeking corroboration for the results
results that support the researcher’s hypotheses are described as:
significant
A careful analysis of study results involves:
evaluating whether, in addition to being statistically significant, the effects are large and clinically important.
An interpretation of meaning requires understanding of:
methodological, theoretical, and substantive issues
Interpreting statistical results is easiest when:
hypotheses are supported, i.e., when there are positive results