2.5.2 output gaps
1/5
There's no tags or description
Looks like no tags are added yet.
Name | Mastery | Learn | Test | Matching | Spaced | Call with Kai |
|---|
No analytics yet
Send a link to your students to track their progress
6 Terms
actual growth rates
The actual growth rate is the annual % increase in RGDP.
It reflects the econ’s ST performance, influenced by D + S shocks, fiscal + monetary policies + other cyclical factors.
Actual growth rates fluctuate more due to ST factors.
Actual growth rates can be highly volatile.
lt trend growth rates
The LT trend growth rate is the average rate at which an econ can grow over a sustained period w/o generating inflationary pressures.
It’s determined by fundamental factors, eg. tech, labour force growth, capital accumulation + productivity improvements.
Trend growth rates indicate LT sustainable growth.
Trend growth rates r relatively stable.
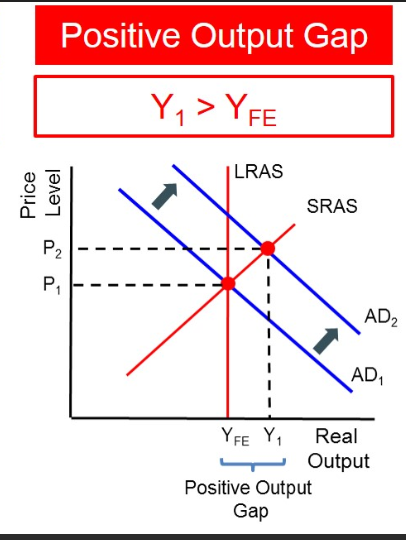
+ve output gaps
Occurs when actual GDP exceeds potential GDP.
Indicates that the econ is producing above its sustainable capacity, often leading to inflationary pressures.
Occurs when the AD curve intersects the AS curve to the right of potential output (Y*).
Diagram: Draw AD and AS curves with the intersection to the right of Y*, indicating actual output above potential.
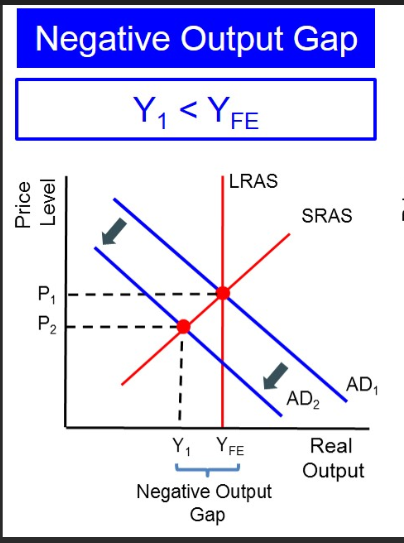
-ve output gap
Occurs when actual GDP is below potential GDP.
Indicates underutilisation of resources, high UE + deflationary pressures.
Occurs when the AD curve intersects the AS curve to the left of potential output (Y*).
Diagram: Draw AD and AS curves with the intersection to the left of Y*, indicating actual output below potential.
difficulties of measurement
Potential GDP isn’t directly observable + must be estimated, leading to potential inaccuracies.
Economic data is often revised, which can change the assessment of output gaps.
Changes in the economy’s structure, eg. tech advances or demographic shifts, can affect potential GDP estimates.
use of ad/as diagram to indicate output gaps
The AD curve represents the total Q of g/s demanded at diff PLs.
The AS curve represents the total Q of g/s that producers r willing + able to S at diff PLs.
Potential Output (Y*): The level of output the econ can produce at full employment (LT trend).