PNN Calculations, PNN Calculations, pnn biostatistics
1/99
There's no tags or description
Looks like no tags are added yet.
Name | Mastery | Learn | Test | Matching | Spaced | Call with Kai | Chat |
|---|
No analytics yet
Send a link to your students to track their progress
100 Terms
Food Calories- PO intake (calories per gram)
Carbs: 4 cal/gram
Protein: 4 cal/gram
Alcohol: 7 cal/gram
Fat: 9 cal/gram
TPN Calories- IV TPN intake (Calories per gram)
Dextrose: 3.4 cal/gram
Protein (amino acids): 4 cal/gram
Fat emulsion about 10 cal/gram
- 1mL of 10% = 1.1 cal
- 1 mL of 20% = 2.0 cal
- 1mL of 30% = 3.0 cal
Minimum (Base) daily requirements (calories, fluids and protein)
DAILY CAL: 25-30 cal/kg of IBW
DAILY FLUID: 30mL/kg of ABW
Daily PROTEIN: 1-1.5g/kg of IBW
Ideal Body Weight (IBW)
Men: 50kg + (2.3 x height over 5")
Women: 45.5kg + (2.3 x height over 5")
Basal Energy Expenditure (BEE)
Harris-benedict formula OR
25-30 cal/kg of IBW per day
Total Energy Expenditure (TEE)
BEE x Stress Factor x activity factor
Body Mass Index (BMI)
Weight (kg) /Height (m)2
What are the BMI ranges (normal, overweight, obese)
Normal: 18.5-24.9 kg/m2
Overweight: 25-29 kg/m2
Obese: >30kg/m2
- Class I: 30-34.9 kg/m2
- Class II: 35- 39.9 kg/m2
- Class III: >40 kg/m2
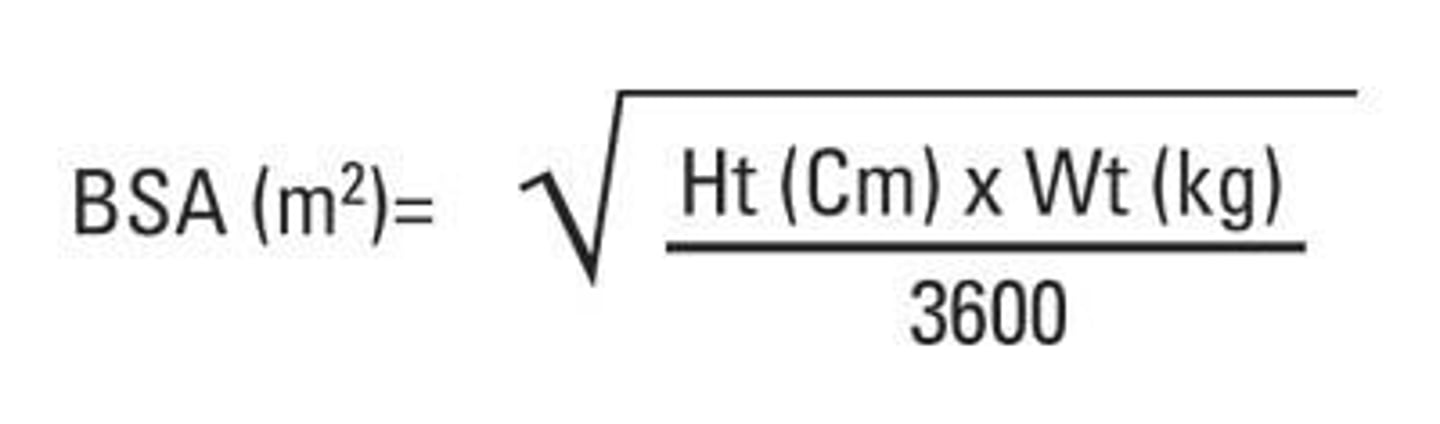
Body Surface Area (BSA)
What is the equivalency of 1 mmole?
MW in mg
What is the equivalency of 1 mEq?
MW in mg / Valence
What is the equivalency of 1 mOsm?
MW in mg / #ions
What is the relationship between 1 mmole, mEq (valence), and mOsm (ions)?
1 mmole = MW in mg = mEq (valence) = mOsm (ions)
What is the mmole, mEq and mOsm equivalency of NS
1 L of NS = 9000mg/58.5mg (MW)= 153.8 mmole = 153.8 mEq
Percent strength forms
w/w =g/100g
w/v= g/100mL
v/v= mL/100mL
% strength to strength ratio conversion
x grams/ 100mL = 1 part/ x parts
1 fluid ounce
29.6 mL (30 mL)
1 gallon
3800mL = 128 fl oz
1 quart (qt) = ___ milliliters (mL) = _______ fl oz
946 milliliters (mL) = 32 fl oz
1 pint (pt)=___ml = _____ fl oz
473 mL= 16 fl oz
1 teaspoon (tsp) = _____ milliliters (mL)
5 milliliters (mL)
1 tablespoon (tbsp) = ____ ml
15 milliliters (mL) = 1/2 fl oz
1 Deciliter (dl) = ______ mL
100 mL
1 mg = ___ mcg
1000 mcg
1 kg = ___ lbs
2.2 lbs
1 grain (gr) = ___ milligrams (mg)
65 milligrams
1 meter = ____ centimeters
100 centimeters (cm)
1 centimeter = ___ millimeters
10 millimeters (mm)
1 grain (gr) = ____ grams (g)
28.35 grams (g)
1 inch = ____ centimeters
2.54 centimeters (cm)
1 fl oz
29.6 mL
1 gallon = ____ quarts
4 quarts
1 quart = ____ pints
2 pints
1 pint
473 mL
1 pint
16 fl oz
1 oz
28.35 g
1 grain
65 mg
1 meter
100 cm
1 deciliter = ___ milliliters
100
1:1000
1 mg/mL
MW of KCl
74.5 mg
MW of Cl
35.5
MW of mag
24 mg
BSA equation
SQUARE ROOT OF (height in cm x weight in kg)/3600
BMI
Wt (kg)/m^2
BMI (inches)
(Lb/in^2) * 703
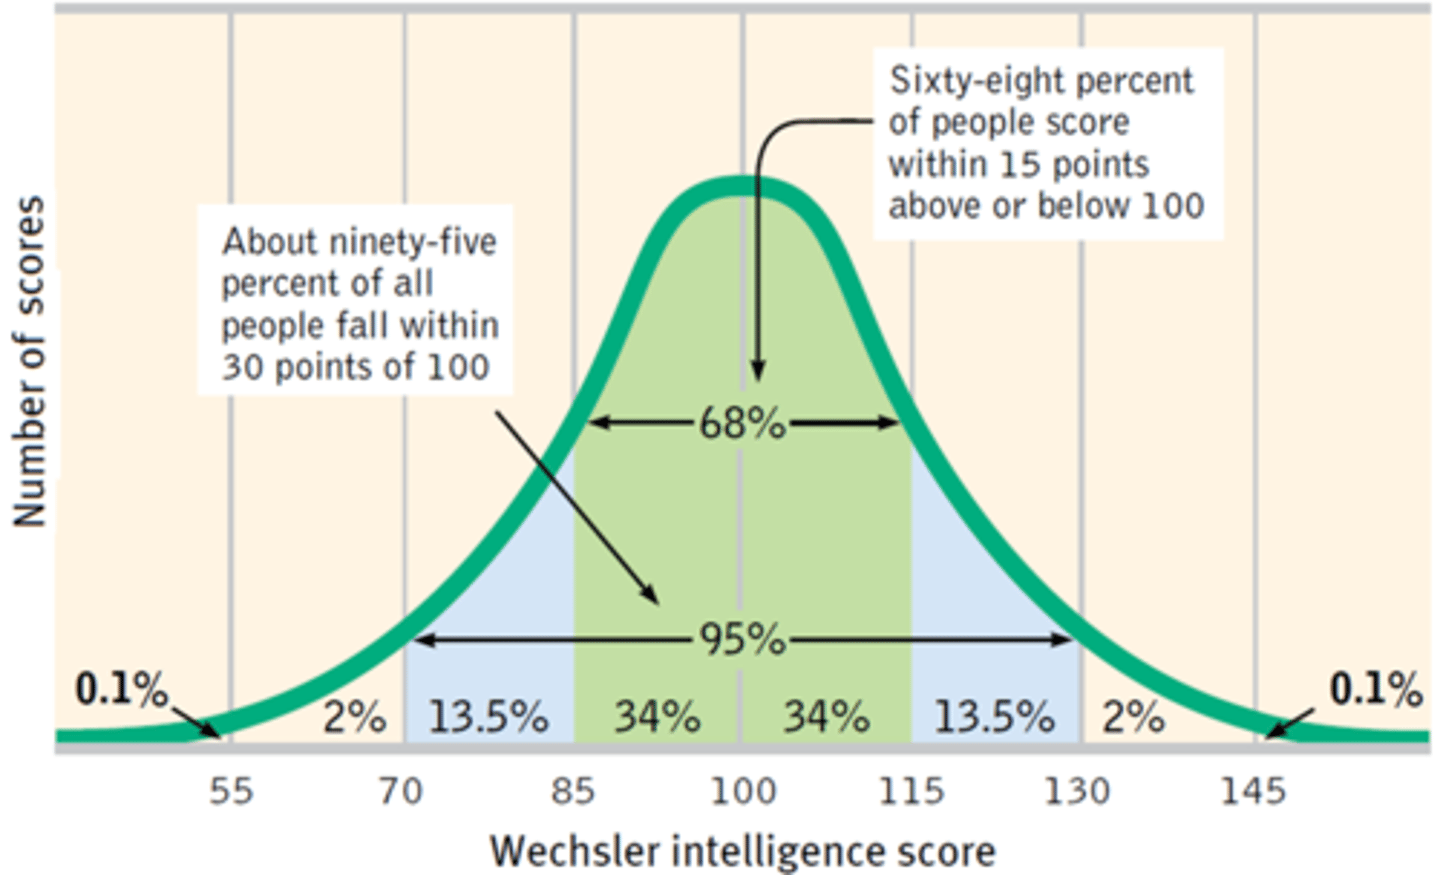
Normal Distribution Curve
Discrete data
-Numerical data values that can be COUNTED
-whole numbers, no decimals
Continuous Data
More or a continuum in which use of decimals allows for an infinite number of possible values
measure values
ex: lab values, height, weight, or drug concentration
Nominal (categorical) data
type of discrete data
Assigning data to different categories based on the occurrence of an outcome
ex: people who had MI and people who did not (yes or no: two groups - dichotomous) or based on certain characteristics (Race, gender)
Ordinal (ranked) data
type of discrete data
data that come in a certain order or ranking but the intervals between the values are not necessarily equal
ex: pain scale, or NYHA HF classification 1-4
Continuous (parametric) data subtype
Interval data
Ratio data
Interval data
-type of continuous data
measurable data with equal intervals between values, that has no absolute zero
ex: temperature is measurable and difference between 33&34 is equal to difference between 35&36
cant have "zero temperature"
Ratio data
-type of continuous data
measurable data with equal intervals between values, that has an absolute zero
ex: height, weight, hemoglobin
zero weight does mean "no weight"
Statistical Tests
1. type of data (continous, nominal or ordinal)
2. number of groups tested
3. whether the groups are independent or paired
T-test
-continuous data
-means of 2 groups are being compared
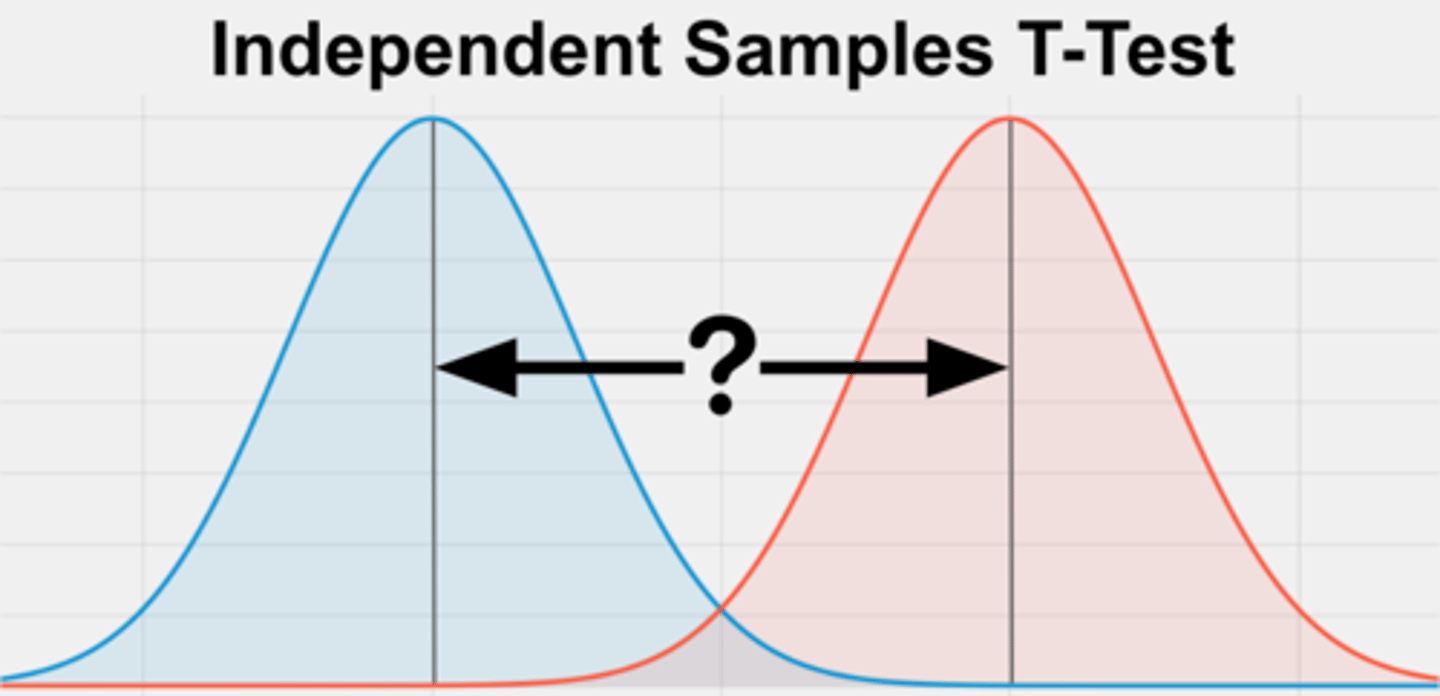
Student's T-test
-continuous data
-means of 2 groups are being compared
-when the two groups are independent and separate
Paired t-test
-continuous data
-test group acts as its own control ("paired")
-same set of patients before and after the treatment
Analysis of Variance (ANOVA) test
-continuous data
-3 or more groups are being compared
-Can be used for both independent and paired groups
Chi-squared test
-nominal (categorical) data
- 2 or more independent groups are being compared
-ex: YES MI or NO MI
McNemar's test
-nominal (categorical) data
-2 paired groups
-same set of patients
Cochran's Q test
-nominal (categorical) data
-3 or more paired groups
Wilcoxon Rank Sum test
-ordinal data
-2 or more independent groups are compared
-similar to t-test
-ex: pain scale
Wilcoxon Signed Rank Test
-ordinal data
-2 paired groups
-same set of patients
Kruskal-Wallis test
-ordinal data
-3 or more independent groups
Friedman test
-ordinal data
-3 or more paired groups
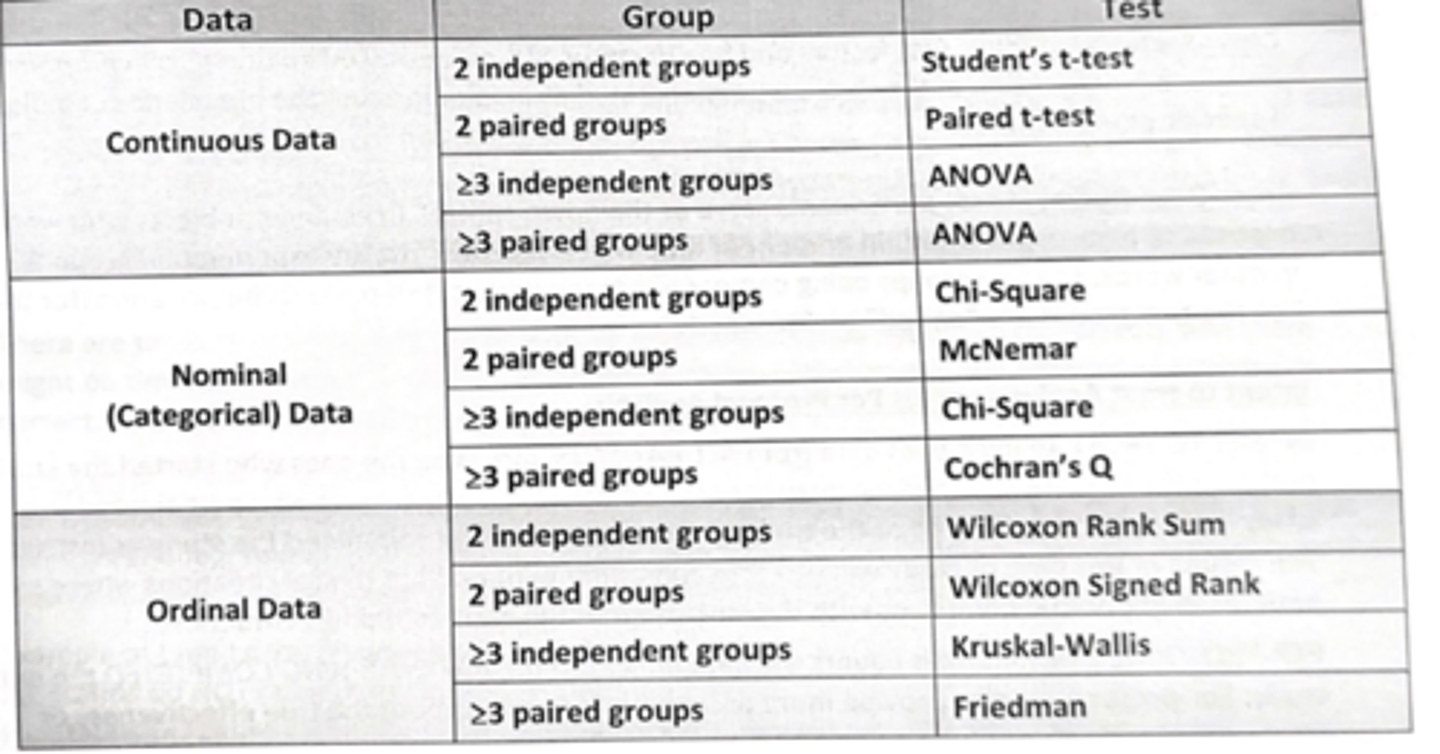
Table of tests
Randomized Control Trial (RTC)
-Clinical study comparing an experimental group to a control group where the two groups were chosen randomly without bias and respect to characteristics so the groups are similar
-gold standard for clinical trials
Cohort studies
-Begin with a group (cohort) of people who share a common trait, then with regards to a risk factor or a therapeutic measure
-exposed and non-exposed are observed over time
-Prospective
-Clinical treatment trials of new medications are cohort studies
Case-control Studies
-Individuals with a particular outcome (case) compared to individuals who never had the outcome
-control: individuals who are not exposed to the particular risk or treatment
-retrospective
Cross-Sectional studies
-Risk factors and health status of a group is studied at one specific point in time
-help determine the prevalence of a disease at a specific point in time
Cross-Over studies
-Study participants serve as their own control.
-Subjects who were initially exposed to placebo for a certain amount of time will "cross-over" to the experimental group & vice versa.
Intent to Treat Analysis vs. Per Protocol Analysis
-Intent to treat: includes data from ALL PATIENTS (closer to real life)
-Per protocol: data from PATIENTS WHO COMPLETED the entire study (better to determine effectiveness)
Meta Analysis/Systematic Review
-Gathering data from a number of previous studies.
-end results of a systematic review are reported as odds ratio of each individual study with 95% CI and final composite odds ratio of all the studies reviewed
Null Hypothesis (H0)
No difference or association
Alternative Hypothesis (Ha)
The hypothesis that argues for the presence or a correlation between events or a difference between groups being tested
Type I error
-False rejection of the null hypothesis
-Probability of a type I error: α
-most set a=0.05, p-value <0.05 (statistical significance)
Type II error
-False acceptance of the null hypothesis
-Probability of a type II error: β
-most set B=0.20, power= 1-B, =0.8
p-value
-The probability of incorrectly finding an association or difference when it does not exist (type I error)
-p-value of <0.05 means a type I error will be made less than 5 times out of 100 times
-p-value <0.05 is generally considered to be statistically significant
-in a large sample size, use p-value
Statistical Significance vs Clinical significance
statistical significance - result has low probability of having occurred by chance alone (p = .05)
differs from clinical significance in that emphasizes kind of change and amount of change, concerned with patients quality of life and overall satisfaction
power
-power=1-B
-likelihood of not making a type II error
-Beta is set at 0.20 which makes power 0.8 (80%)
Power Increases when
1. Sample size increases
2. Strong association between 2
Confidence Interval (CI)
-Interval or Range that will include the true mean of your population 95 out of 100 times
-another way to determine statistical significance
Relative Risk (RR) with 95% Confidence Interval (CI)
RR < 1.0 - treatment reduces the event rate compared to control
RR > 1.0 - treatment increases the event rate compared to control
RR = 1.0 - no difference in the two groups (treatment has no effect on risk)
RR (95% CI)
-Statistically significant if it does not cross 1.0
RRR (95% CI)
Statistically significant if it does not cross zero
OR (95% CI)
Statistically significant if it does not cross 1.0
Incidence vs Prevalence
-Incidence is the rate of new individuals that develop an illness in a given time period (usually one year) divided by the number of individuals at risk during that time
-Prevalence: number of indviduals who have an illness dived by total population
Case report vs case series
case report: one case
case series: a few
Bias
If the person administering the test influences the results
single-blind
Subject does not know which group (control or experimental) they are in
double-blind
Neither experimenter nor subject knows if the subject is receiving placebo or experimental drug
Reliability
reproducibilty of the test when repeated
Validity
-whether a test is assessing what it is supposed to be assessing
-sensitivity and specificity
Sensitivity
-Measures how well a test identifies truly ill people
-Highly sensitive- negative result is used to rule out disease
Specificity
-Measures how well a test identifies or rules out truly well people (without the disease)
-Highly specific- a positive result is used to confirm the disease
Phase I clinical trial
-Determine toxicity profile of the drug in humans
Phase II trials
-Limited number of patients with the target disease
Phase III Trials
-Larger number of target patients are given the new drug
Phase IV
post marketing surveillance