Conservation Biology Exam 2
1/53
There's no tags or description
Looks like no tags are added yet.
Name | Mastery | Learn | Test | Matching | Spaced |
|---|
No study sessions yet.
54 Terms
Biodiversity and Variation (what types)
-Within Individuals(Genetic Level) (homologous chromosomes, genes and gene loci, alleles, homozygosity v. heterozygosity)
- Species Level
- Within and Among Populations
“Gene pools are becoming diminished and fragmented into gene
puddles”
Foose, 1983
Genetic drift
change in the frequencies of alleles in a population resulting from sampling error in drawing gametes from the gene pool to make zygotes and from chance variation in the survival and/or reproductive success of individuals; results in NONADAPTIVE EVOLUTION
ultimate origin of Vg (genetic diversity)
mutations
Polymorphism (P)
P = (np/k)
quantifies the fraction of gene loci in which alternative alleles of a gene occur
np: number of polymorphic loci
k: total number of loci being evaluated in the population
value ranges from 0-1
- 0 = no genetic diversity
- 1 = every gene evaluated has polymorphism
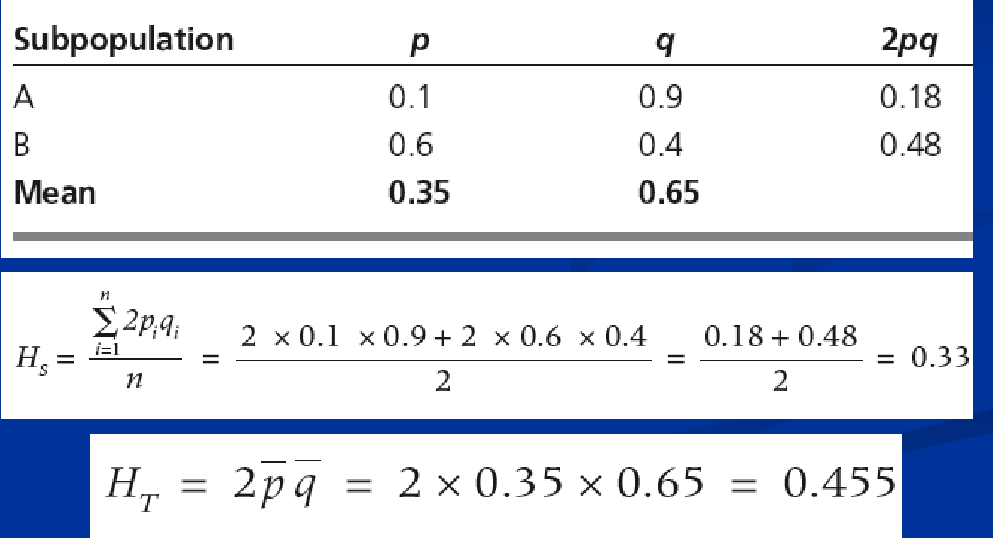
Fixation Index (Fst)
a general measure of heterozygosity in subpopulations
if Fst = 1, subpopulations are completely different genetically
if Fst = 0, subpopulations all have the same allele frequencies
Fst = (Ht - Hs) / Ht
example problem for Hs and Ht
Interpretation of Fst (guidelines from Wright)
<.05 gene flow is likely higher
.05-.15 gene flow moderate
>.15 gene flow likely lower
Additional considerations for evaluating Fst
need to measure multiple genes - bigger sample size = more accuracy in measuring true genetic differentiation between subpopulations
size of subpopulation (effective population size- how many individuals are contributing to the gene pool)
sex ratios
level of endangerment
is isolation natural or induced by human activities
Mutation meltdown- sequence of events
frequency of mating between close relative rises
heterozygosity is reduced in offspring, reducing the ability of the population to respond to environmental change
semi-lethal recessive alleles are expressed in a homozygous condition
fecundity reduced
mortality increases
effective population size becomes even smaller, amplifying the whole process
Muller’s Rachet
a process in which, in the absence of recombination, results in an accumulation of irreversible deleterious mutations
management solutions for mutational meltdown
promote gene flow (corridors, translocations, ex-situ conservation)
exponential population growth key model
dN / dt = rN
dN/dt - he rate of change of the population size (N) with respect to time (t). It essentially tells you how much the population is growing at a given moment
r- per capita rate of increase
N- the population size at a given time
goals of conservation on a population level
a conservation biologist must know:
the number of individuals in the current population
demographic information regarding the population
the trend in population size
an estimate of the immediate risk of extinction (or of the population’s viability- PVA)
IUCN Categories based on species viability
extinct (beyond reasonable doubt, the last individual has died)
extinct in the wild (survive only in captivity and/or naturalized populations)
critically endangered (considered to be facing an extremely high risk of extinction)
endangered (considered to be facing a very high risk of extinction in the wild)
vulnerable (considered to be facing a high risk of extinction in the wild)
near threatened (do not currently qualify for a threatened category, but are close in the near future)
least concern (do not qualify for a threatened category)
data deficient
perturbations (disturbance) to populations
deterministic factors: those that affect the population in constant relation to the population size (density dependent control factors when populations are near or at K)
stochastic factors
genetic: genetic variability, inbreeding, mutation meltdown
environmental: natural catastrophes, unpredictable, density-dependent impacts on a population
demographic: lag phases in population growth, changes in sex ratios, number of mature individuals, Allee effect and effective population size
The extinction vortex
extrinsic factors (habitat destruction, pollution, overharvest, invasive species) cause population to shrink to low numbers
small, isolated population
inbreeding and drift reduce variability and individual fitness, population declines
demographic stochasticity, environmental stochasticity, allee effect further reduce population size
repeat downward spiral to extinction
population count
quadrats, transects (botanical)
capture-recapture methods
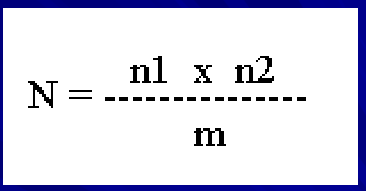
the lincoln index
N- number of individuals that live in the study site (population at time t)
n1- number of individuals captured during the first round of captures
n2- number of individuals captured during the second round of capture
m- number of marked individuals that were captured during the second round
Mark-recapture assumptions of the model
no effect of marking on the probability of recapture
no effect of marking on survival
mixing of marked and unmarked individuals
captured individuals are representative of the whole population
closed population model
marks are not lost
Sampling techniques: Simple Random Sampling (SRS)
strengths- best way to randomize sampling
weaknesses- assume homogenous distribution of population, some areas may be completely unsampled, sample size considerations
Sampling techniques: Stratified Random Sampling
best in a non-homogeonous environment
beta diversity level studies
utilize simple random sampling with equal quadrats in each type of area
Sampling techniques- Systematic Sampling
random start, every x paces, every x tree, across a transect, etc
measuring toward a system with constant rate of sampling, less random
watch out for pseudoreplication ( don’t want to count the same individual more than once!!)
The Allee effect
populations/species can get stuck in a lag phase
fecundity drop off after large population because of carrying capacity
analogy= empty club, no one stays
ex: puffins
what factors and characteristics of a population contribute to its effective population (Ne)
absolute population size
uneven reproduction effort across individuals
sex ratio
population fluctuation over time
The effect on Ne of unequal sex ratios
Ne = (4NmNf) / (Nm + Nf)
The effect on Ne of population fluctuation over time
Ne = t / Σ (1/Nti)
t: number of generations (time steps)
Predicting how populations change through time
what will they do in the future
age-structure data = qualitative, typically human
age/staged data = modules using linear algebra
typically used for human populations, very difficult to determine with wildlife
age-stage based models of population growth
age-based
stage-based (egg, larvae, pupa, adult)
size based (small, medium, large)
Markov Chain
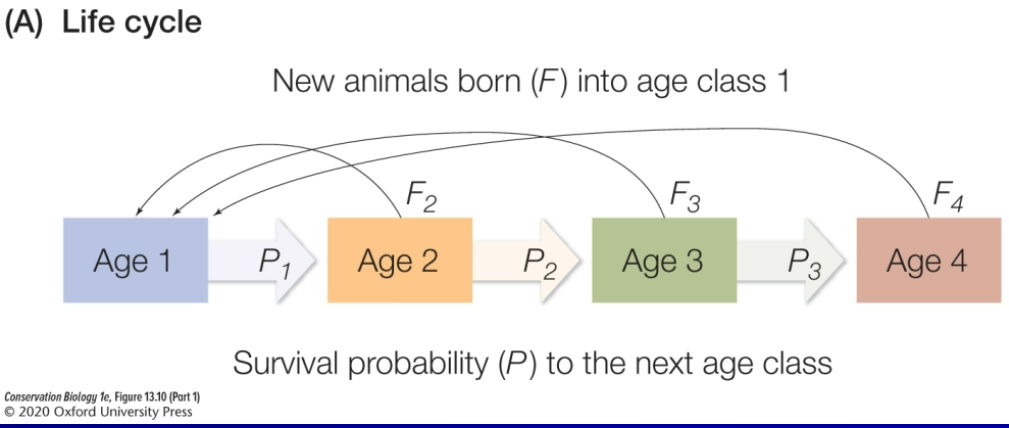
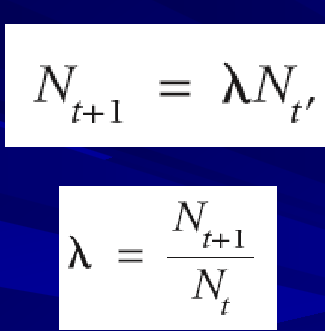
Age-based model of population growth
= 1: population will stay the same into the next time step
< 1: percentage decrease in the population (ex: .97= 3%)
age-based model assumptions
population shrinks or grows at a constant rate (no population controls)
deterministic population dynamics (no good years or bad years)
homogenous individuals (all have the same reproductive success)
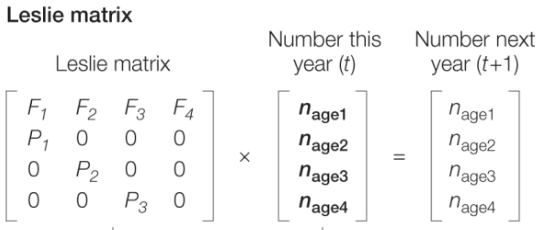
Leslie Matrix
*(how it fits together with the markov chain, must be able to plug into either), THEN plug in for lambda
Minimum viable population
the population for any given species in any given habitat that is the smallest isolated population having 99% change of remaining extant for 1000 years despite foreseeable effects of demographic, environmental, and genetic stoachsticity
Population viability, essential pieces of info:
the current N
population trend “r” or lambda
degree to with “r” or lambda fluctuates over t
primary objectives of population viability analysis
organize existing data about a population of conservation interest (IUCN)
estimate relative risk to the population based on different environmental, demographic, and genetic factors
adaptive management of populations by comparing model predictions to actual population behavior- ongoing experiments and monitoring
PVA is a model, quality can be effected by:
the quality of the model’s data and appropriateness of its structure to the populations studied
level of uncertainty associated with the model’s results
the quality of review the model was subject to prior to its final form and publication
Equilibrium theory of island biogeography (who_
McArthur and Wilson 1967
species equilibria for
small islands far from colonizing source
large island far from colonizing sourve
small island near colonizing source
large islands near colonizing source
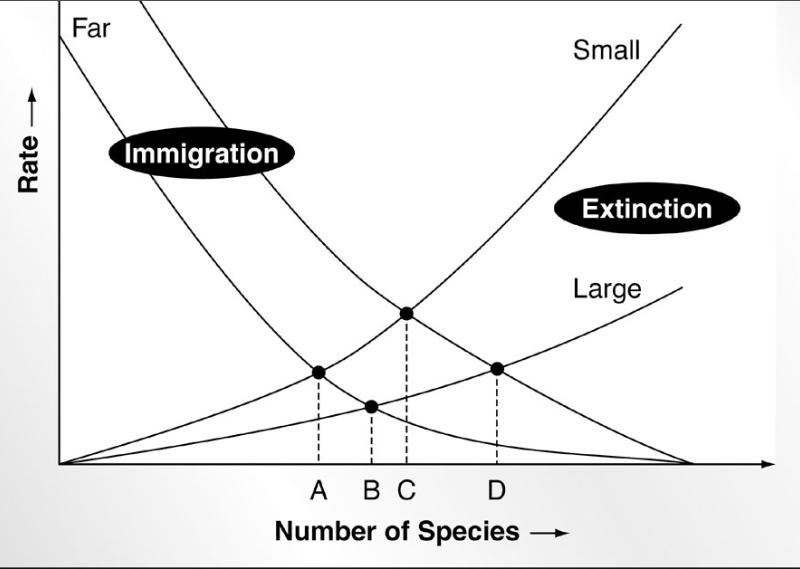
immigration rate is determined by:
distance of the island to the mainland
number of species in the mainland pool that have not established themselves on the island (species richness matters)
probability that a given species will disperse
extinction rate (on an island/patch) determined by:
the area of the island
the number of species present on the island (compression hypothesis)
probability that a given species on an island will go extinct (generalist vs specialist species)
habitat loss
the complete elimination of habitat along with their biological communities and ecological function
isolation
potential barriers to gene flow
fragmentation
process by which larger, continuous habitats become subdivided into a greater number of small patches
edge habitats/ecotones
mark the transition between two different habitats
leads to edge effect dynamics (40% loss of habitat = 60% loss of interior habitat)
consideration of natural edge habitats vs anthropogenic edge habitats
edge effects
suite of physical and biological changes that tend to occur at habitat patch edges
can potentially negatively impact diversity
additional factors:
changes in water regimes (from moist to xeric soils)
changes in biotic interations
wind, drought, fire, light (could be positive), nitrogen/nutrients
Faunal Relaxation (stages and who’s theory)
Newmark = LESS EXTINCTIONS WITH MORE LAND
initial exclusion
extirpation due to lack of essential resources
perils of small Ne- genetic demographic, and stochastic problems
deleterious effects of isolation- rescue effect decreases (gene flow)
ecological imbalance (leads to continued decreases in “s”- species richness)
Andrewartha and Birch (1954) metapopulation
a natural population occupying any considerable area will be made up of the number of local populations
Huffaker (1958)
mites and oranges experiment of habitat and non-habitat
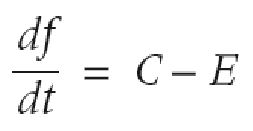
Levins (1970)
first definition of metapopulation (father of metapopulation theory)
“any real population that is a population of local populations which are established by colonists, survive for awhile, send out migrants, and eventually disappear”
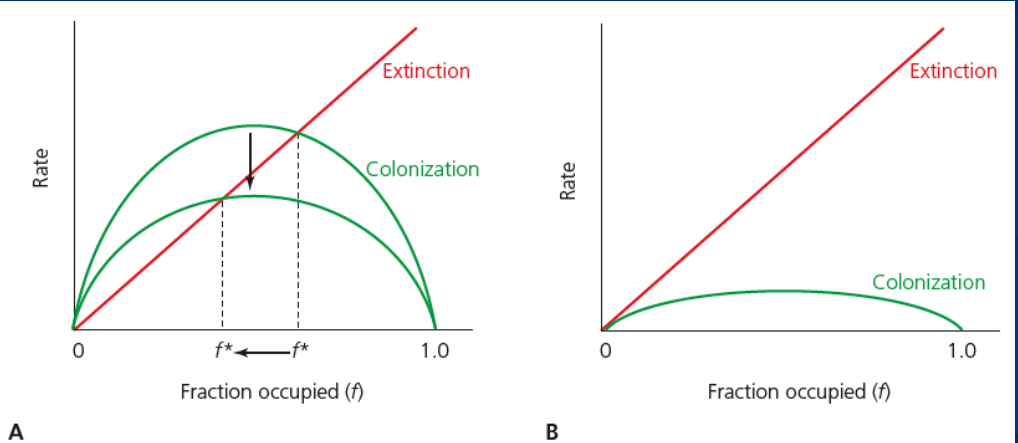
Levins basic population theory model
C- colonization
E- extinction rate
persistance at a patch requires that C > E
effects of colonization on extinction (do not need to know formulas, just how one affects the other
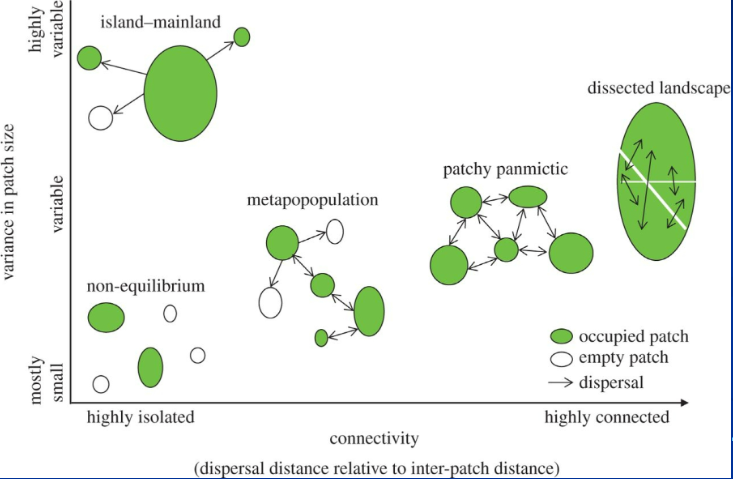
types of metapopulation
classic metapopulation (Levins)
mainland-island metapopulation (Boorman and Levitt)
nonequilibrium metapopulation
patch-population (panoptic)
directed landscapes
Conservation Lessons from metapopulation dynamics
sites that are currently unoccupied may be essential for the long-term persistence of the metapopulation
reduced disperal success can cause a metapopulation to become extint
a metapopulation can become extinct long before all of the habitat patches are destroyed
the arrangement and connectivity of patches can be just as important as the absolute amount of habitat that remains
3 C’s of Managing Fragmentation and metapopulations
connectedness (physical linage between habitats)
connectivity (measures the processes by which subpopulations of organisms are interconnected into a functional demographic unit)
corridor (linear landscape element that provides for movement between habitat patches (rosenberg et al. 1997)