AP Statistics Units 8 and 9 Terms
1/42
Earn XP
Description and Tags
Name | Mastery | Learn | Test | Matching | Spaced | Call with Kai | Chat |
|---|
No analytics yet
Send a link to your students to track their progress
43 Terms
Point estimator
A point estimator is a statistic that provides an estimate of a population parameter.
Point estimate
The value of the statistic from a sample is called a point estimate.
Confidence interval
A confidence interval gives an interval of plausible values for a parameter based on sample data.
[Note: Plausible does not mean possible; instead, plausible means that we should not be surprised if any one of the values in the interval is equal to the value of the parameter]
The formula sheet indicates:
confidence interval = statistic +- (critical value)(standard error of statistic)
Confidence level, C
The confidence level, C gives the overall success rate of the method used to calculate the confidence interval. That is, in C% of all possible samples, the resulting interval computed will capture the true parameter value.
Interpretation of confidence interval
“We are ____% confident the interval from ____ to ____
captures the true value of the [parameter in context]”
Interpretation of confidence level
“____% of all possible samples of size ____ result in a confidence
interval that captures the true [parameter in context]”
Margin of error
Margin of error is distance we extend from the point estimate.
it is the “(critical value)(standard error of statistic)” part of the confidence interval formula
How do decrease the margin or error
use a larger sample size
decrease confidence
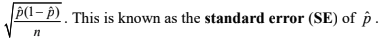
Standard error
When the standard deviation of a statistic is estimated from data, the result is called the standard error (SE) of the statistic.
Standard error of phat
One-sample z interval for a population proportion.
When you use one sample to construct a confidence interval for phat
Conditions for a confidence interval
Random
Large Counts
Independent
Random condition (for confidence intervals and significance tests)
The statistic must come from a random sample from the population of interest (if there are two of them, this must be verified for both)
Large Counts condition for a one sample z interval for a population proportion
The Large Counts Condition assures we can use a normal distribution to calculate the critical value, z*. We do not know the value of p, so we use nphat >= 10, n(1-phat) >= 10
Independent condition for confidence intervals and significance test
Either:
The sample(s) are independent (must state for both samples when there are two samples used)
There is sampling without replacement
You can use the 10% Condition for samples to count as independent (must be verified for all samples in the question)
Steps for making a confidence interval
defining the parameter,
checking conditions,
identifying the procedure (by name or formula or both),
construct the interval (“formula, substitution, result”)
interpreting the interval
Choosing a sample size for confidence intervals
The confidence interval and confidence level will be provided, so you need to:
Find the statistic
Find the margin or error
Find the critical value (z*)
Choose a sample proportion
Either there are preliminary studies with an estimated phat
Use phat = 0.5 as this will result in the largest margin of error, so this is a conservative estimate
Use the formula for confidence interval to find the sample size
two-sample z interval for p1 – p2.
A confidence interval for a difference in proportions
Significance test
A significance test (or a hypothesis test) is a formal procedure for using observed data to decide between two competing claims (called hypotheses).
Null hypothesis
Null Hypothesis, Ho, is the claim in context
uses a parameter (or two)
is an equality (Ho = ___)
Alternative hypothesis
Alternative Hypothesis, Ha, is the claim we suspect in context
Uses a parameter (or two)
Is an inequality (>, <, ≠)
One-sided
The parameter is larger than the claim or smaller than the claim (Ha uses either a < or a > sign)
Two-sided
The parameter is different than the claim (Ha uses a ≠ sign)
P-value
Formally, a P-value is the probability of the observed or more extreme occurring by chance if the null hypothesis is true.
It is a conditional probability: P(z-score > test statistic | parameter = po)
Conclusions in a significance test
The conclusion of a significance test is based on the strength of the evidence as measured by the P-value. The conclusion always takes one of two forms.
Reject Ho
Fail to reject Ho
Significance level, α (alpha)
In many cases, a predetermined boundary for a “small” p-value is specified. Such a boundary is called the significance level and is notated α. Significance levels are stated before collecting data.
If p-value > α
We fail to reject Ho
If p-value < α
We reject Ho
Type I error
We reject Ho when Ho is, in fact, true
The probability of committing a Type I error is α
Type II error
We fail to reject Ho when, in fact, the alternative hypothesis is true (we should have rejected Ho)
The probability of committing a Type II error is beta
The probability of committing a type to error is inversely proportional to the probability of committing a type to error (a lower α means beta is higher)
P(Type II error) = P(Fail to reject Ho | Ho is false) = beta
How to carry out a significant test
State hypotheses
Indicate the specific test by name or formula
Check conditions
Calculate how far observation diverges from expectation (known as test statistic)
Find probability of observed or more extreme (known as P value)
Interpret the probability and conclude
Conditions for a significance test
Random
Large Counts
Independent
Large Counts Condition for a 1 sample z test for a population proportion
The Large Counts Condition assures we can use a normal distribution We do not know the value of p, so we replace p with the claimed value, po , and have npo >= 10, n(1-po) >= 10
Standardized test statistic
A standardized test statistic measures how far a statistic is from expectation.
standardized test statistic = (statistic-parameter)/(standard error of statistic)
In this case, the test statistic is a z-score
One sample z test for a population proportion
A significance test for phat, given one sample
A two-sided z test will often yield the same result as a:
Confidence interval with the confidence level, (1-a)x100%
A practical advantage of a confidence interval (rather than a significance test) is that it provides a span of plausible values instead of just a ‘reject’ / ‘fail to reject conclusion’.
Power
the probability not committing a Type II error. Power = 1-beta
How to increase power
Increasing the sample size increases a significance test’s power (and hence reduces the probability of a Type II error).
Increasing the significance level will also increase power (but increases the risk of a Type I error)
How to decrease the probability of making a Type I error
Increase sample size
Decrease the alpha-value
Pooled sample proportion, phatc
To eliminate the bias of simply using phat1-phat2 = 0 (the null hypothesis), we use phatc as an average of the two statistics
It is (total number of successes)/(total number of individuals)
It is just (x1+x2)/(n1+n2)
Test statistic for a 1 sample z test for a population proportion

Test statistic for a 2 sample z test for a difference in proportions
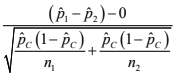
Large Counts Condition for a 2 sample z test for a difference in proportions
The large counts condition uses the pooled proportion, phatc
n1phatc >= 10, n1(1-phatc) >= 10, n2phatc >= 10, n2(1-phatc) >= 10
