Unit 1 Study Set
1/23
There's no tags or description
Looks like no tags are added yet.
Name | Mastery | Learn | Test | Matching | Spaced | Call with Kai |
|---|

24 Terms
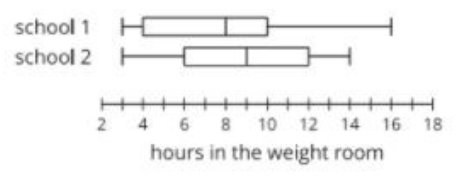
True/False: Players at school one typically spent more time in the weight room than players at school two (you must be able to explain why!)
False, school two spends one more hours than school one

True/False: The middle half of the data for school one has more variability than the middle half of the data for school two
False, IQR for both is six hours

True/False: The median hours spent in the weight room for school one is less than the median for school two and the interquartile range for both schools are equal
True
True/False: 50% of the players on the football team at school two spent nine hours or more in the weight room
True

True/False: Noah’s scores have greater variability than Jada’s scores
False, They have the same variability
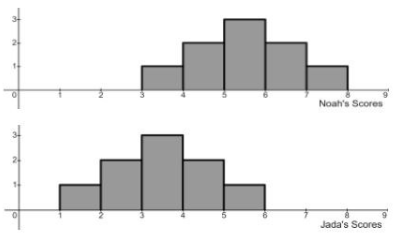
True/False: The standard deviation of Noah’s scores is equal to the standard deviation of Jada’s scores
True

True/False: The mean of Noah’s scores is greater than the mean of Jada’s scores
True

True/False: Noah scored better than Jada on EVERY assignment
False, Jada has a few higher scores than Noah

True/False: Using only Noah’s scores, the mean is equal to the median
True
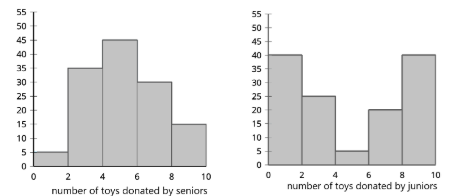
A school has a toy drive for a holiday in which students bring in toys to be donated to charity. The number of toys donated by juniors and seniors are summarized in the histograms. Both distributions have a mean of 5 toys.
Is the standard deviation of the number of toys donated greater for seniors or juniors? Explain how you know.
The standard deviation is greater for juniors. It has more variability because it’s more spread out.
Find the five-number summary for the following list of numbers:
1, 18, 3, 12, 14, 8, 7, 6, 1, 6, 9, 17, 17, 6, 19 ,16, 14, 17, 6, 9, 11, 15, 4, 14, 5, 3, 13, 5, 2, 5, 3, 12, 4, 6, 4 ,7, 6, 5 ,10, 3, 4, 11, 4, 9, 28, 2, 25, 12, 18, 20
You may use Desmos for this question!
Minimum: 1
Q1: 4
Median: 7.5
Q3: 14
Maximum: 28
The chess club at a school has 50 members. The number of games won in tournament play this season be each member is listed:
1, 18, 3, 12, 14, 8, 7, 6, 1, 6, 9, 17, 17, 6, 19 ,16, 14, 17, 6, 9, 11, 15, 4, 14, 5, 3, 13, 5, 2, 5, 3, 12, 4, 6, 4 ,7, 6, 5 ,10, 3, 4, 11, 4, 9, 28, 2, 25, 12, 18, 20
What measure of center is most appropriate to use to describe a typical value for the data in this distribution?
(hint: use Desmos to create a histogram to see the shape)
Median because it is skewed right
The chess club at a school has 50 members. The number of games won in tournament play this season be each member is listed:
1, 18, 3, 12, 14, 8, 7, 6, 1, 6, 9, 17, 17, 6, 19 ,16, 14, 17, 6, 9, 11, 15, 4, 14, 5, 3, 13, 5, 2, 5, 3, 12, 4, 6, 4 ,7, 6, 5 ,10, 3, 4, 11, 4, 9, 28, 2, 25, 12, 18, 20
What measure is most appropriate for describing variability in this data distribution?
(hint: use Desmos to create a histogram to see the shape.)
Interquartile Range

The histograms and summary statistics summarize the data for the number of hits in the season by baseball players in two leagues.
Use the shape of the distributions to select the appropriate measures of center and variability for the number of hits by players in each of the two leagues.
Median and Interquartile Range

Compare the number of hits by players in the two leagues using the measures you found in the previous question. Explain what each value means in your comparison.
League B has a greater median and a greater IQR.
That means that the typical number of hits for League B is greater than League A, but there is more variability for League B than League A.
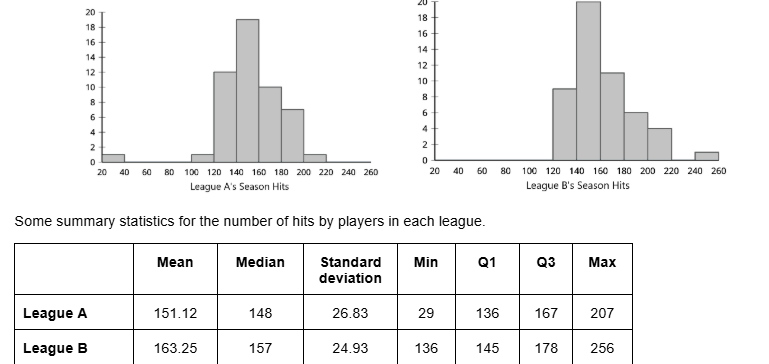
Each data set contains one outlier. The value of the outlier in League A is ______
29

Each data set contains one outlier. The value of the outlier in League B is ______
256

Each data set contains one outlier. If the outliers are removed, which would be more likely to change significantly: mean or median?
Mean (it’s more affected by outliers)

Is the standard deviation or interquartile range more likely to change significantly? Explain your reasoning.
Standard Deviation, it uses all the values in the data set so it’s more affected by outliers
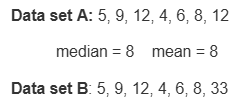
In the image, there are two data sets that are the same size. The mean and median are given for data set A.
Calculate the median for data set B
8

In the image, there are two data sets that are the same size. The mean and median are given for data set A.
Calculate the mean for data set B
11

Compare the median and mean for the two data sets and provide an explanation for your comparison.
The mean for data set B is higher than data set A because B has an outlier. The median is the same for both.
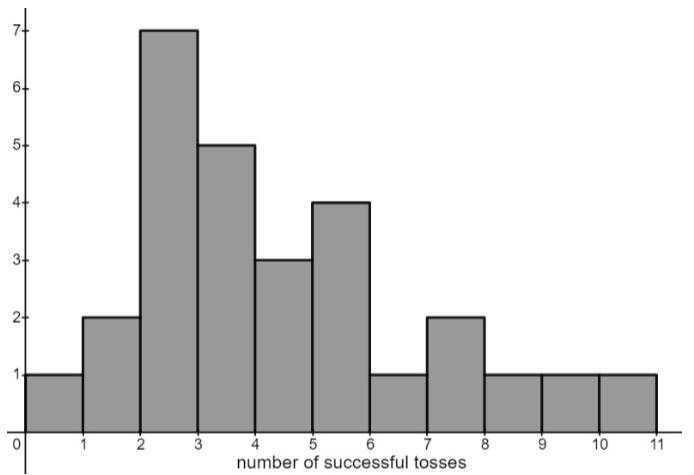
A class of students took turns trying to toss 10 bean bags into a basket on the floor 15 feet away. The number of successful tosses for each student was recorded and displayed in the histogram. What does the shape tell you about the mean and median?
The mean is larger than the median
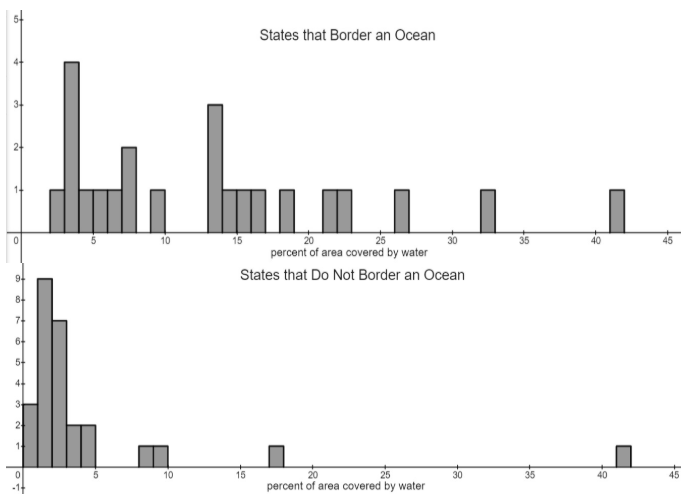
Carlton found data on the percent of area that is covered by water for each of the 50 states in the United States. He made the histograms below to compare the distributions for the states that border an ocean and states that do not border an ocean.
What is the best statistical reason for using the median and interquartile range (IQR), rather than the mean and standard deviation, to compare the center and spreads of these distributions.
The mean and standard deviation are more strongly influenced by outliers than the median and IQR