CVM MR SVERKUNOS 9th grade PHYSICS
1/28
There's no tags or description
Looks like no tags are added yet.
Name | Mastery | Learn | Test | Matching | Spaced |
|---|
No study sessions yet.
29 Terms
Model I:
Describing Constant Speed Using WORDS:
Speed?
Speed is related to distance and time.
speed is related to the distance traveled and inversely related to the amount of time it takes to travel that distance.
the more distance you can cover per certain time interval, the more or faster your speed would be (directly related).
the more time it takes you to travel a certain distance, the less or slower your speed would be (inversely related).
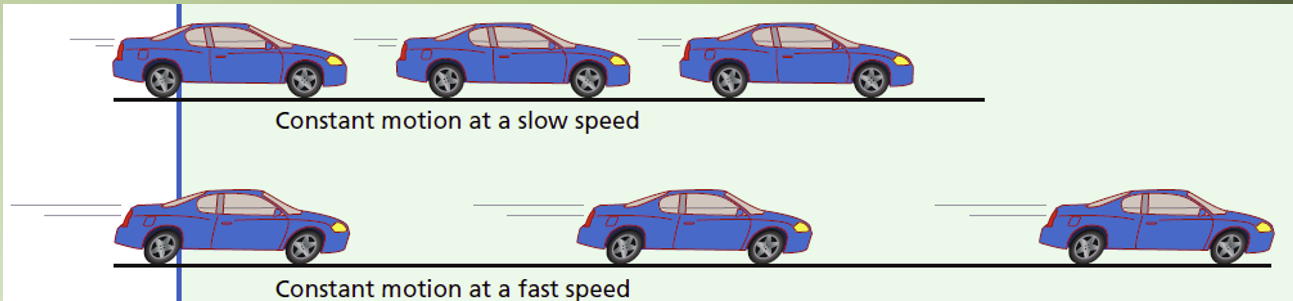
Constant speed
When you maintain the same speed throughout a time period (no change in speed)
Average speed
When your speed is up-and-down but averages to a certain speed (related/similar to constant speed)
Instantaneous speed
Speed at a certain "instant" in time
Changing speeds
Increasing speed (positive acceleration), or decreasing speed (negative acceleration) during a certain time period
Speed
the distance traveled per unit time; distance and speed are scalar quantities that have no direction
Velocity
the speed in a given direction; velocity is a vector quantity with direction
• (described by displacement instead of distance)
Scalar
quantity/magnitude only; no direction
Vector
quantity/magnitude and direction
Model II:
Describing Motion and Speed Using MOTION MAPS:
strobe photo
A strobe photo is a multiple-exposure photo in which a moving object is photographed at regular time intervals.
The space between photos indicates the speed of the object.
More space between photos means the object is moving faster.
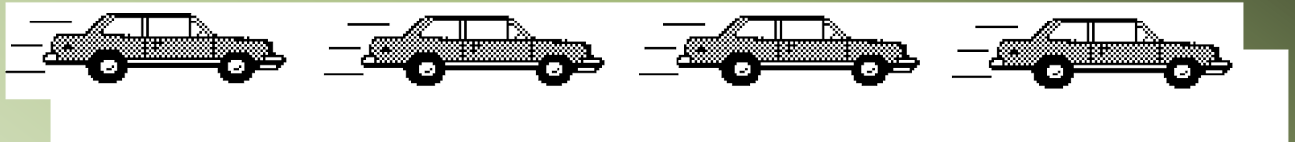
Motion Maps: (just describing picture)
represents the position, velocity, and acceleration of an object at various clock readings.
This is the motion map that represents the car. We model the position of the object with a small point. At each position, the object's velocity is represented b a vector.


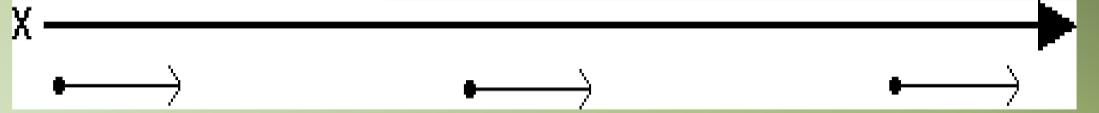
Motion Maps: (just describing picture)
If the car were traveling at greater velocity, the strobe photo might look like this:
The corresponding motion map has the points spaced farther apart, and the velocity vectors are longer, implying that the car is moving faster.
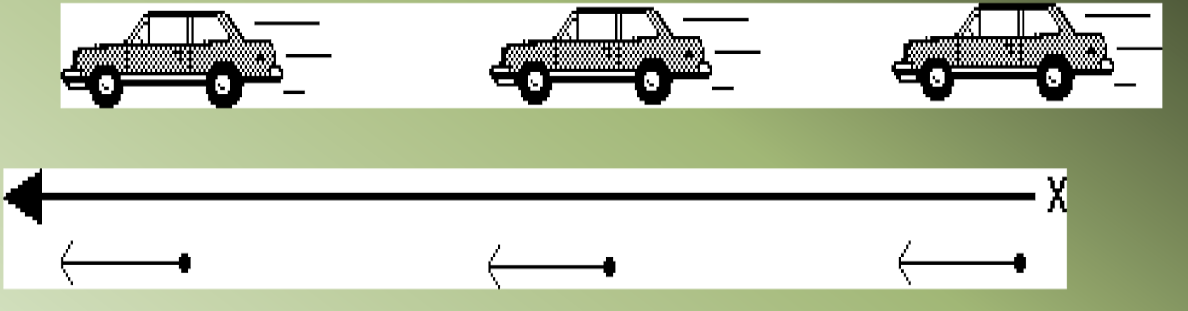
Motion Maps: (just describing picture)
If the car were moving to the left at constant velocity, the photo and motion map might look like this::
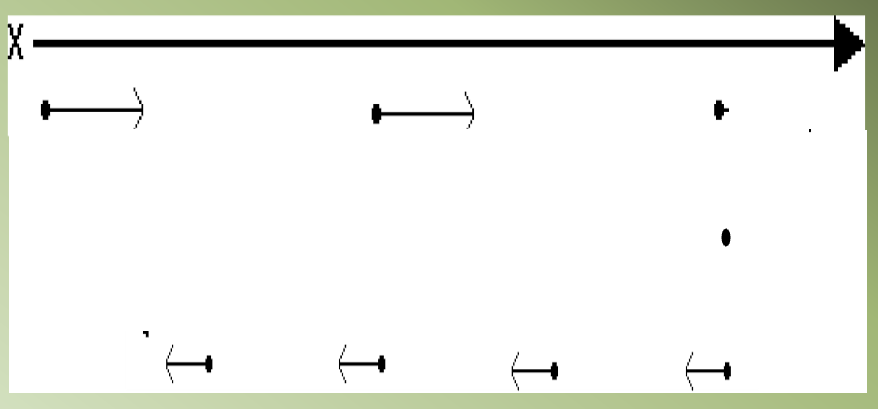
Motion Maps: (just describing picture)
Here, an object moves to the right at constant velocity, stops and remains in place for two seconds, then moves to the left at a slower constant velocity:
HOW TO: Drawing Motion Maps
Draw dots at equal time intervals.
Attach arrows to indicate motion direction.
Make arrows shorter than half of space between dots for easy reading.
Draw multiple dots at same position when object is stopped.
Ensure logical flow of arrows for clear motion communication.
Model III:
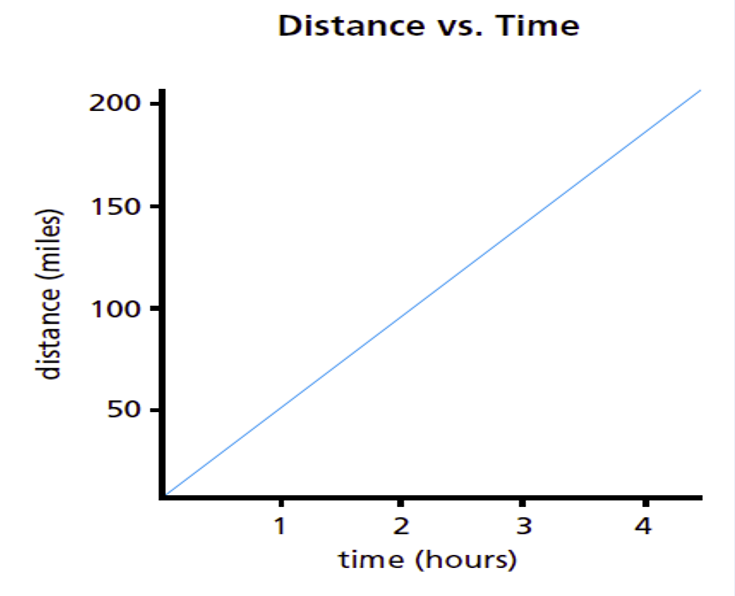
Describing Motion and Speed Using a Distance-Time
Graph Interpretations
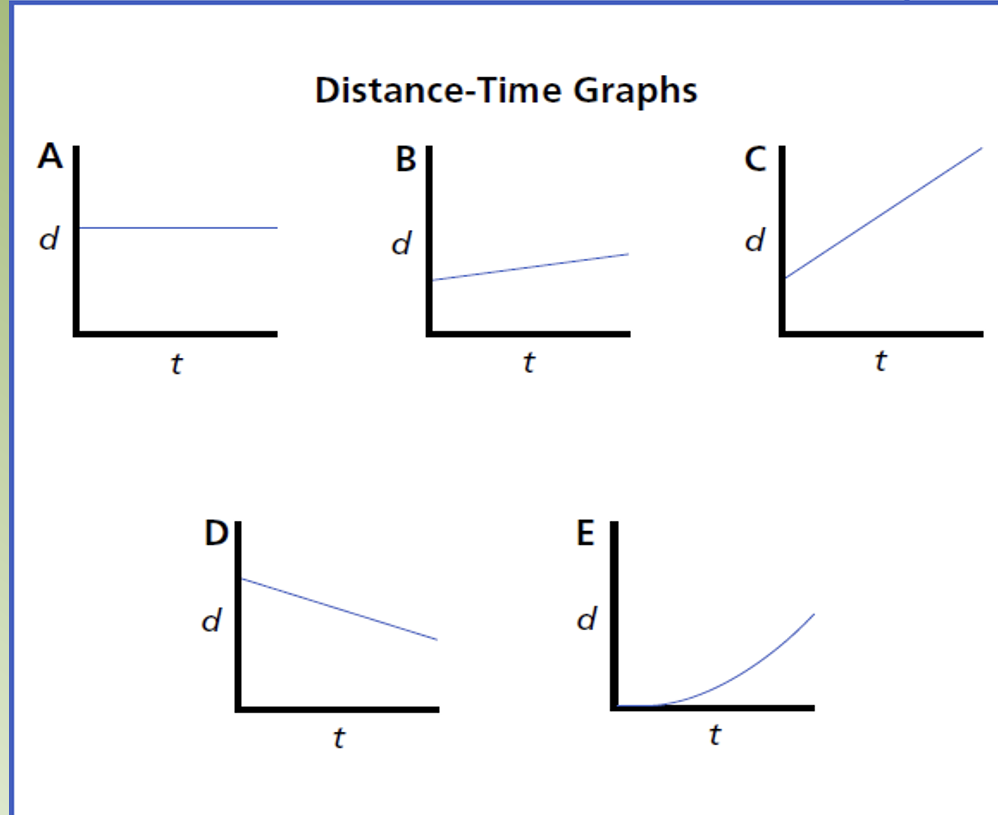
The slope of the graph indicates the speed of the person:
A slow speed has a gradual slope.A fast speed has a steep slope.
No motion has zero slope.
Walking in opposite direction produces a slope in
the opposite direction.
The measure of the slope of a d vs. t graph is equal to the speed of the object:
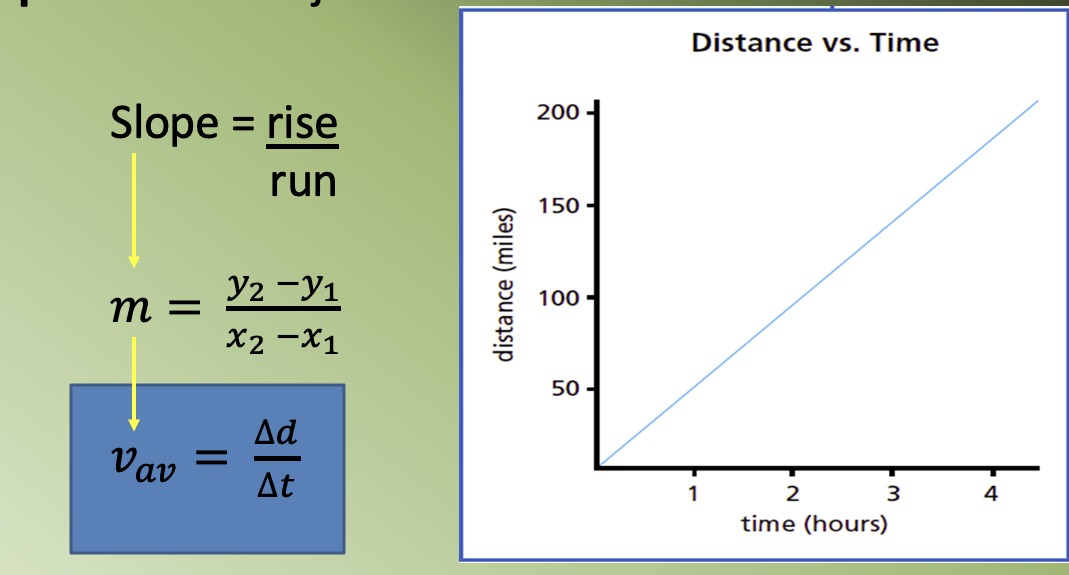
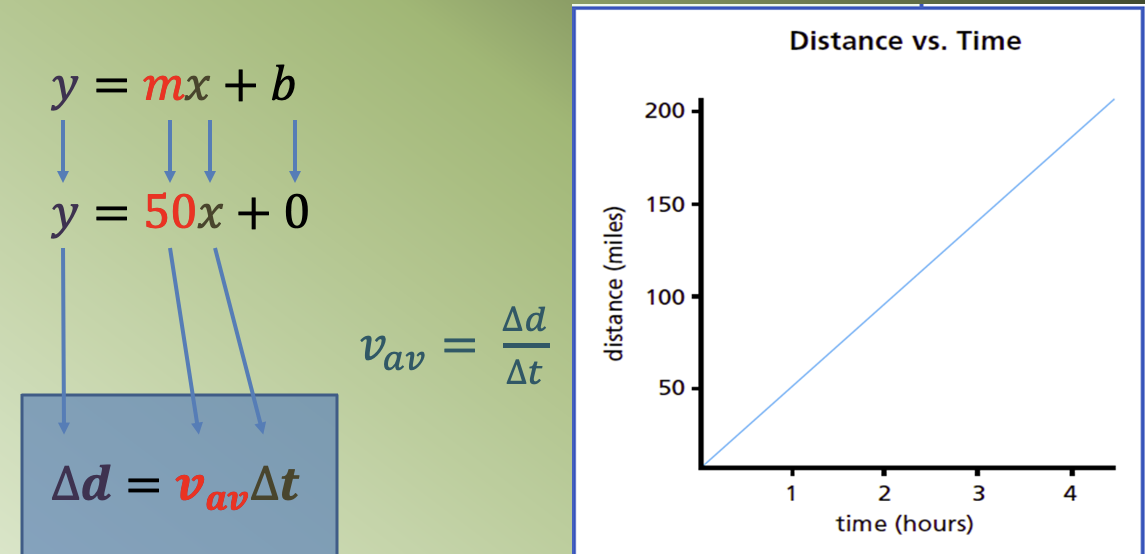
If you know the slope (m) and you know the y-intercept,
then you can write the equation of the line:
• Is it relevant to include the data point (0,0)?
Model IV:
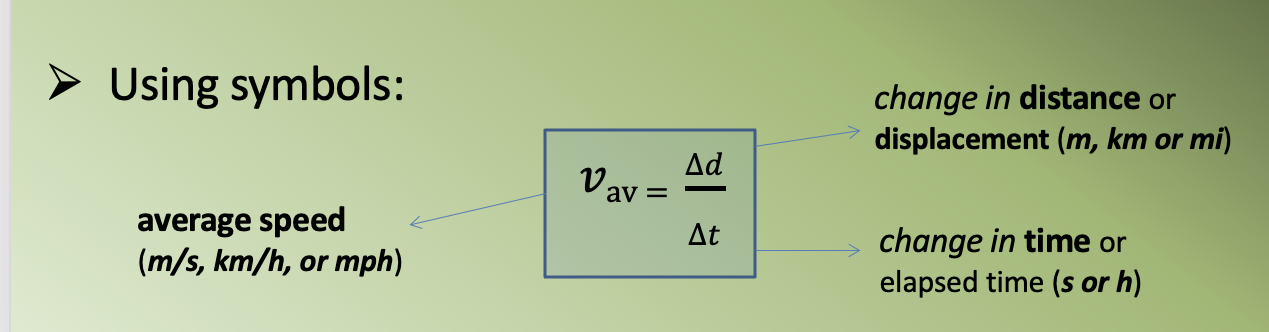
Describing Motion and Speed Using an EQUATION:
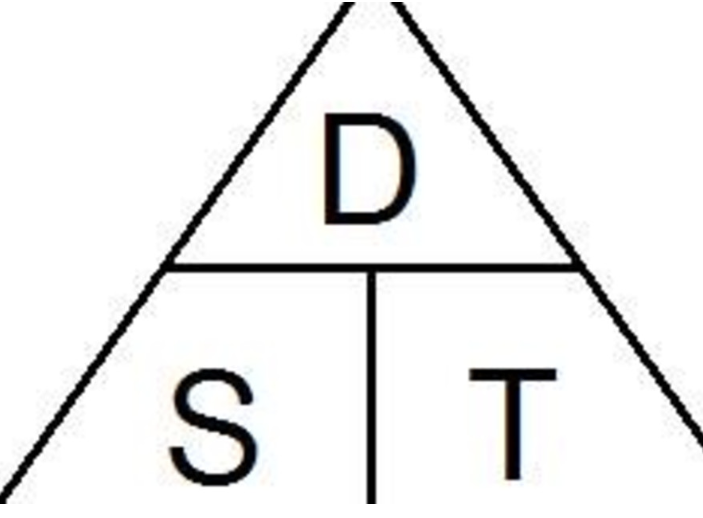
The relationship between speed, distance, and time can be written as:
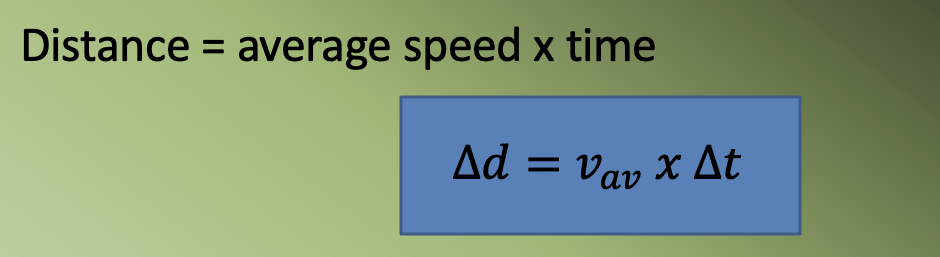
Distance = average speed × time
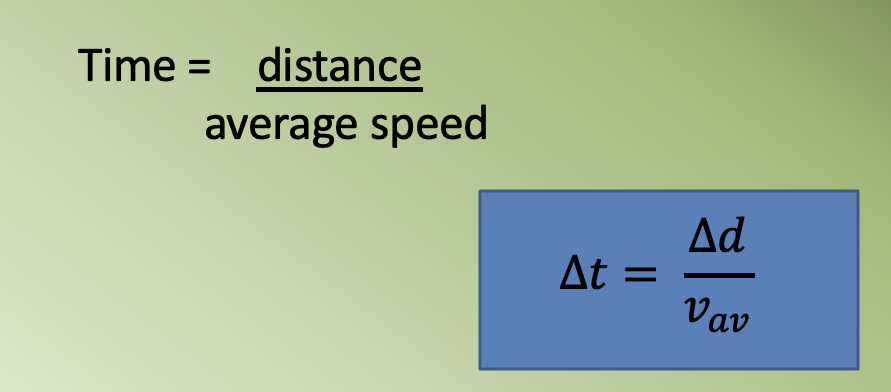
Time = distance/average speed

review the CVM lab and its result
review CVM graphs - what the slope represents, and the math model that comes from it
review how to make and analyze motion maps
review the practice problems using the formula