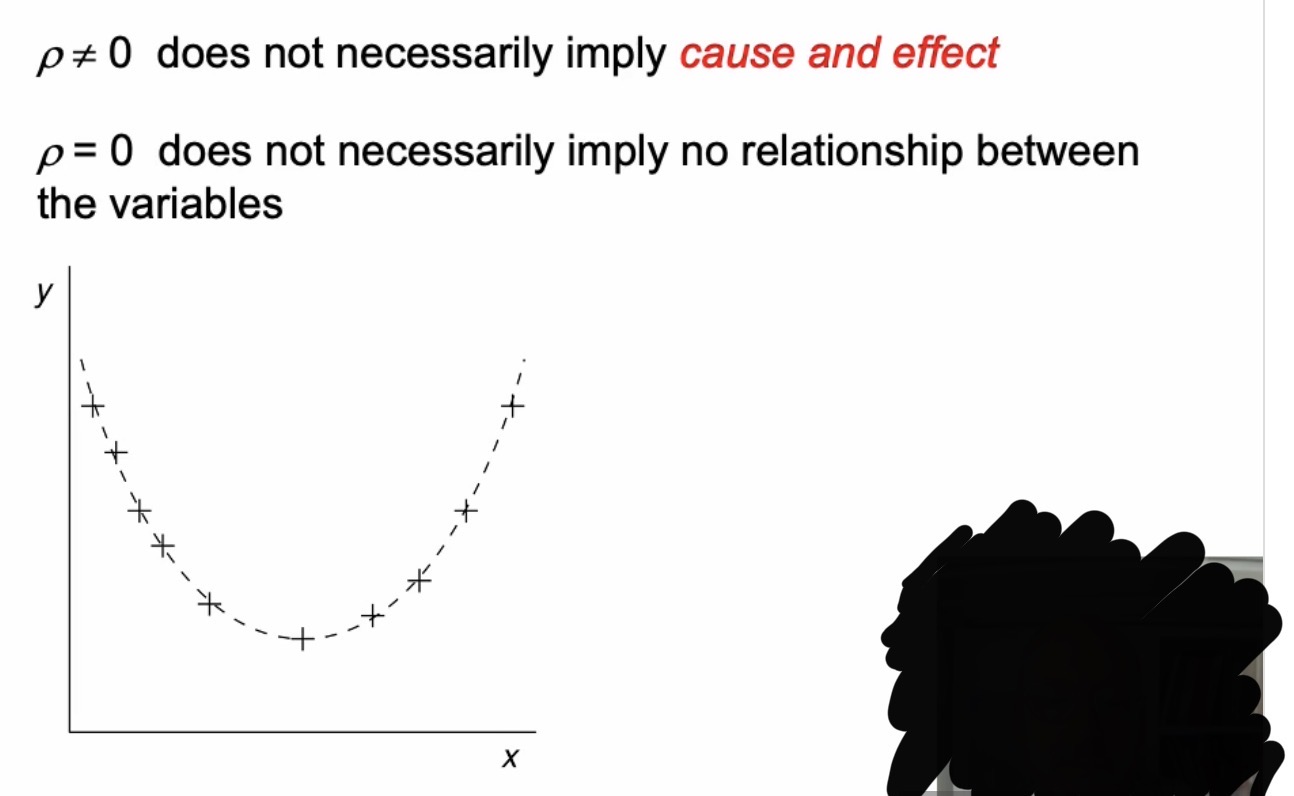
Correlation of continuous variables: Pearson’s test
 Call Kai
 Learn
Learn Practice Test
 Spaced Repetition
 Match
Match Flashcards
 Knowt Play
1/18

There's no tags or description
Looks like no tags are added yet.
Name | Mastery | Learn | Test | Matching | Spaced | Call with Kai | Chat |
|---|
No analytics yet
Send a link to your students to track their progress
19 Terms
What is the correlation of 2 continuous variables called?
Bivariate data
E.g. rate constant and temp
E.g. height and mass
What do we use to summarise quantitative bivariate data?
Scatter diagram
What does the scatter diagram show us?
Distribution of the data
Relationship between the 2 variables
Pearson’s correlation coefficient
Used for continuous variables from a normal distribution
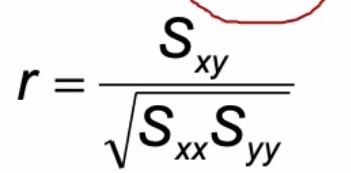
r =
sample value correlation coefficient
(Correlation in the sample size measured)
ρ =
Population value
(Correlation in the whole population)
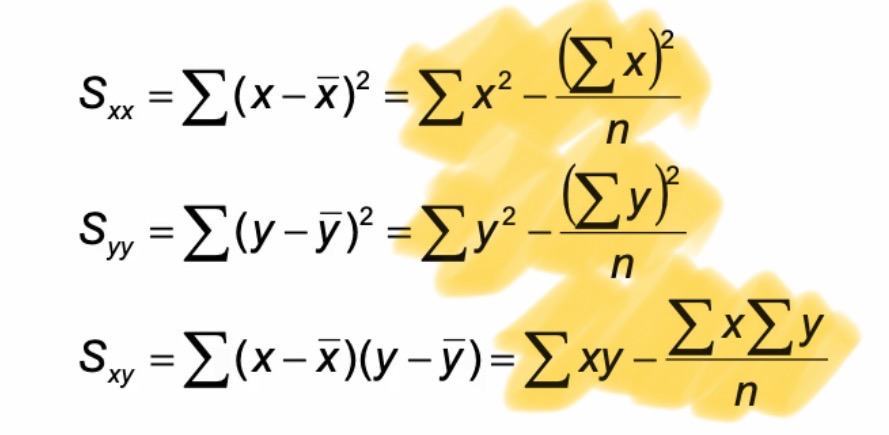
Sxx =
Syy =
Sxy =
equation for r
What values can r be?
r can take values from -1 to +1
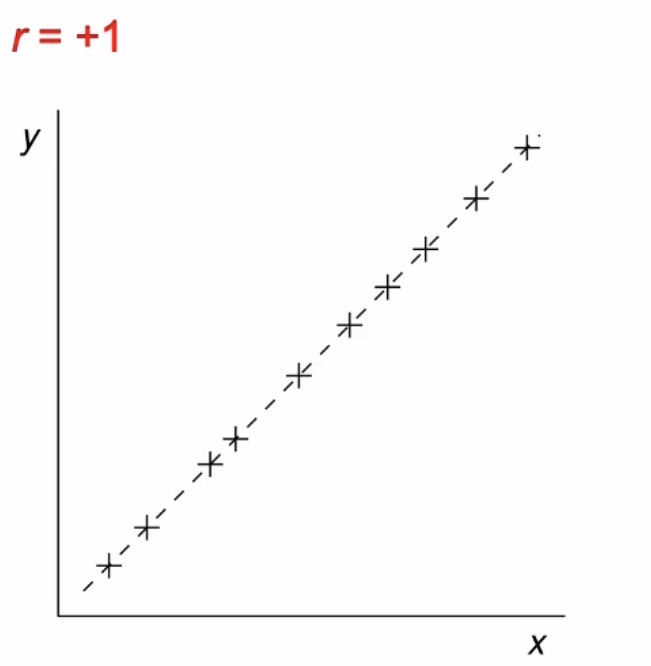
r = +1
Increase in x = increase in y
Perfect positive correlation
r = -1
perfect negative correlation
Increase in x = decrease in y
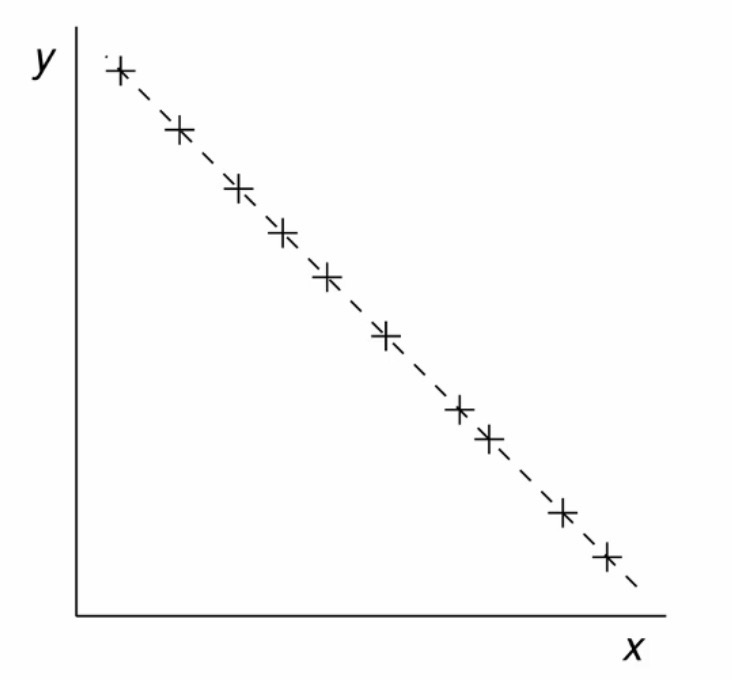
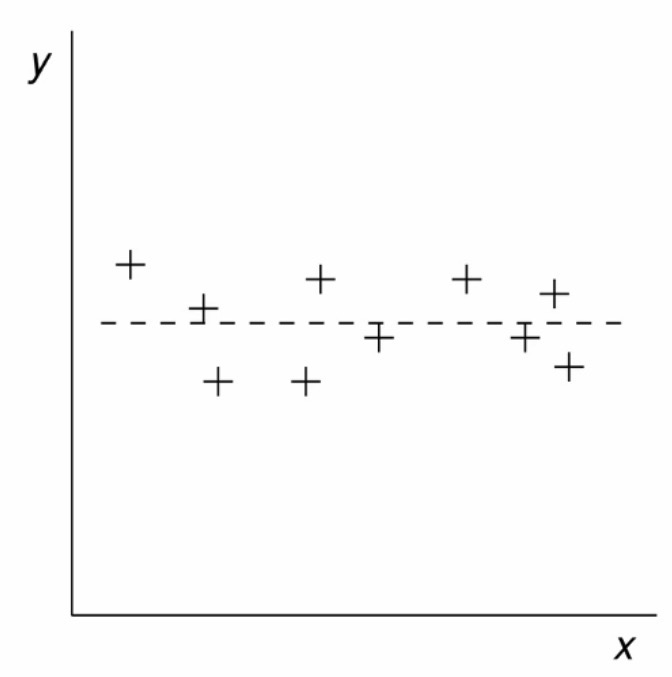
r = 0
no correlation
If Sxy is positive…
r will also be positive
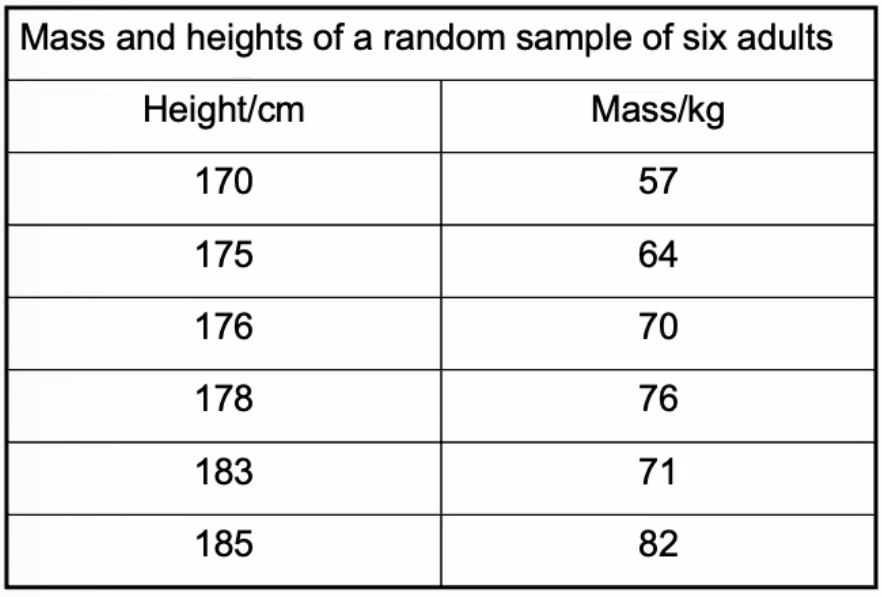
Example:
Calculate the Pearson’s correlation coefficient for the height (y) / mass (x) data
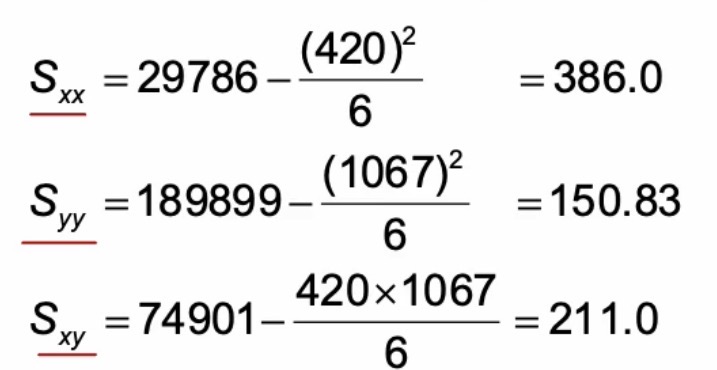
Calculate Sxx, Syy and Sxy
Calculate r
r = 211.0 / √386.0 × 150.83
r = 0.874
Correlation
r is close to 1
So we know there is a positive correlation
Evaluation
Small sample size, so how significant is this positive correlation?
So should conduct a hypothesis test to calculate the Pearson’s population correlation coefficient
Why do we conduct the hypothesis test?
To assess correlation in the whole population (ρ) » Pearson’s population correlation coefficient
Formula for t values in hypothesis test for population correlation coefficient
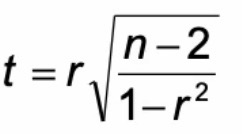
Degrees of freedom in hypothesis test
number of pairs of data - 2
Example: Hypothesis Test to calculate Pearson’s population correlation coefficient
Mass / height data, r = 0.874
Is there a significant positive correlation?
State hypotheses
H0: there is no relationship between the 2 variables
H1: there is a significant positive correlation between the 2 variables
Calculate t value
t = 0.874 x √(6 - 2 / 1- 0.8742)
t = 3.597
Look up critical t value in table
5% significance level
One-sided test
Degrees of freedom: 4
t = 2.13
If calculate t > tabulated t, reject H0 and accept H1
Conclusion and assumptions made
There is good evidence to suggest at the 5% significance level that there is a positive correlation between mass and height
Assumption: mass and height are normally distributed
Interpretations of r / ρ