Psychology Statistics Final Exam
1/95
There's no tags or description
Looks like no tags are added yet.
Name | Mastery | Learn | Test | Matching | Spaced | Call with Kai |
|---|
No study sessions yet.
96 Terms
Research Designs
-often looking for relationships between variables
Correlational Method
-coefficient; positive; negative
-2 variables related
-CORRELATION does NOT equal CAUSATION
-significance**
-measure 2 or more variables
-looks for associations
Experimental Method
-manipulation of IV
-measure the effect of DV
-use multiple groups
-random assignment
-allows for inferences about causality
-confounding variables
Non-Experimental Method
-compares groups that have not been created by the experimenter
-males versus females
-smokers versus non-smokers
-cannot make inferences on cause and effect
Descriptive Statistics
-statistical procedures used to summarize, organize, and simplify data.
Inferential Statistics
-techniques that allow us to study samples and then make generalizations about the populations from which they were selected.
Population:
-the entire group of persons or things of interest in a particular study
-all males, all college males, all QU males
Sample:
-subset taken from a larger population, that is usually intended to represent the population as a whole.
Population = Parameter
TRUE
Sample = Statistic
TRUE
Scales of Measurement
-Nominal
-Ordinal
-Ratio
-Interval
Nominal Scale:
- assignment to categories with different names
-Qualitative distinctions
-ex) Male and Female
Ordinal Scale
-ranked in ordered sequence
-know the direction but not magnitude
-ex) class rank (1 = highest GPA, 5 = lowest GPA)
Interval Scale
-no absolute zero
-distances between adjacent scores are consistent and equal (magnitude)
-IQ Test scores
Ratio Scale
-absolute zero
-height, number of errors
time taken to solve a puzzle
ratio
Academic Major
nominal
Number of calories consumed
ratio
position in major league standing
ordinal
INTERVAL scale has an equal distance on a scale; ratio does not have an equal distance
true
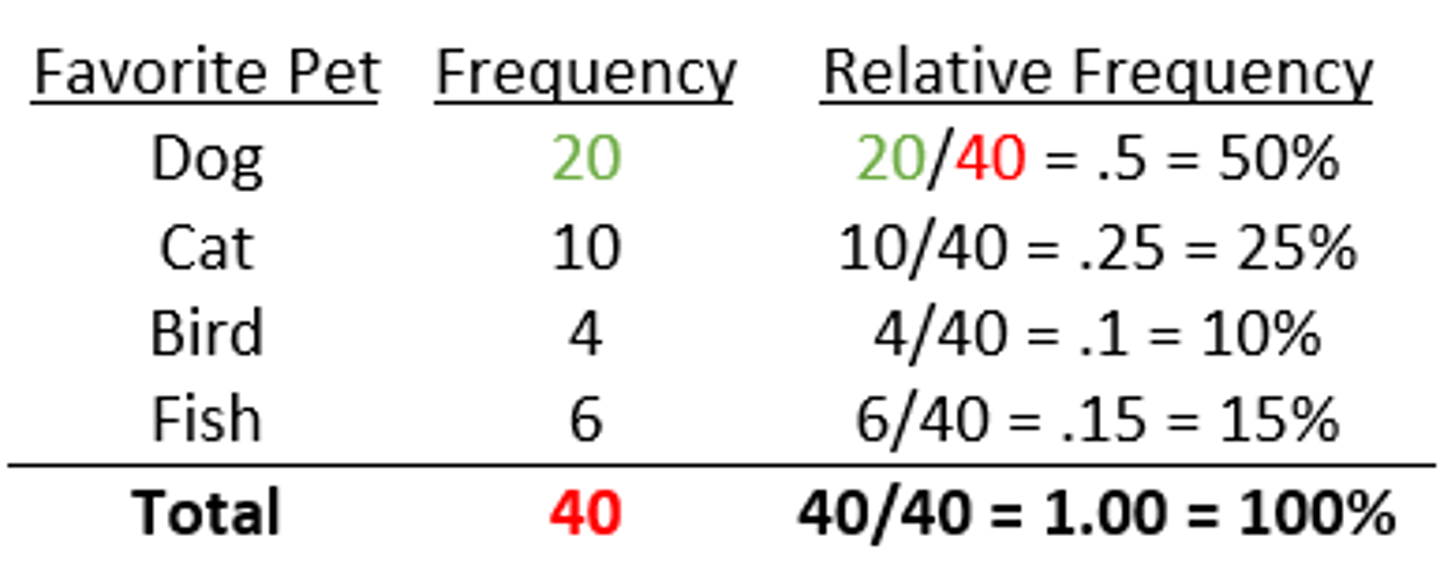
Relative Frequency:
-the proportion of total group that got each score
-the frequency divided by the sum of frequency
---Grouped Frequency Distributions use ratio scale.
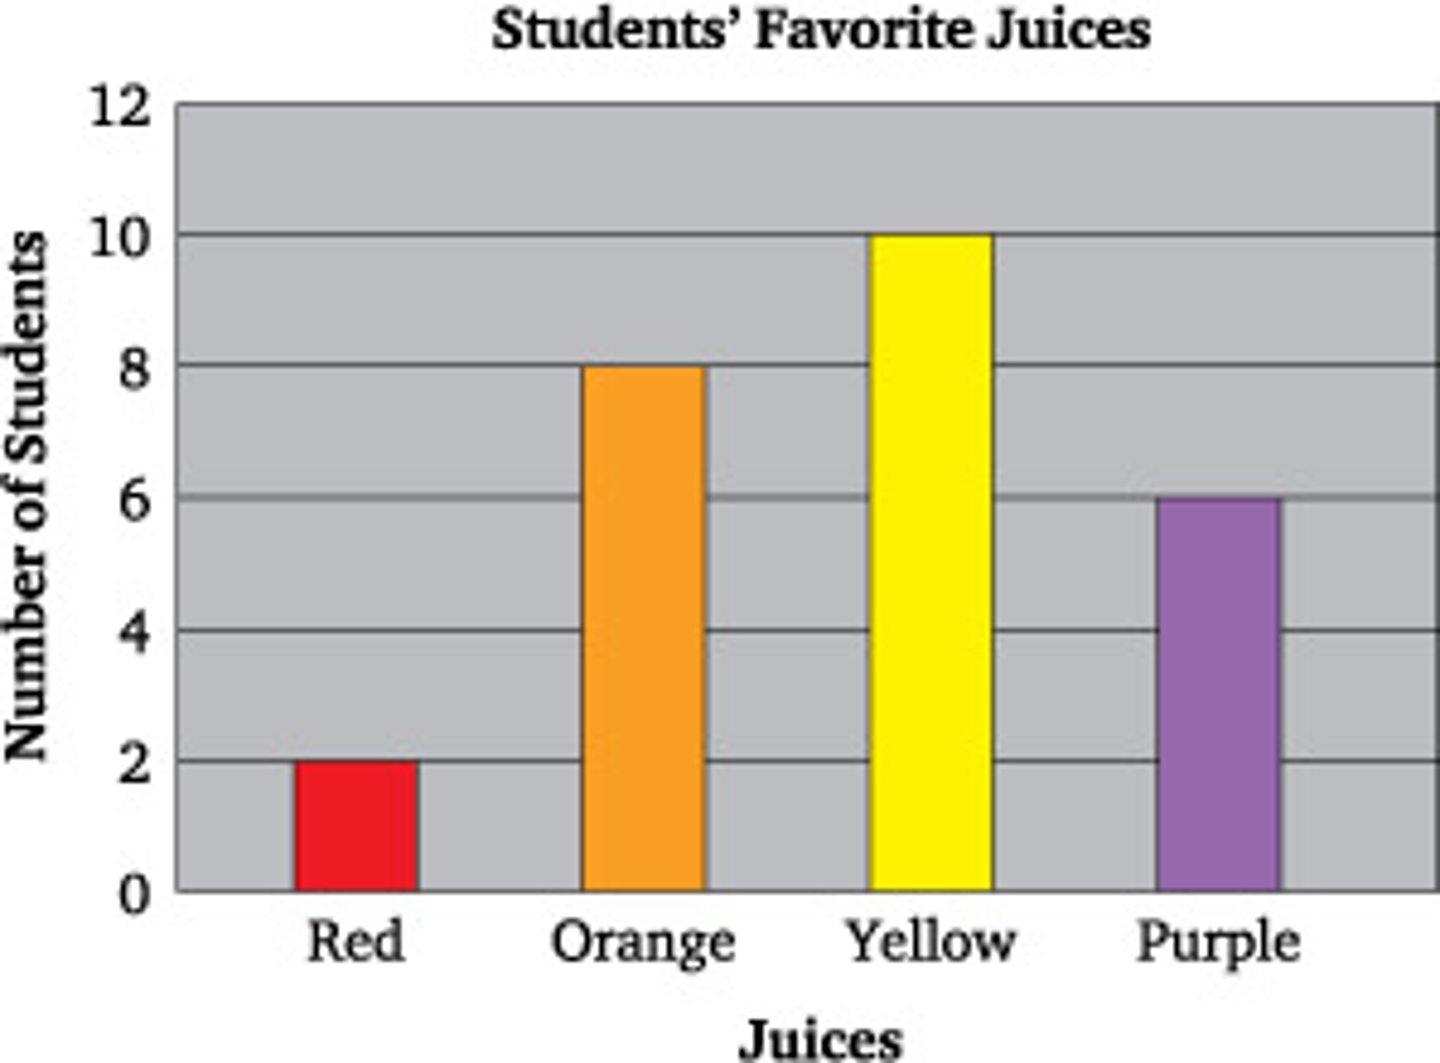
Bar Graph:
-use nominal or ordinal data
-categories go on X-axis
-frequencies on Y-axis
-bars do not touch
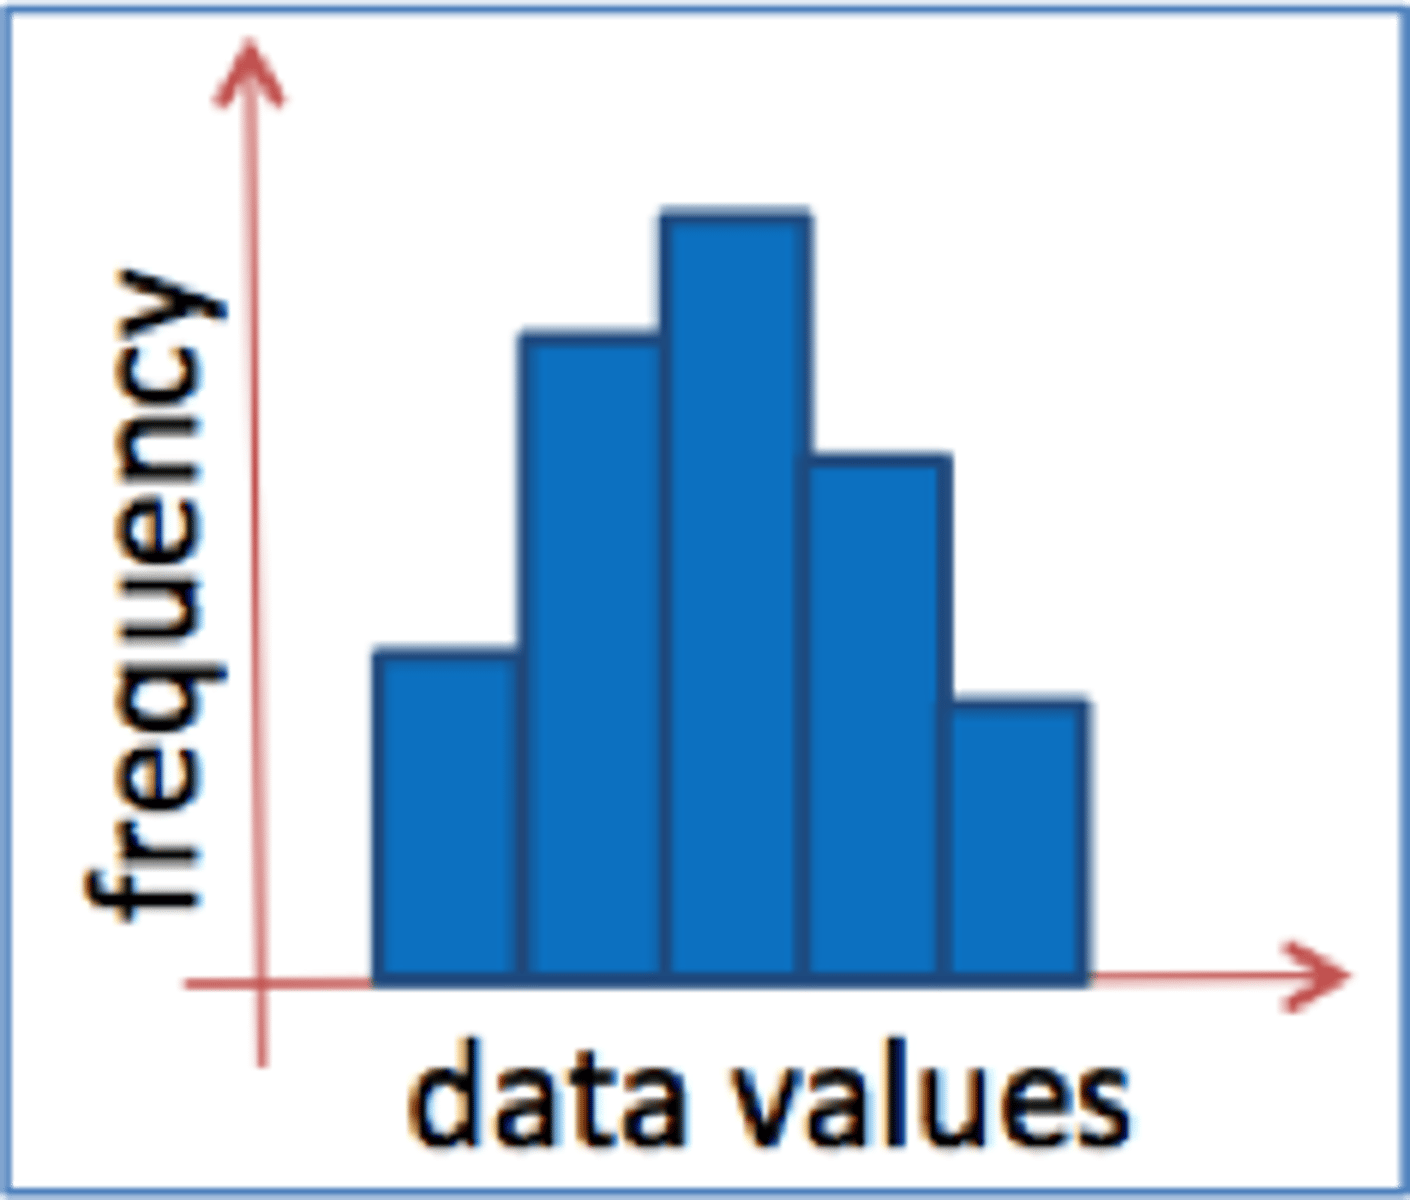
Histogram:
-similar to bar graph
-used for Interval or Ratio Data
-numerical scores on X-axis
-frequencies on Y-axis
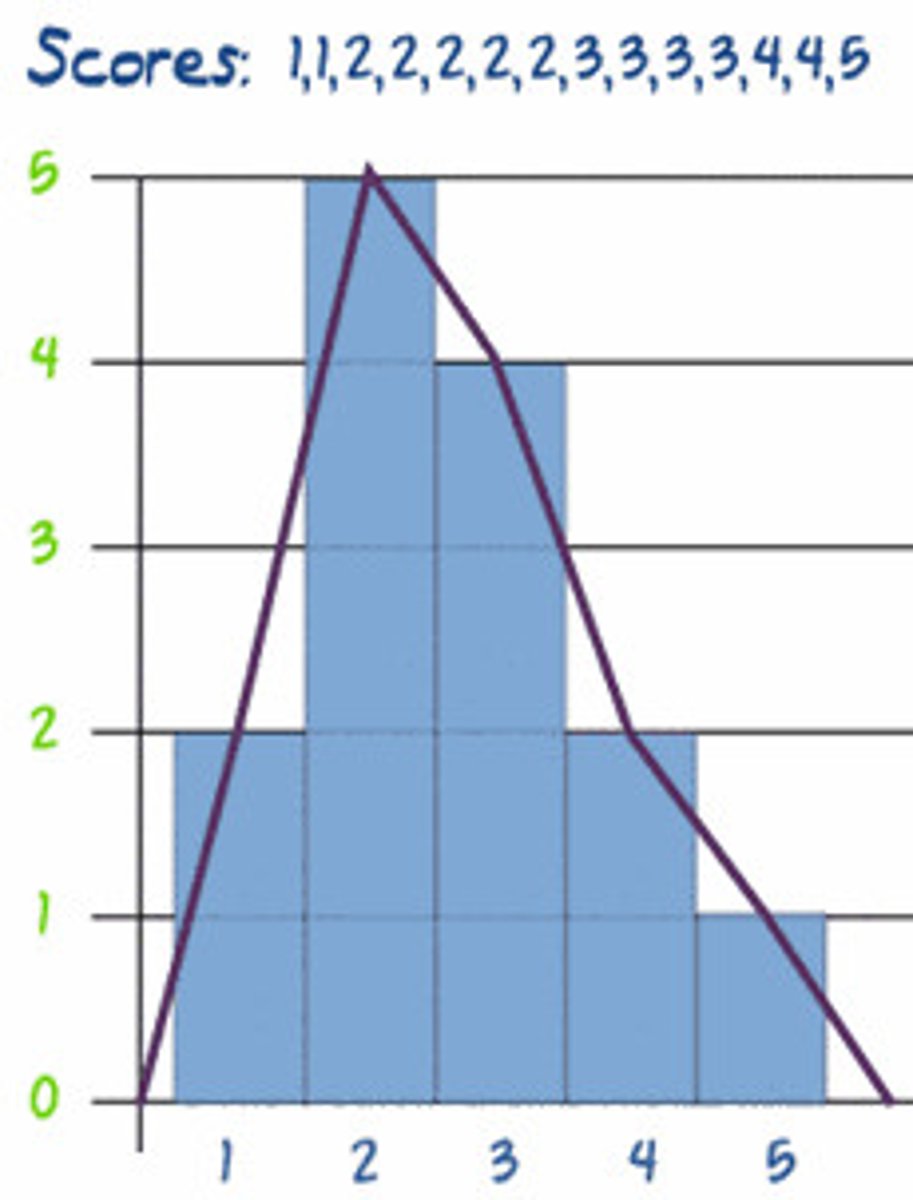
Frequency Polygon:
-if data is an interval or ratio scale
-dots at top of each bar and then connect them
-useful when plotting 2 things on the same graph
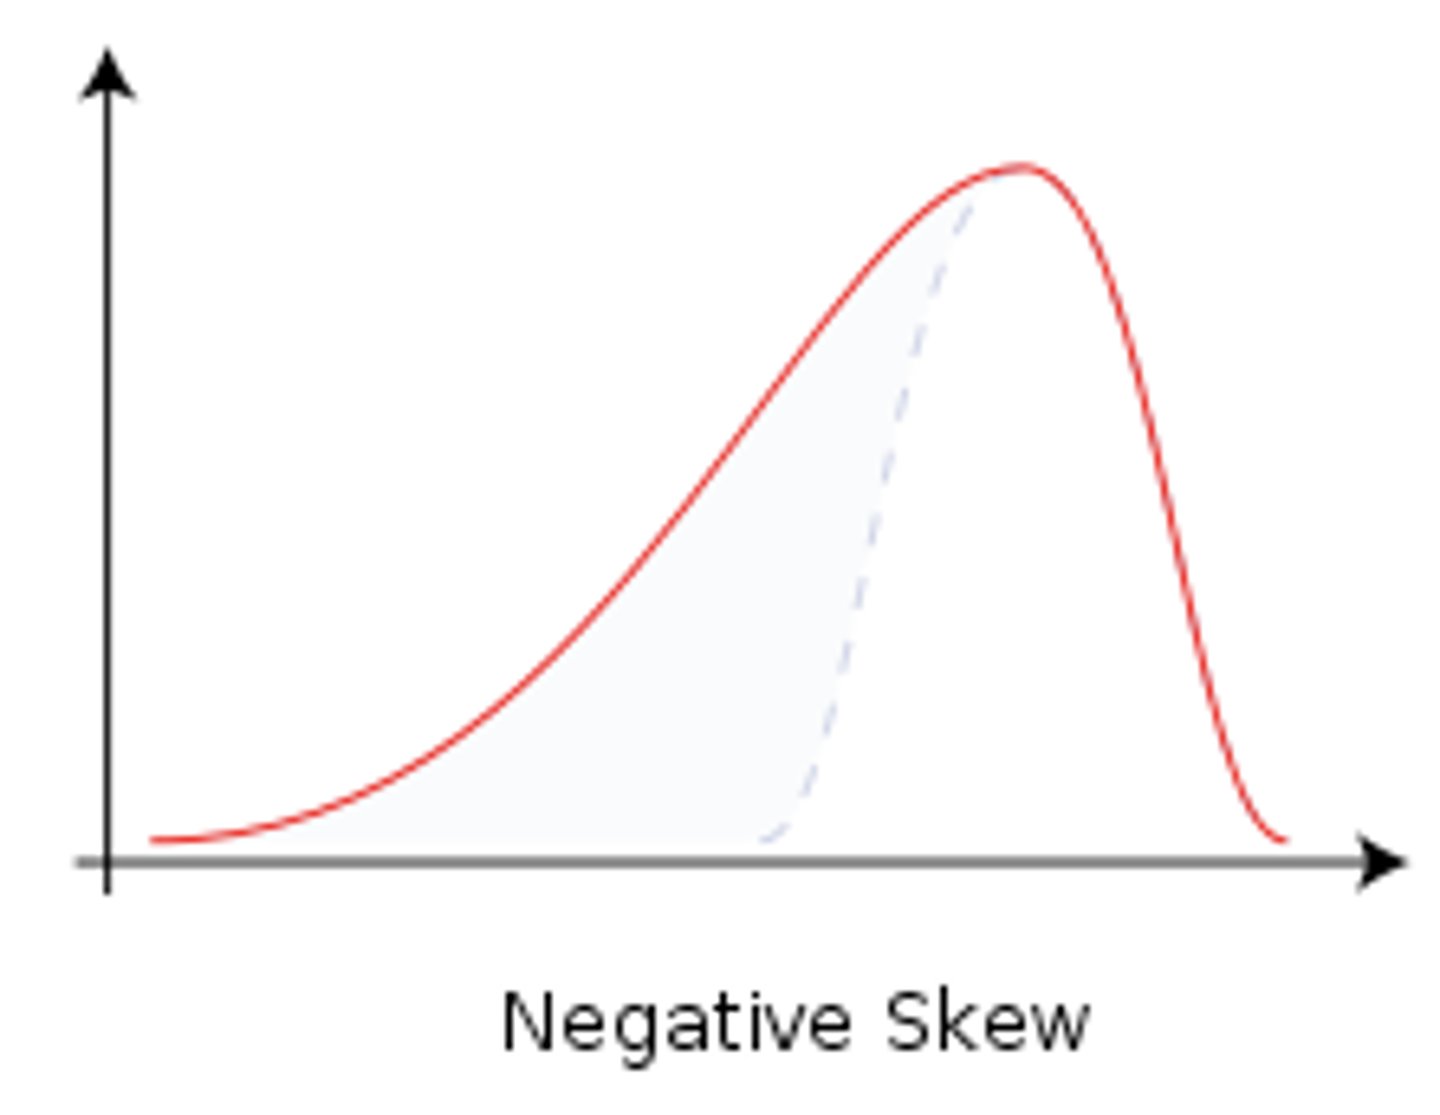
Negative Skew
=bulk of scores on the right side
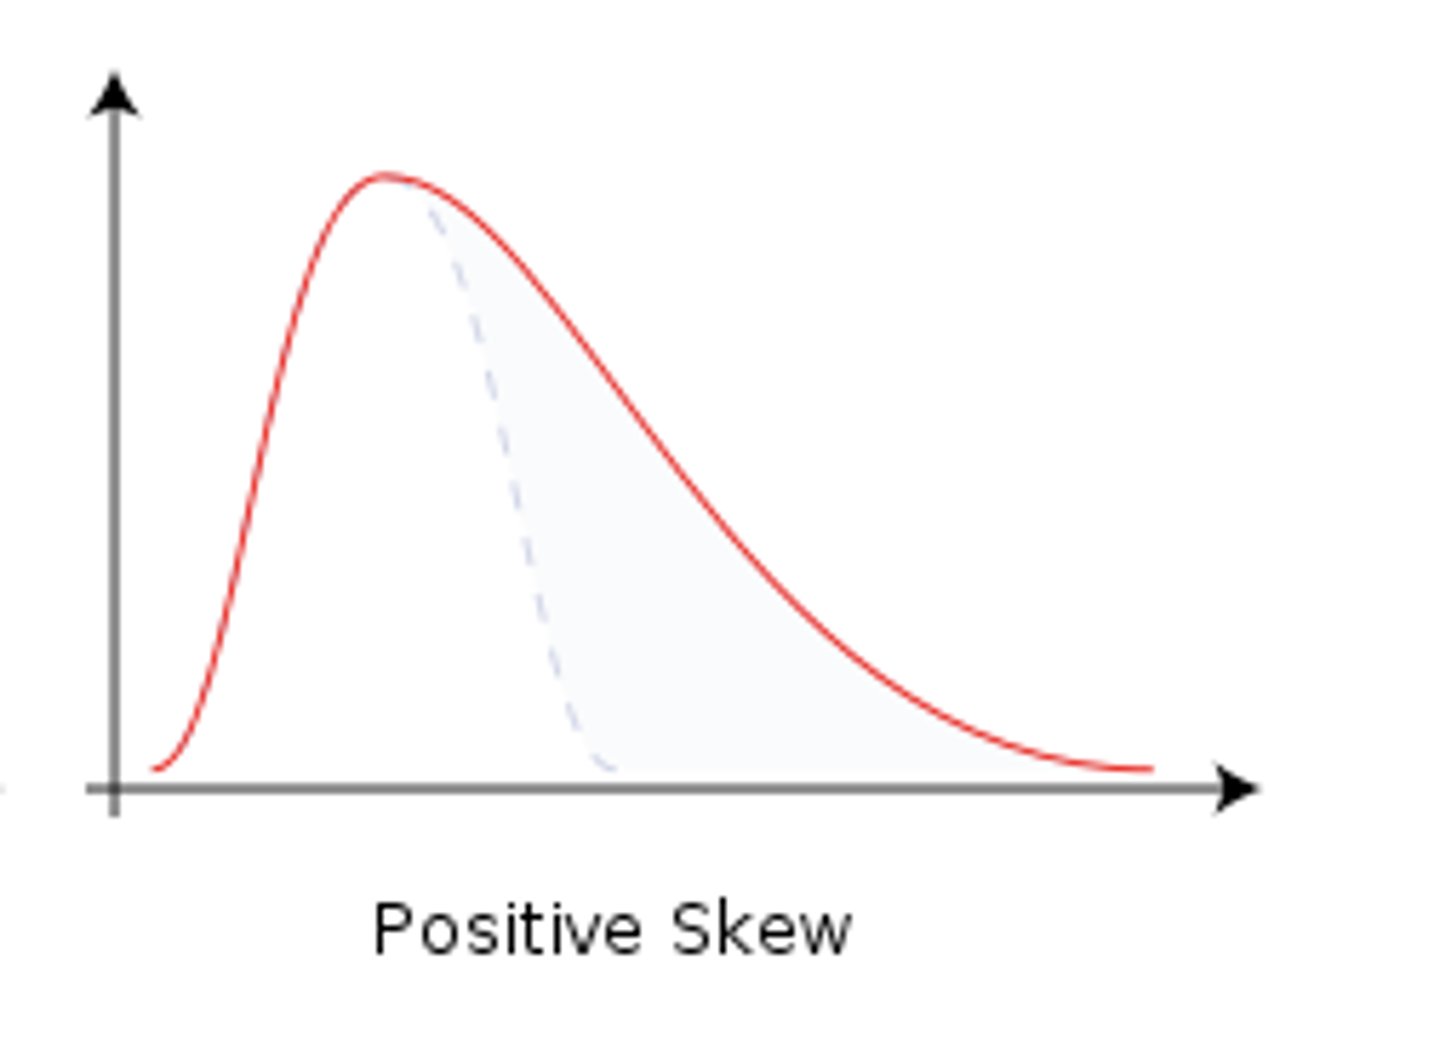
Postive Skew
= bulk of scores on the left side
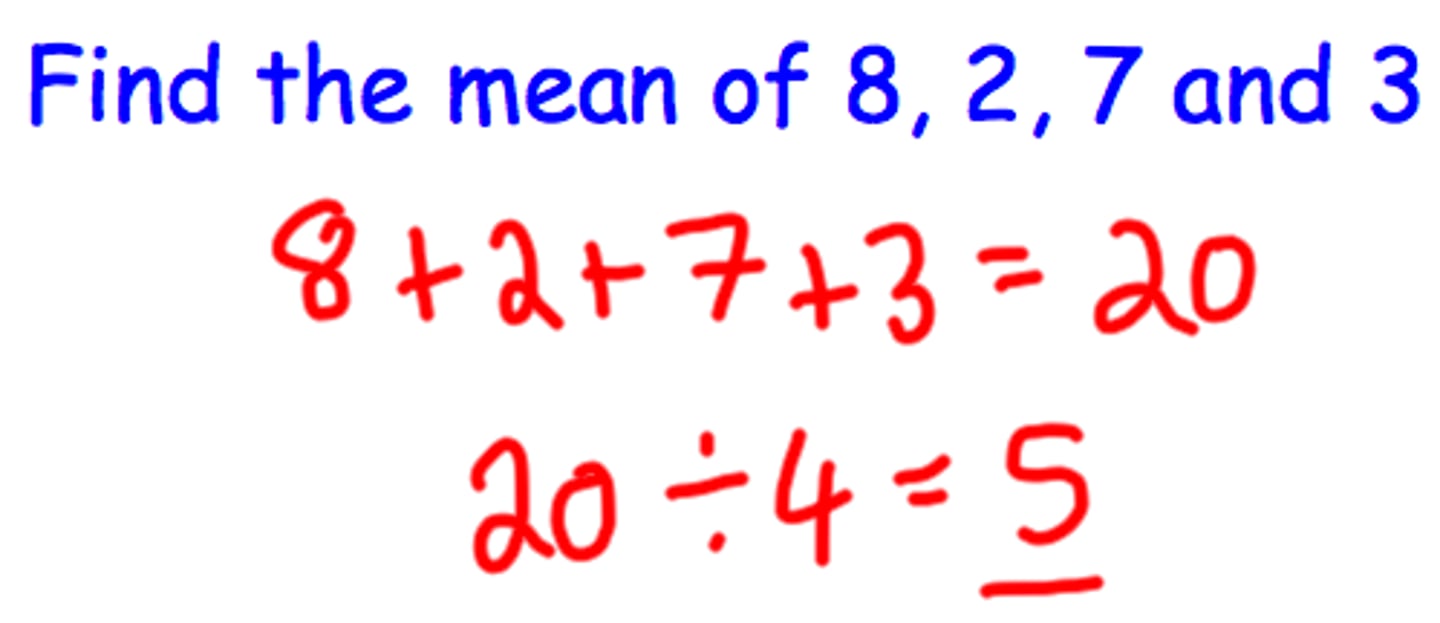
Measures of central tendency
-simplification
-find the most representative score
-mean, median, mode
Mean
-changing any score changes the mean
-adding or subtracting a constant score will change the mean by the same amount.
-there is a weighted mean
Sum of deviations must equal zero!
TRUE
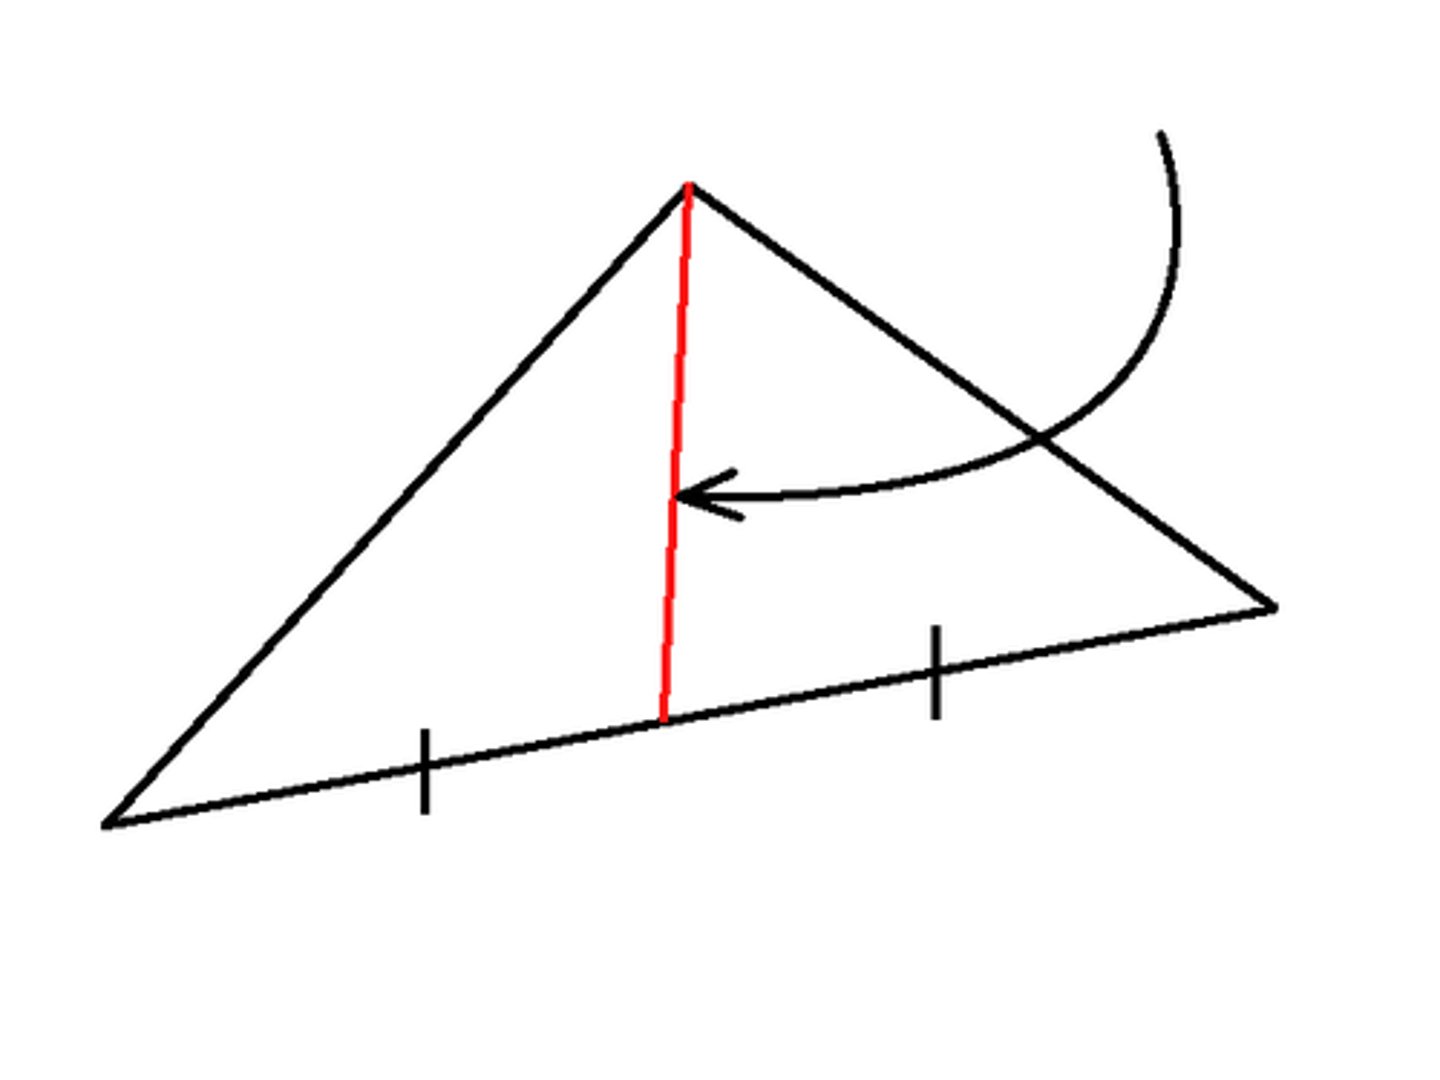
Meadian
-exact midpoint of distribution
-score at the 50th percentile
-arranges scores from low to high! (in order)
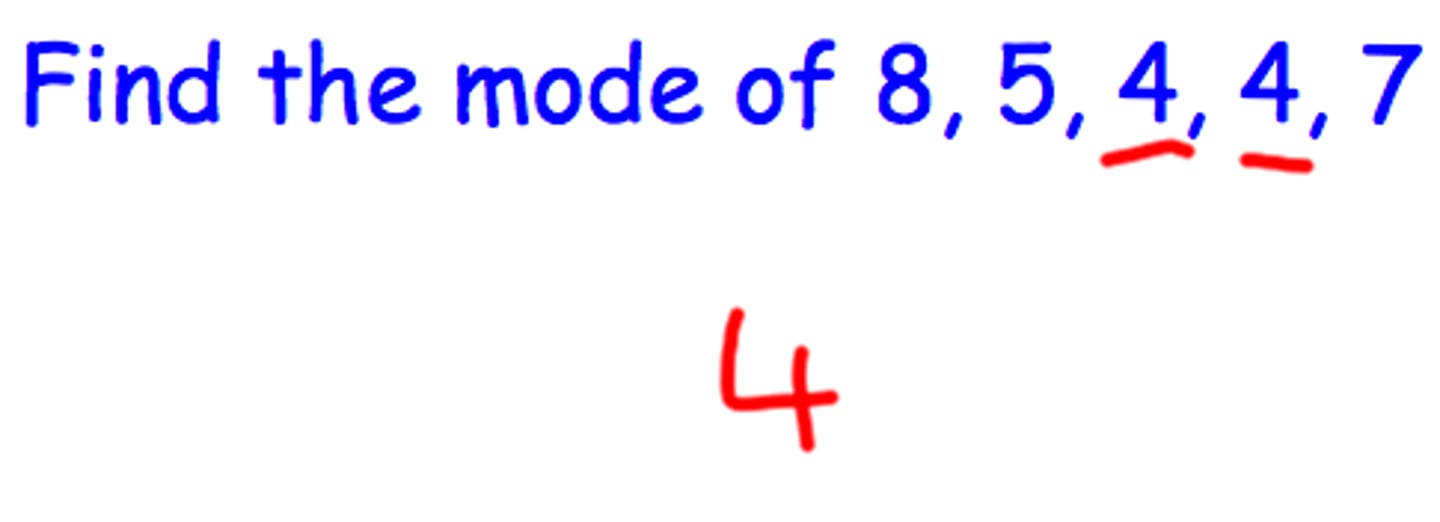
If 2 modes = biomodal
-bar graph or histogram
-interval or ratio data
Use the mean for extreme scores or skewed distributions
TRUE
When the distribution is bimodal
Use mode
With ordinal data
Use Median
With Nominal Data
Use mode
Mean:
-reflects all scores
-sensitive to extreme scores
-cannot be used with nominal data
-should not be used with ordinal data
-often not an "actual" (reflected) score
Median
-can be used with ordinal, ratio, or interval data
-not affected by extreme scores
-can be used with open-ended distributions
-can be used with undetermined values
-does not reflect all scores
-less good for inferential statistics
Mode
-easy to find
-can be used with nominal scales
-often when data is discrete
-somewhat uninformative
-not useful for inferential statistics
Range
-crudest measure of variability
-difference between the highest and lowest score
Special Versions of Range:
1) Interquartile Range --> Captures 50th percentile
-difference between the score at the 75h percentile and 25th percentile
2) Variation-Semi-Interquartile Range (IQ12)
-commonly used with median
Variance
-want to quantify how much, on average, a score differs from the mean.
-could compute a deviation score for each and then average the deviations
-square the deviations, then average
Variance:
-average (or mean) of the squared deviations.
Standard deviation
-the square of the variance
Larger the standard deviation the more spread-out
Smaller the standard deviation the closer to the mean
TRUE
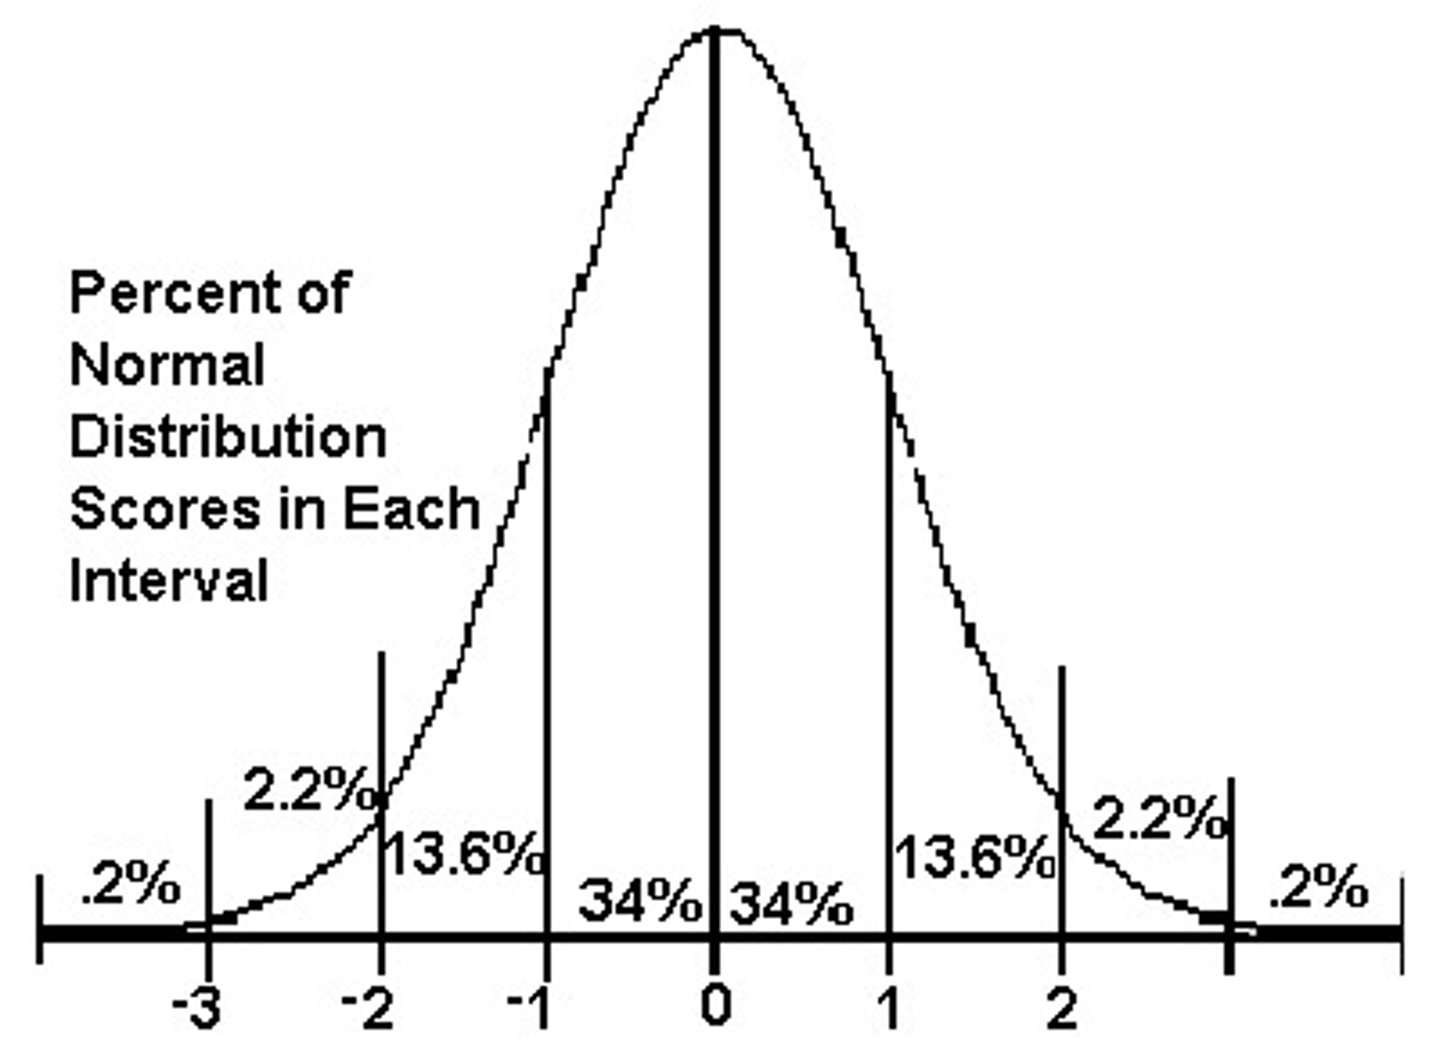
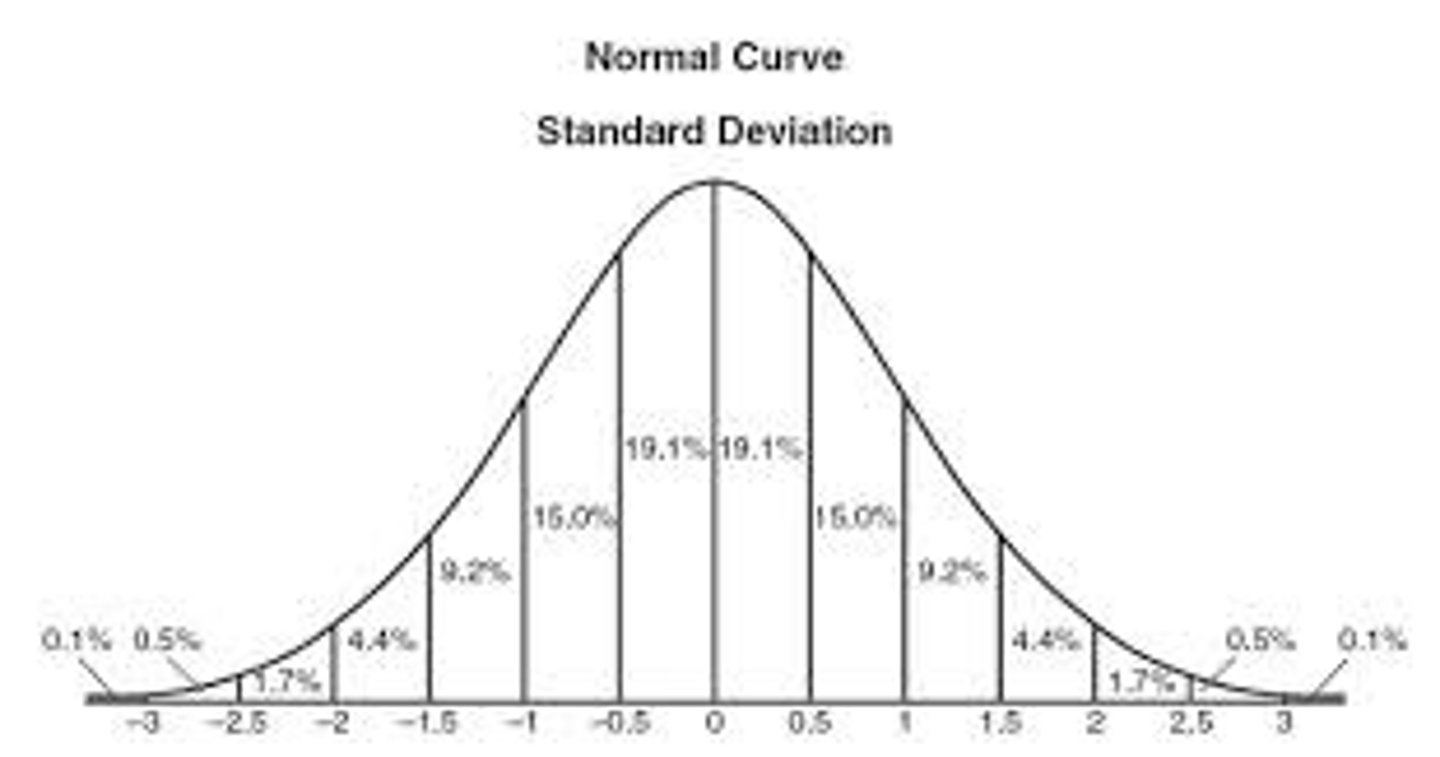
Properties of Standard Deviation
+ or - a constant to every score does not change the standard deviation
70% of scores are within 1 standard deviation of mean
95% of scores are within 2 standard deviations of mean
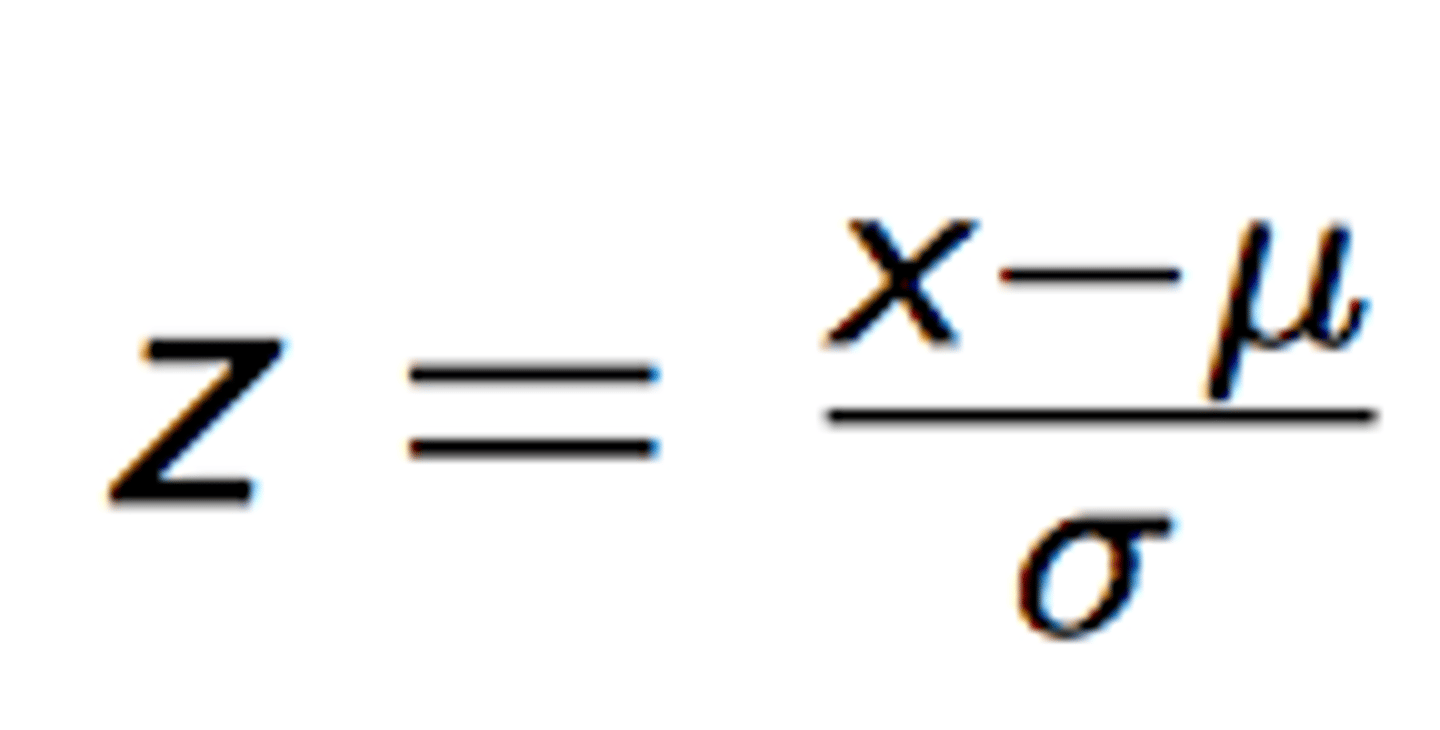
Z-SCORES:
the sign tells you if you are above or below the mean
the number indicates how many standard deviations away from the mean
Z-Distribution
1) Mean of z-distribution always = 0
2) Standard deviation of z-distribution = 1
3) Shape of z-distribution is same shape as the original X-distribution
Z-Distribution
Probability
=defined as a proportion
-inferential statistics relies on this
-inferences about populations based upon samples
Normal Curve
-important distribution
-symmetrical
Small Portion = Tail
Larger Portion = Body
True
bigger samples, closer to mean (approx. normal)
TRUE
Distribution of Sample Means
-called the expected value of M
-Um = U
-standard error of M = standard deviation
As n increases, standard error of M decreases
According to the Central Limit Theorem, the sampling distribution tends to be normally distributed as long as the sample size is large enough (>30)
True
Hypothesis Testing
Null (Ho) : generally nothing is going on; same as untreated population; no effect.
Alt (H1): somthing is going on; different from untreated population; there is an effect.
Critical region = region of rejection
TRUE
If null is true, we fail to reject the null.
True
If null is rejected, there is a significant result, so there is somthing going on
True
One-Tailed Tests
there is a direction (DIRECTIONAL)
Assumptions of Z-Test
-random sampling
-indepdent observations
-standard deviation ISN'T changed by treatment
-sampling distributin must be normal
-data being measured must be in interval or ratio form.
Errors:
-when null is rejected, sample mean is unlikely
-treatment has an effect
Type 1 Error:
-reject the null, but shouldn't have, because the treatment wasn't really having an effect
-caused by alpha
-alpha is set to minimize this
Type 2 Error:
-fail to reject the null, but we should have because the treatment was having an effect.
-caused by beta
Effect Size
-Cohen's D
Power:
-defined as the probability that you will correctly reject the null hypothesis
-usually calculated before the study to determine if it is likely to be successful
1-Sample T Test
-have samples to make t-statistic
Variance
s^2
Standard Deviation
s
As n gets bigger, CV get closer to the z-ones (normal curve)
true
**Remember to label the (mu's) with the variable
Sm = estimated standard error
true
Assumptions of t-tests
-independent observations
-population sampled is normal
-effect sizes (Cohen's D)
Confidence Intervals
try to estimate the population mean after 1 treatment
-create a range of values centered around mu that we believe includes it
2 Sample T-Tests
-independent samples
-between subjects design
If null is true M1 - M2 would cluster around 0, but would not all = 0
True
H0: u1 = u2; u1 - u2 = 0
H1: u1 \= u2; u1-u2 \= 0
2-sample t test
Assumptions for t-test
1) 2 samples are independent
2) 2 populations are normally distributed
3) 2 populations have equal variances
4) data = interval or ratio form
USED POOLED VARIANCE FOR UNEQUAL SAMPLE SIZES
*********
Repeated measures design (within-subjects)
-test sample people on a variable more than once
-called related samples t-test or dependent t test
Comparing Independent T-Test and Related T-Test
-both compare 2 samples to see if means are =
-calculation of standard error differs
Repeated Measures Design
-number of subjects needed is less
-can study changes over time
-reduces problems caused by individual differences
-careful of problems caused by measuring 2x
-matched/paired variables
parametric:
-inferences about parameters about means
-interval or ratio form
-cannot use ordinal data in parametric test
ANOVA
analysis of variance;
-simplest case --> single factor, independent measures design
Factor
-independent or quasi-indepdent
Variance Between Groups
-could be due to treatment
-could be due to chance
Variance Within Groups
-due to chance
CALLED THE ERROR TERM
F-Stastic
-not doing anything; close to 1
-if the treatment does something, F ratio gets larger
-can never be NEGATIVE
H0: u1=u2=u3; There is no effect
H1: "At least 1 u is different"
Post Hoc Tests
-significant F; just tells if there's a difference somewhere
-Tukey's
If sig is less than alpha, the null is rejected
True
ANOVA effect size
n^2 (eta)
Assumptions
-observations are independent
-populations are normally distributed
-populations have equal variances
-data are in ratio or interval form
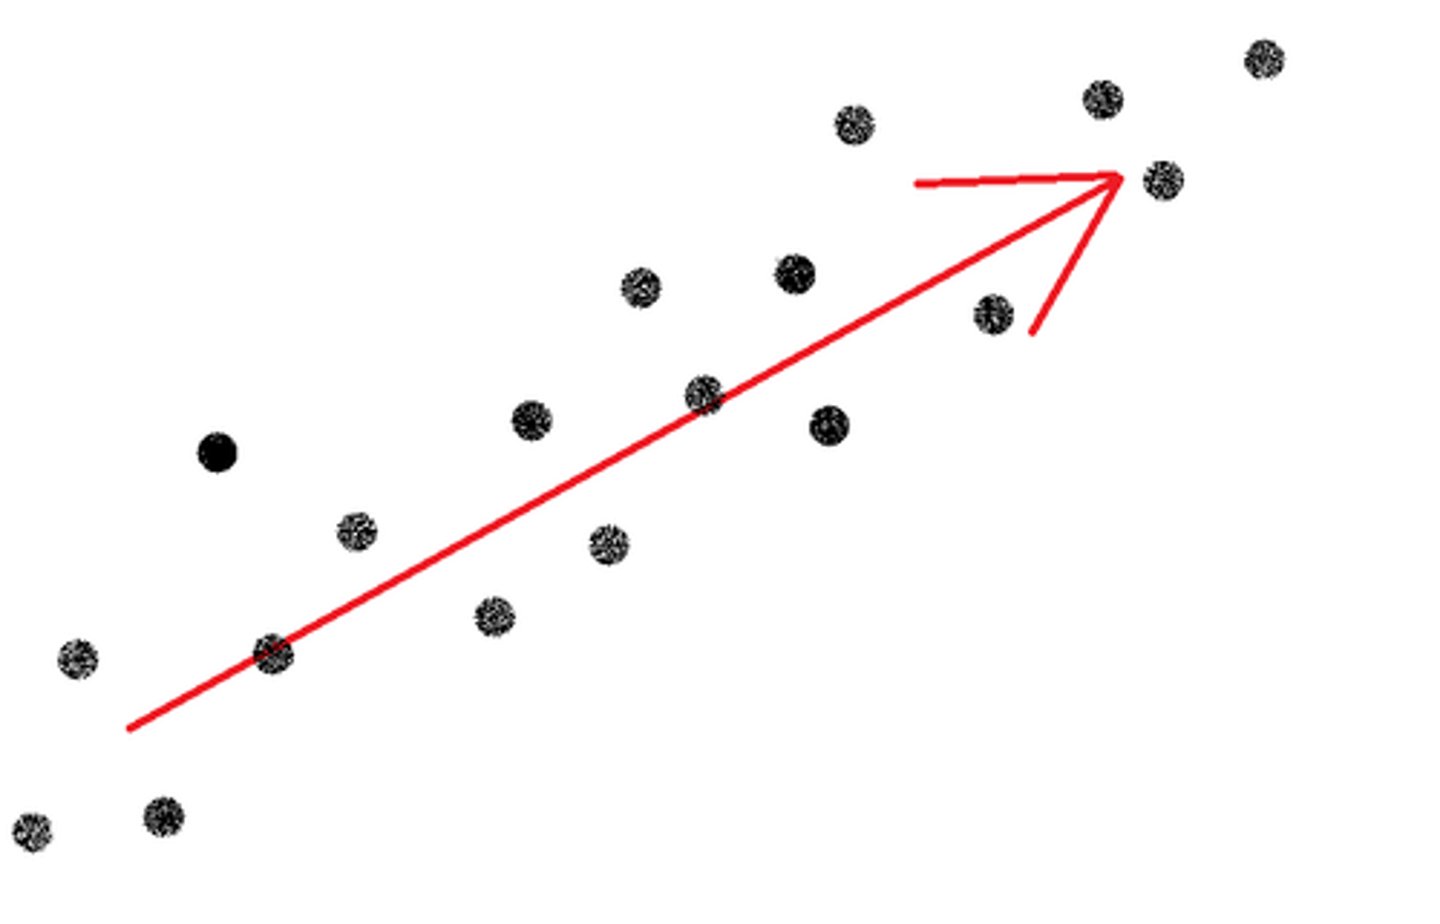
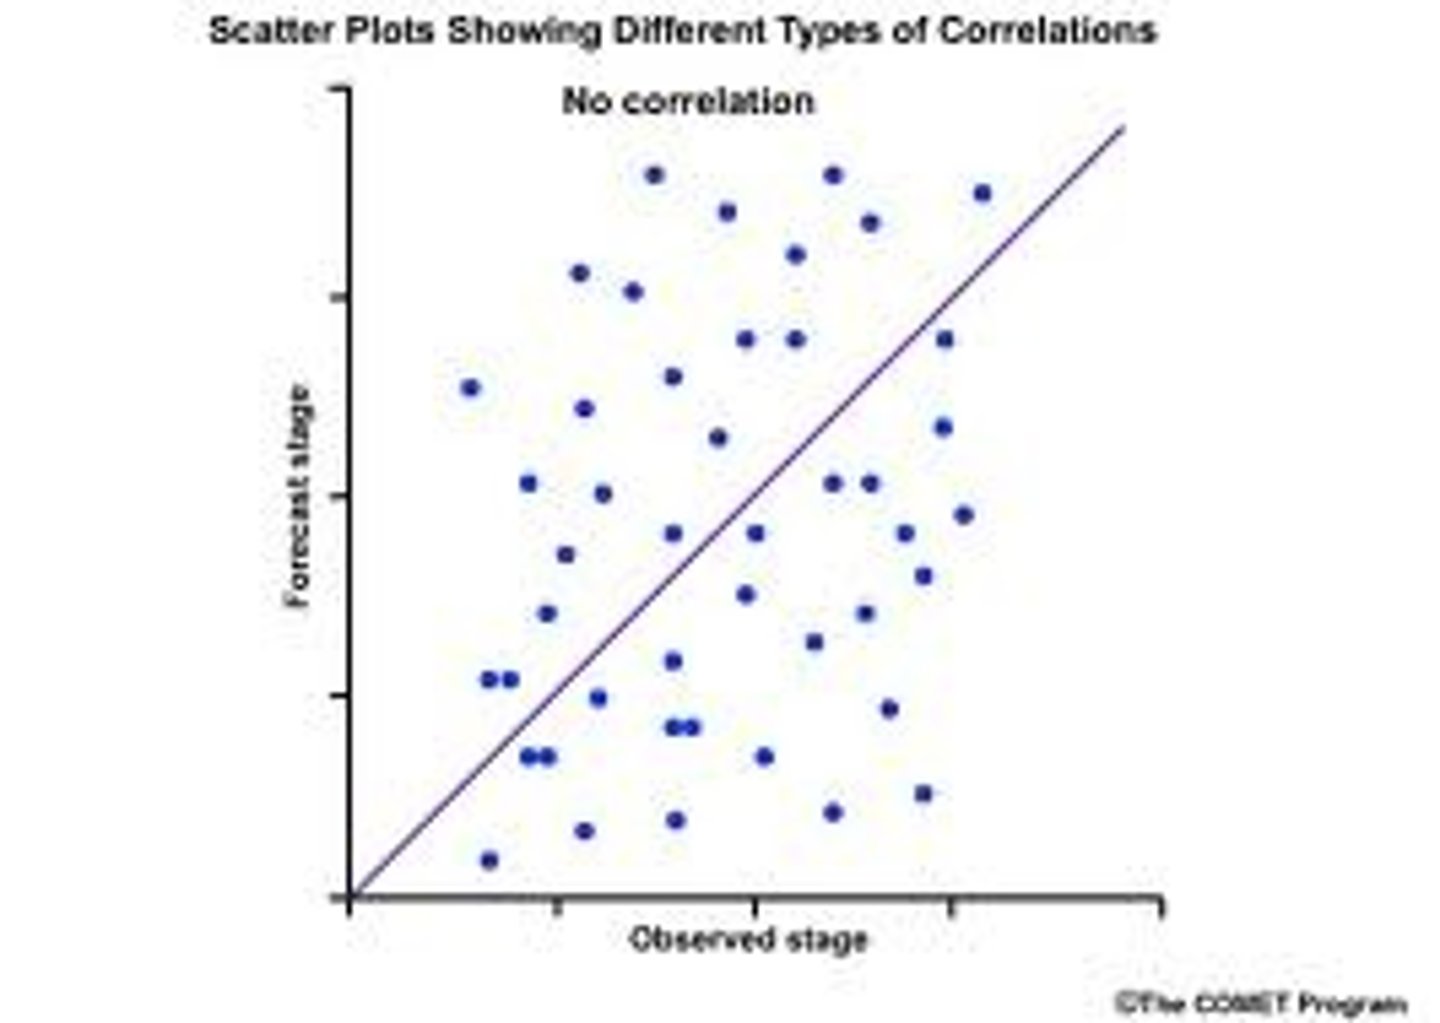
Correlation:
relationship
-Pearson (r)
-both measured on interval or ratio scale
-r is either positive or negative
-r is between -1 and +1; stronger the relationship
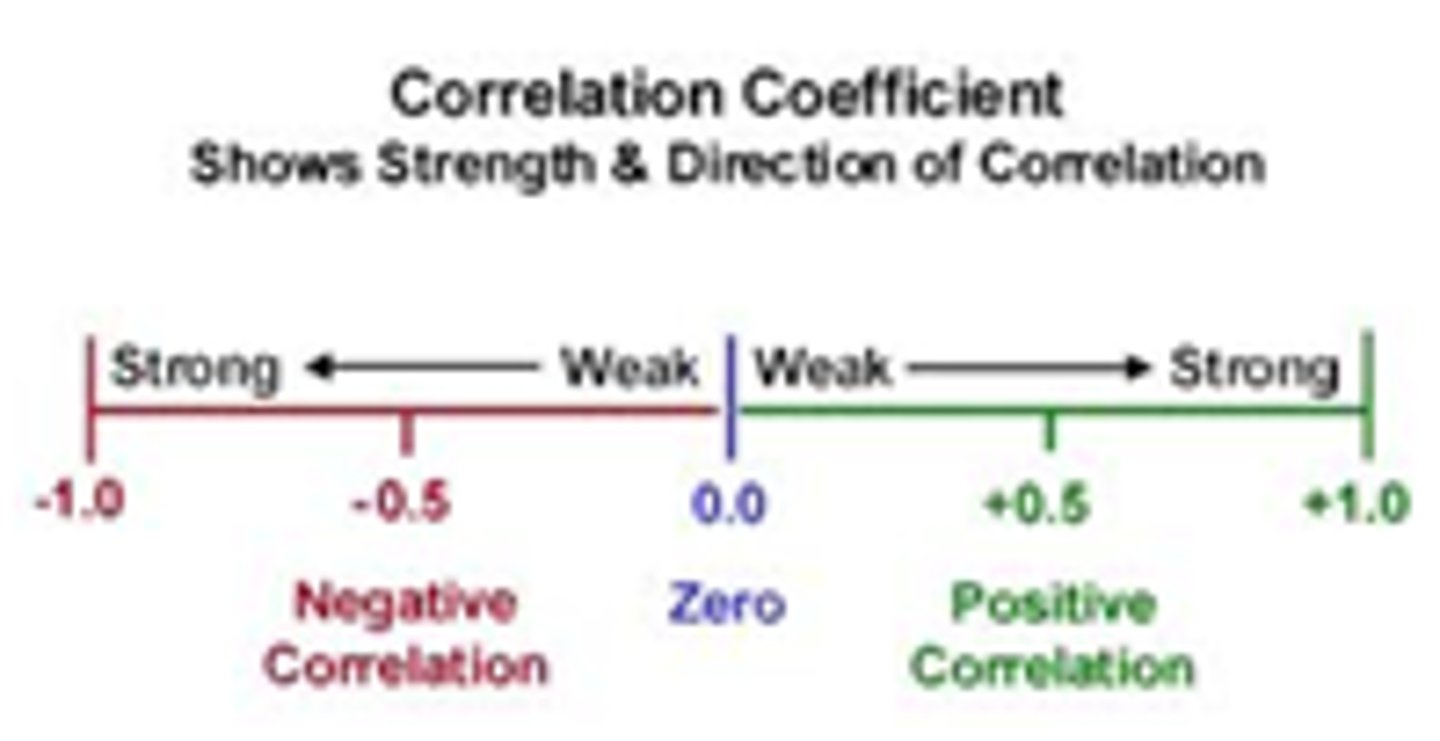
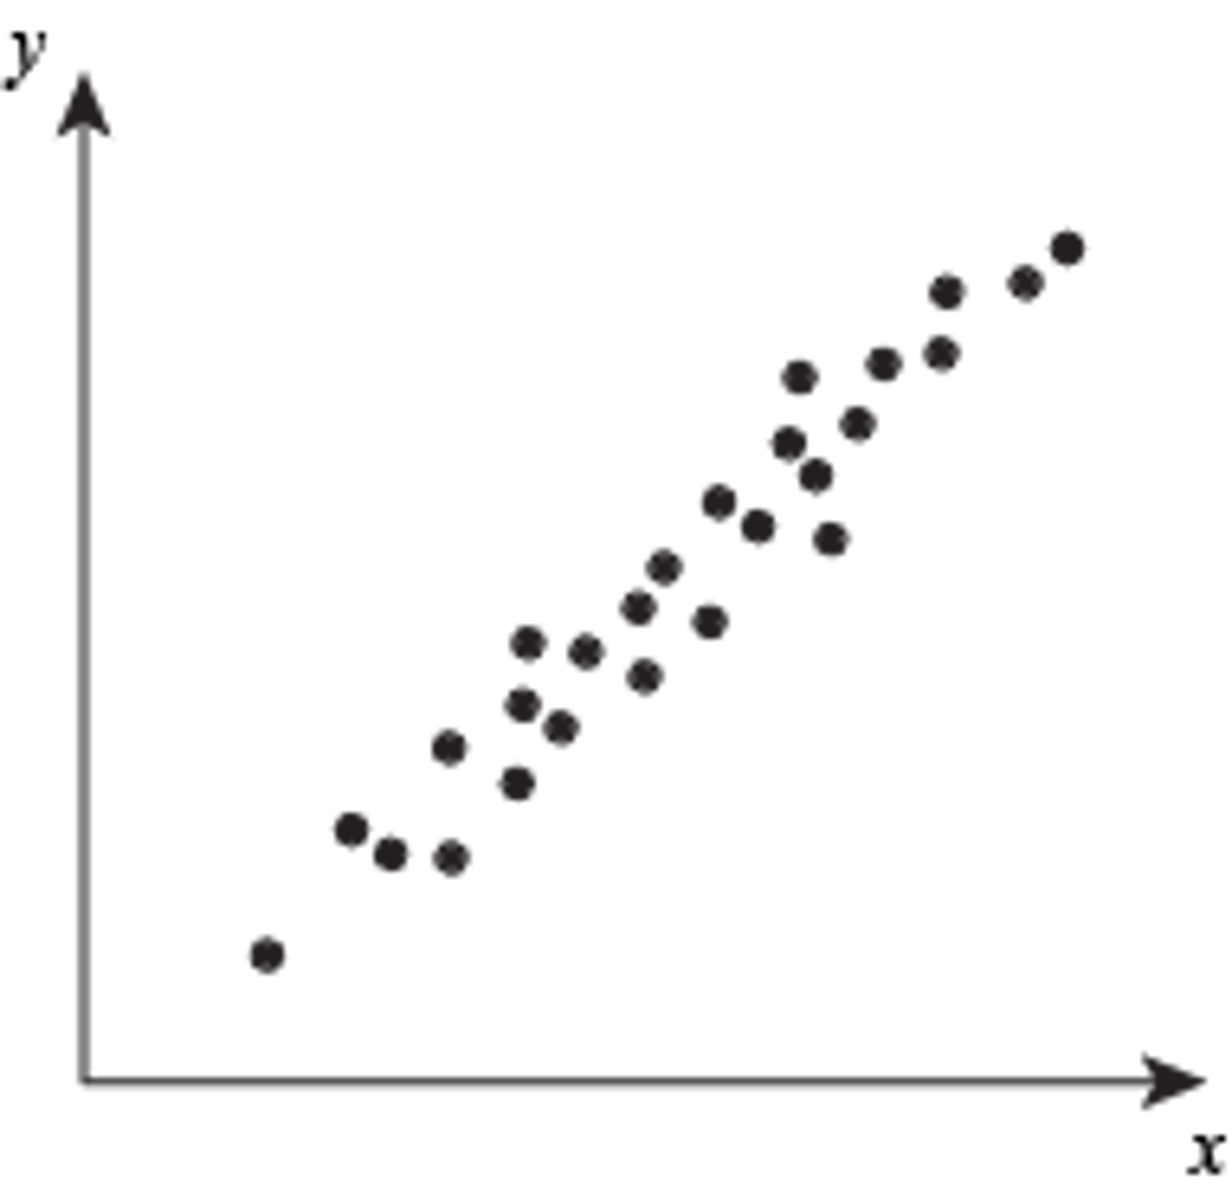
Positive correlation
as one goes up, the other goes up as well
as one goes down, the other goes down as well
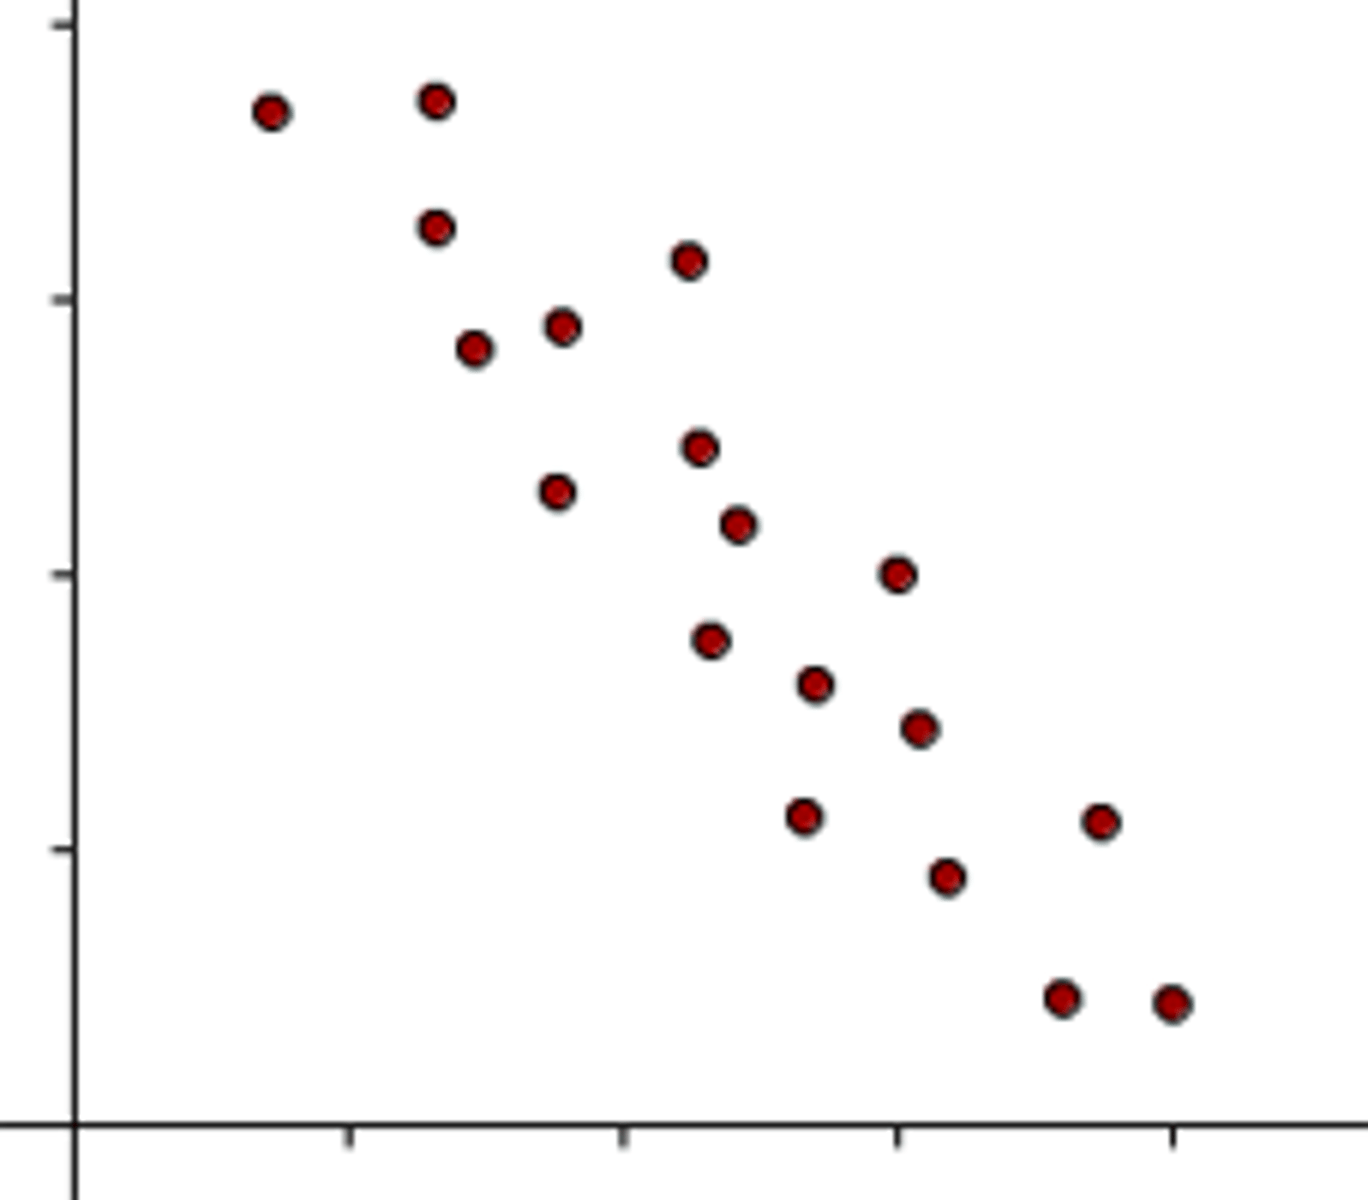
Negative correlation
as one goes down, the other goes up
0 (or close to it) = no relationship
True
Linear Regression
-1 goal is to make predictions and find a relationship that provides the best fit of the data
-can use multiple regression
-there is error; it is not likely to be a perfect correlation