QUIZ 2: B7 Tools, N7 Tools, Root Cause Analysis and Risk Analysis tools
 Call Kai
 Learn
Learn Practice Test
 Spaced Repetition
 Match
Match Flashcards
 Knowt Play
1/42

There's no tags or description
Looks like no tags are added yet.
Name | Mastery | Learn | Test | Matching | Spaced | Call with Kai | Chat |
|---|
No analytics yet
Send a link to your students to track their progress
43 Terms
Statistics
1903
Bell Telephone
control chart
_ is a science concerned with the collection, organization, analysis, interpretation, and presentation of data. It is essential for quality and implementing a continuous impprovement philosophy
It dates back to (year) at the _________ system. In the 1920s, labs thought statistical tools would have applications in the factory and experimented with statistical sampling, leading to development of (type of chart).
experiment
outcome
sample space
Probability
BASIC PROBABILITY CONCEPTS
An _ is a process that results in some outcome.
The _ of an experiment is a result that we observe
E.g.: the number of defective parts in the sample or the length of time until the bulb fails.
The collection of all possible outcomes of an experiment is called the _.
_ is the likelihood that an outcome occurs.
“The Old Seven." "The First Seven." "The Basic Seven."
Kaoru Ishikawa
quality circles
Cause-and-effect diagram
Check sheet
Control chart
Histogram
Pareto chart
Scatter diagram
Stratification
The 7 Basic Quality Tools for Process Improvement
Quality pros have many names for these seven basic tools of quality, first emphasized by (name), a professor of engineering at Tokyo University and the father of "(concept)."
_ (also called Ishikawa or fishbone diagrams): Identifies many possible causes for an effect or problem and sorts ideas into useful categories.
_ A structured, prepared form for collecting and analyzing data; a generic tool that can be adapted for a wide variety of purposes.
_ Graph used to study how a process changes over time. Comparing current data to historical control limits leads to conclusions about whether the process variation is consistent (in control) or is unpredictable (out of control, affected by special causes of variation).
_ The most commonly used graph for showing frequency distributions, or how often each different value in a set of data occurs
_ A bar graph that shows which factors are more significant.
_ Graphs pairs of numerical data, one variable on each axis, to look for a relationship.
_ A technique that separates data gathered from a variety of sources so that patterns can be seen (some lists replace stratification with flowchart or run chart).
Ishikawa diagram and cause and effect diagram
Cause
problem
The fishbone diagram is also called as (2 other names). It is a (cause/risk) analysis tool, identifying many possible causes for an effect.
PROCEDURE:
Agree on a _ statement.
Brainstorm the major categories.
Ask why does this happen about each cause
Check sheet
Is also called as defect concentration diagram
A _ is a structured, prepared form for collecting and analyzing data. This is a generic data collection and analysis tool that can be adapted for a wide variety of purposes and is considered one of the seven basic quality tools.
WHEN TO USE:
When data can be observed and collected repeatedly by the same person or at the same location
When collecting data on the frequency or patterns of events, problems, defects, defect location, defect causes, or similar issues
When collecting data from a production process
PROCEDURE
Decide on event or problem to observe and provide operational definitions
Decide when data is collected and how long, then design the form (set it up so checks or x’s can be made)
Label all spaces and record each occurrence
Control chart
central line
upper line
lower line
Also called: Shewhart chart, statistical process control chart
The _ is a graph used to study how a process changes over time. Data are plotted in time order.
COMPONENTS
_ for the average
an _ for the upper control limit, and a
_ for the lower control limit.
These lines are determined from historical data.
GOAL: Find out if process variation is consistent or unpredictable
2 types of process variations
common cause (natural variation)
special cause (unpredictable variation)
When are they used?
controlling ongoing processes by finding and correcting problems
predicting expected range of outcomes
if quality improvement project should aim to prevent problems or to make fundamental changes to the process
Histogram
A frequency distribution that shows how often each different value in a set of data occurs. (name) is the most commonly used graph to show frequency distributions. It looks very much like a bar chart, but there are important differences between them. This helpful data collection and analysis tool is considered one of the seven basic quality fools.
WHEN TO USE ONE
The data are numerical
You want to see the shape of the data's distribution, especially when determining whether the output of a process is distributed approximately normally
Analyzing whether a process can meet the customer's requirements
Pareto chart
frequency or cost
longest
shortest
A (chart name) is a bar graph. The lengths of the bars represent _ (time or money), and are arranged with (longest/shortest) bars on the left and the (longest/shortest) to the right. In this way the chart visually depicts which situations are more significant. This cause analysis tool is considered one of the seven basic quality tools.
WHEN TO USE ONE:
when analyzing frequency of problems
when you want to focus on the most significant problem
PROCEDURE:
Decide categories to be used
Decide correct measurement
Decide period of time (cycle, day, or week?)
Subtotal measurements
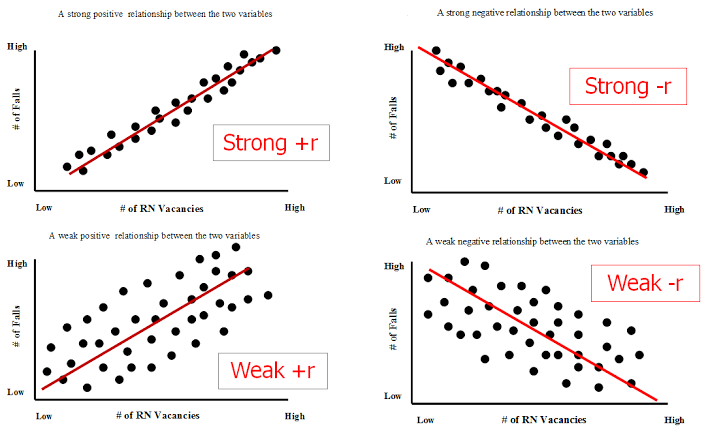
scatter diagram
tighter
horizontal
vertical
A _ (also known as a scatter plot or X-Y graph) is a tool used to visualize the relationship between two numerical variables.
Key Characteristics
Data Representation: It graphs pairs of numerical data points, with one variable on the horizontal axis (x) and the other on the vertical axis (y).
Purpose: It is primarily used to identify correlations or patterns between variables.
Visual Cues:
If variables are correlated, points will cluster along a line or curve.
The (looser/tighter) the points are to that line, the stronger the correlation.
Independent variable - (horizontal / vertical axis)
dependent variable - (horizontal / vertical axis)
flowchart
No worries. The right way is the way that helps those involved understand the process
No, people who perform the process should do it
A _ visually represents the sequential steps of a process, system, or workflow using symbols and arrows.
It serves as a generic tool for documenting, analyzing, and improving various processes, including manufacturing, administrative tasks, and project planning.
Key elements often included are input/output materials, decisions, involved personnel, time frames, and process measurements.
used to improve understanding of a process, document procedures, and facilitate communication among team members. [1, 2, 3]
Considerations:
Should it be the right way?
Is a technical expert better?
one step
direction
decision based on a question
delay/wait
links to another page
input/output
document
start and end points
Symbols in flowcharts
Union of Japanese Scientists and Engineers (JUSE)
Verbal data
after, before
In 1976, the (Union) developed the Seven Management and Planning Tools (N7) to complement the original quality control tools. These tools are designed to handle different types of data during the problem-solving process.
Key Differences
Feature | The Basic Seven Tools (B7) | The New Seven Tools (N7) |
|---|---|---|
Data Type | Numerical Data | (Type) Data |
Timing | Define problem (after/before) collecting numerical data. | Define problem (after/before) collecting numerical data. |
Primary Goal | Analytical approach (analyzing existing facts). | Generate ideas and formulate plans. |
Workflow:
Facts are collected as Data.
Data is categorized into Numerical (for B7) or Verbal (for N7).
The respective tools are used to Organize the data.
The final result is structured Information used for decision-making.
Affinity diagram
Interrelationship diagram
Tree diagram
Matrix diagram
Matrix data analysis
Arrow diagram
Process decision program chart
N7 Tools
_ Organizes a large number of ideas into their natural relationships.
_ Shows cause-and-effect relationships and helps analyze the natural links between different aspects of a complex situation.
_ Breaks down broad categories into finer and finer levels of detail, helping to move step-by-step thinking from generalities to specifics.
_ Shows the relationship between two, three, or four groups of information and can give information about the relationship, such as its strength, the roles played by various individuals, or measurements.
_ A complex mathematical technique for analyzing matrices, often replaced by the similar prioritization matrix. A prioritization matrix is an L-shaped matrix that uses pairwise comparisons of a list of options to a set of criteria in order to choose the best option(s).
_ Shows the required order of tasks in a project or process, the best schedule for the entire project, and potential scheduling and resource problems and their solutions.
_ Systematically identifies what might go wrong in a plan under development.
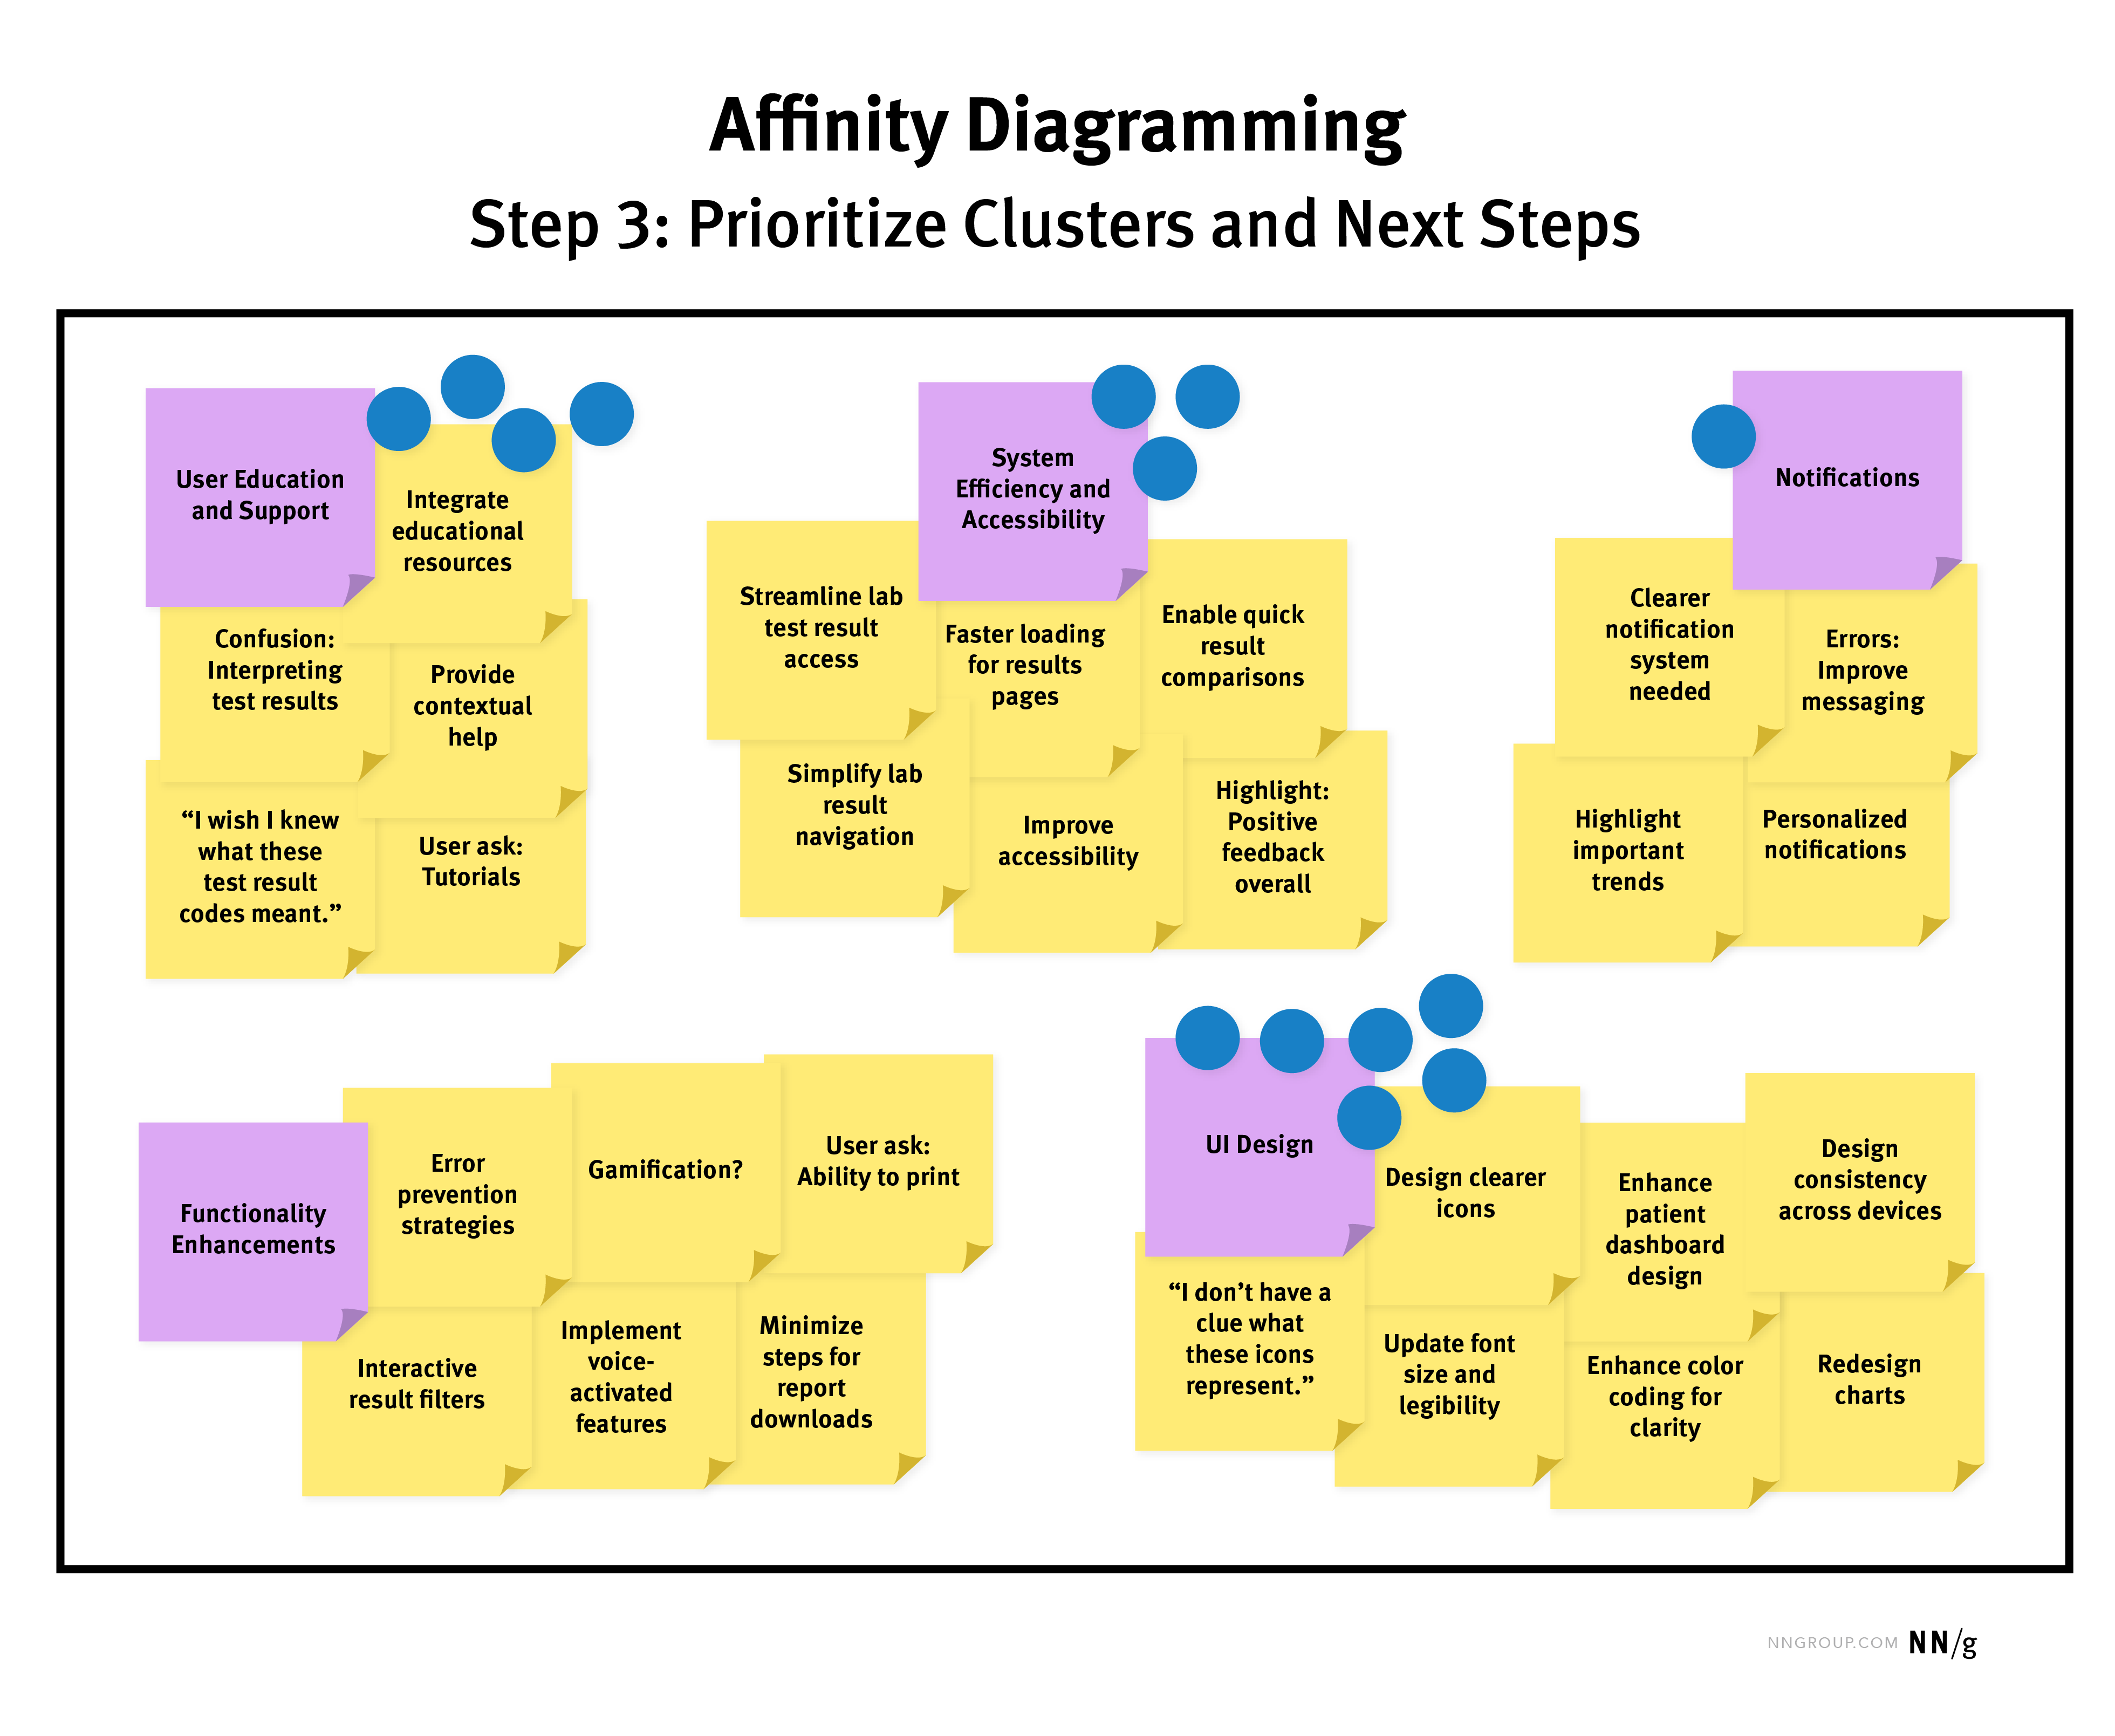
Affinity Diagram
An _ is a creative tool used to generate a large number of issues or ideas to understand a problem and logically find possible solutions.
Key Characteristics
Problem-Solving: It provides an easy method to find a solution for a specific problem.
Collaborative: It serves as a brainstorming and idea-generation exercise.
Organization: It focuses on the categorization of scrambled or unorganized ideas into a logical structure.
Process Summary:
Step 1: Record each idea onto separate sticky notes or cards using markers for readability.
Step 2: Silently group related ideas together side-by-side on a large work surface.
Step 3: Discuss the groupings with the team to define categories and create summary header cards.
Step 4: Combine individual groups into broader "supergroups" if appropriate for better organization.
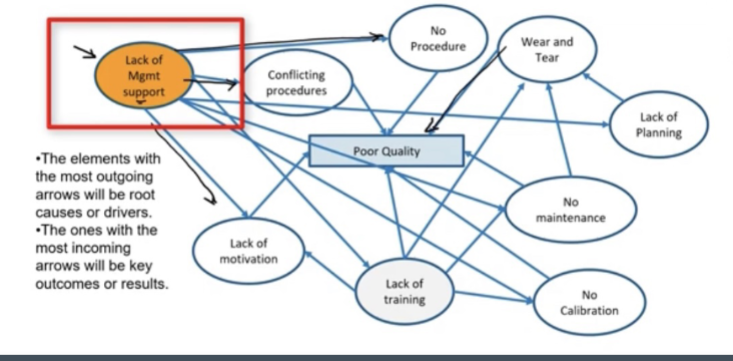
Interrelationship diagraph
Clarifies the interrelationship of many factors of a complex situation
Key characteristics:
states relationship of issues responsible for a complex situation
classifies cause and effect relationship among all factors
identifies key drivers and outcomes
Use Cases:
This tool is typically used when analyzing causes of a complex issue, implementing a complex solution, or prioritizing improvement areas after using other tools like affinity or fishbone diagrams.
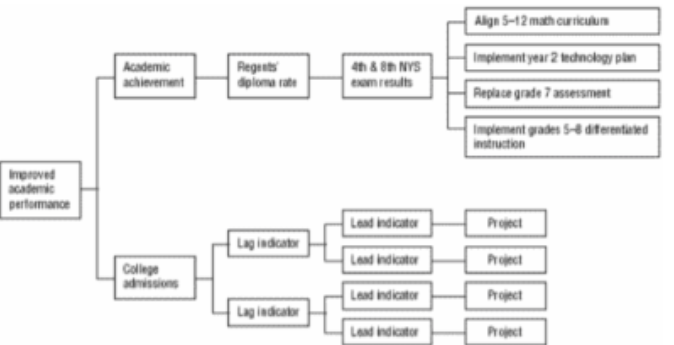
Tree diagram
reduces any broad objective into increasing levels of details
mix of arrows and boxes, identifying means and hows
When to use a tree diagram:
Moving from General to Specific: When an issue is known in broad terms and needs to be broken down into logical steps.
Action Planning: When developing specific actions to carry out a solution.
Process Analysis: When you need to analyze a process in detail.
Root Cause Analysis: When probing for the root cause of a problem.
Evaluating Solutions: When looking at implementation issues for multiple potential solutions.
After Initial Brainstorming: After using an affinity diagram or interrelationship diagram to uncover key issues.
Communication: As a tool to explain complex details clearly to others.
Matrix diagram
management planning tool used to analyze and display the relationship between different data sets. It effectively shows the strength and nature of connections between two or more groups of information.
Common Matrix Shapes and Their Uses
L-shaped: Relates two groups of items to each other (or one group to itself).
T-shaped: Relates three groups (B and C are both related to A, but not to each other).
Y-shaped: Relates three groups in a circular fashion (each group relates to the other two).
C-shaped: Relates three groups of items simultaneously in 3D.
X-shaped: Relates four groups where each group is related to two others in a circular fashion.
Roof-shaped: Relates one group to itself; typically used alongside an L- or T-shaped matrix to show internal relationships.
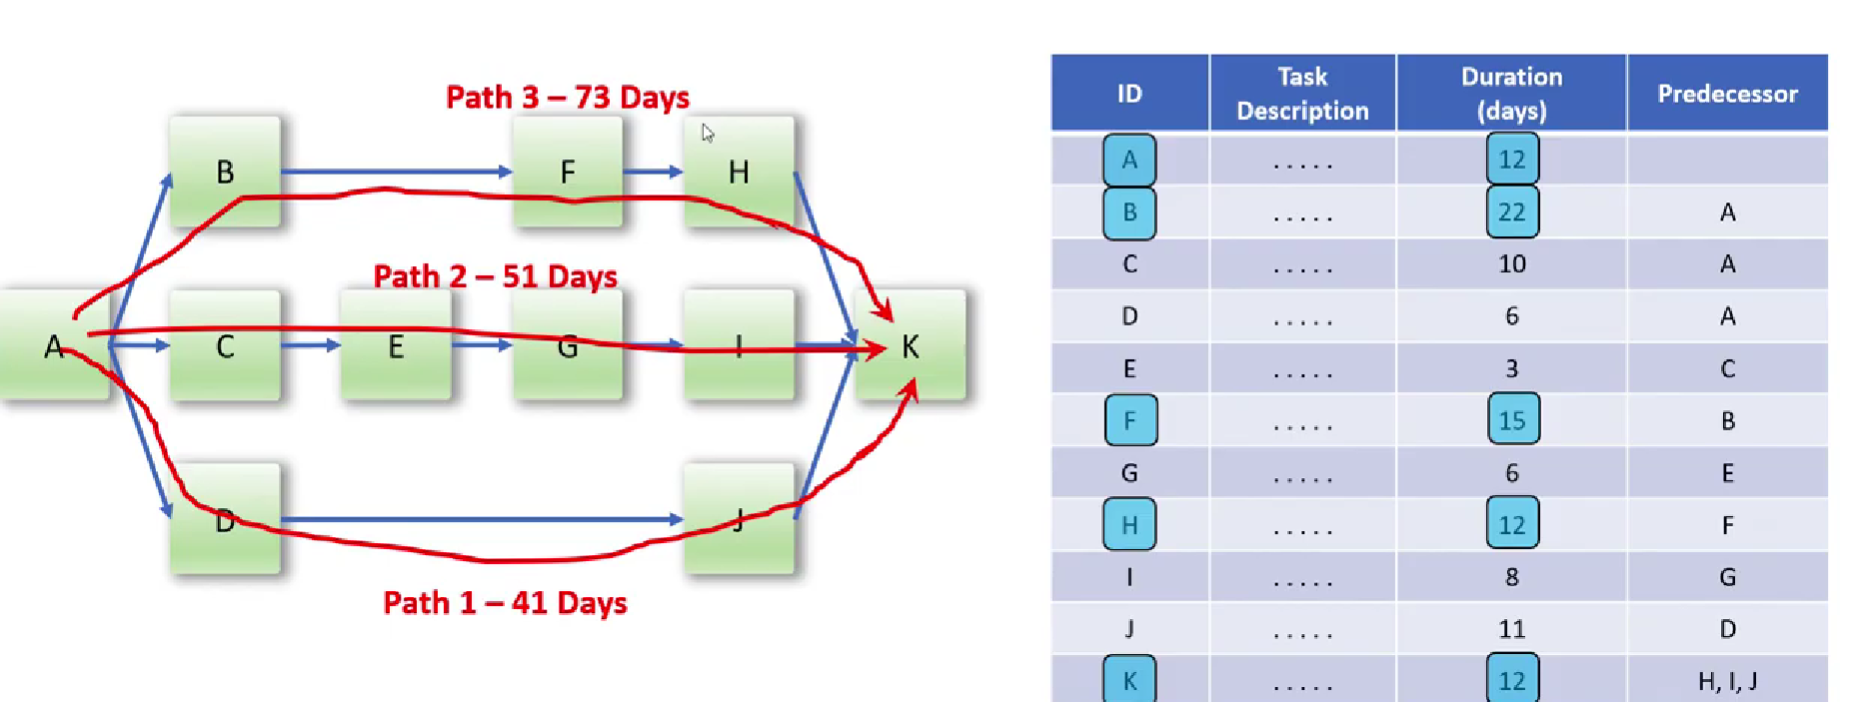
Arrow diagram/activity network diagram
What It Is
Purpose: To map out the optimal sequence of tasks and their interconnectivity.
Key Function: It helps identify the "critical path"—the sequence of steps where any delay will postpone the entire project.
Aliases: Activity network diagram, node diagram, or CPM (Critical Path Method) chart.
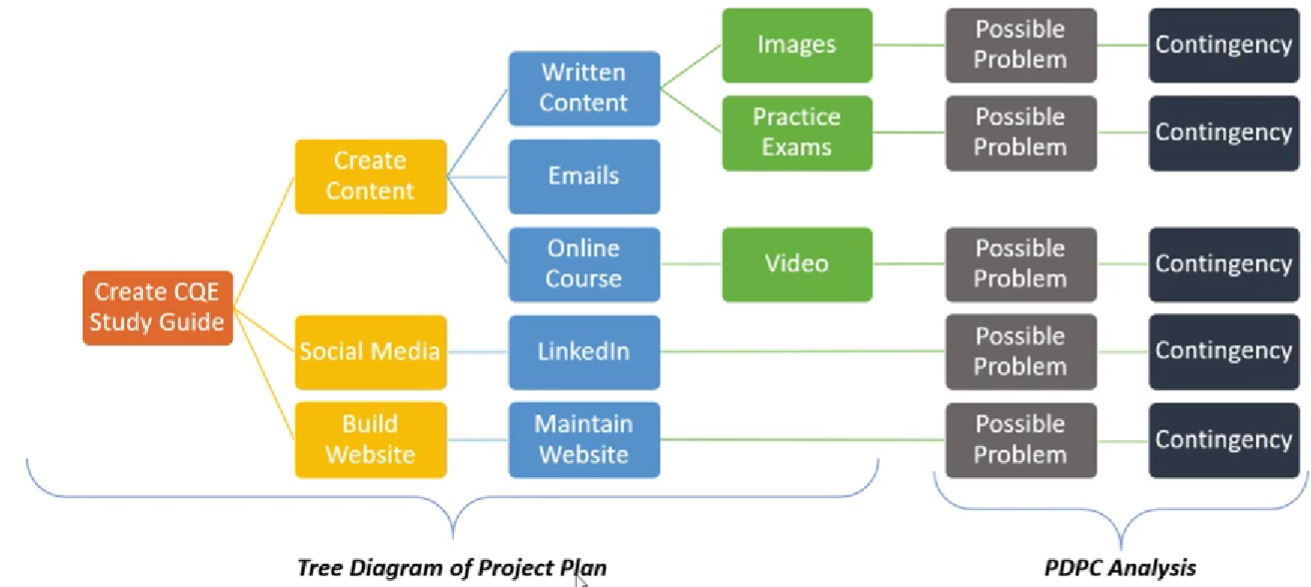
Process decision program chart
risk management tool in project management
avoids surprises and identifies possible countermeasures
objective is to anticipate challenge and prepare an early solution
The procedure involves creating a tree diagram of the project, brainstorming potential problems for each task, and developing countermeasures for those issues. [1, 2]
Countermeasures are evaluated based on feasibility (cost, time, ease of implementation) and marked with an 'O' for practical ones or an 'X' for impractical ones. [1, 2]
breakthroughs
Joseph Juran
accomplishment of any improvement (stated by ___)
address chronic losses or common causes of variation.
process improvement methodologies and tools provide the foundation for breakthrough as well as modern six sigma approaches
Analyze the problem
Generate ideas
Evaluate and select ideas
Implementing ideas
PROCESS IMPROVEMENT METHODOLOGIES (common themes)
_: Collect and organize information, analyze data and underlying assumptions, and reexamine the problem for new perspectives to achieve a workable problem definition.
_: "Brainstorm" to develop potential solutions.
_: Determine whether the ideas have merit and will achieve the problem solver's goal.
_: Sell the solution and gain acceptance by those who must use them.
Walter Shewhart (1939)
Deming Wheel
Evolution of the Deming Cycle
Who introduced it first? And what year?
Specification, production, and inspection for mass production
Hypothesizing, carrying out experiment, and testing hypothesis
_
1. Design the product with appropriate tests.
2. Make the product and test in the production line and in the laboratory.
3. Sell the product.
4. Test the product in service and through market research.
Japanese Implementation
1. _ → _ → _ → _
**DEMING CYCLE IN NOTES
soikufu
Creative problem solving - in japanese is known as ____
use brains as well as their heads
the Japanese concept of creative thinking, continuous improvement, and ingenuity in figuring things out
Focus
Analyze
Develop
Execute
DRIVE
FADE
Used by hospitals
DRIVE (park place lexus)
Define problem
recognize the cause
identify solution
verify actions
evaluate results
Define
measure
analyze
improve
control
DMAIC Methodology
data driven methodology used to improve existing business process
Six Sigma
Motorola
General Electric (mid-1990s)
_ is a business improvement approach that seeks to find and eliminate causes of defects and errors in manufacturing and service processes by focusing on outputs that are critical to customers and a clear financial return for the organization.
It is a set of techniques and tools for process improvement and was developed by _ in 1986.
Which company spread the news of six sigma
TQM. Quality is EVERYONE’s responsibility
Six Sigma.
SIX SIGMA VS TQM
worker empowerment - ___
led by business leader champions - __
Conformance problems
Efficiency problems
Unstructured performance
Product design problems
Process design problems
Types of quality problems
• _ - are defined by unsatisfactory performance by a well-specified system.(SIX SIGMA)
• _ - result from unsatisfactory performance from the standpoint of stakeholders other than customers. (LEAN TOOLS)
• _ - problems result from unsatisfactory performance by a poorly specified system. (CREATIVE THINKING)
• _ - involve designing new products that better satisfy user needs—the expectations of customers that matter most to them. (SPECIAL TOOLS)
• _ - involve designing new processes or substantially revising existing processes. (COMBINED)
Projects
Project Management Body of Knowledge (PMBOK)
69
• _ are the vehicles that are used to organize and to implement Six Sigma.
• The _, developed by the Project Management Institute, defines _ tools that every project manager should master.
Champions
Master Black Bells
Black Belts
Green Belts
Six Sigma Teams
_: Senior-level managers who promote and lead the deployment of Six Sigma in a significant area of the business. NOT RESPONSIBLE FOR TECHNICAL ANALYSIS, more on for monitoring and leading. “Are we working on the right project?”
_: Full-time Six Sigma experts who are responsible for Six Sigma strategy, training, mentoring, deployment, and results. More on parang org consultant ganon. “Are you using the right methods?”
_: Fully-trained Six Sigma experts with extensive technical training who perform much of the technical analysis required in Six Sigma projects, usually on a full-time basis.
_: Functional employees who are trained in introductory Six Sigma tools and methodology and work on projects on a part-time basis, assisting Black Belts while developing their own knowledge and expertise.
Team Members: Individuals from various functional areas who support specific projects.
return on equity
balancing quality costs against expected revenue costs
Suppliers, inputs, process, outputs, customers
SIPOC - to know the process before making movements
Y = f (X)
Some important function
the results you get depend on the factors that influence the process
value-stream map (lean)
ANALYZE
_ - highlights value-added versus non-value-added activities, incuding time that activities take
Lean production
Toyota
Lean
refers to approaches that originated at the Ford Motor Company in the early 1900s, but which were refined and modernized by the _ Motor Corporation later in the century.
_ approaches focus on the elimination of waste in all forms, including defects requiring rework, unnecessary processing steps, unnecessary movement of materials or people, waiting time, excess inventory, and overproduction.
lean six sigma
…an integrated improvement approach to improve goods and services and operations efficiency by reducing defects variation, and waste
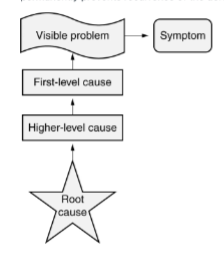
Root cause
_ is defined as "that condition (or interrelated set of conditions) having allowed or caused a defect to occur, which once corrected properly, permanently prevents recurrence of the defect in the same, or subsequent, product or service generated by the process."
assumes the worker makes the error vs
errors being the result of defects in the process, with people being part of the process
Symptom approach vs root cause
T
There are no isolated incidents
T
Its critical everyone is alert
The "true" problem must be understood from the data before action is taken.
T
Philosophy of root cause methodology
TRUE OR FALSE?
Each problem is a golden nugget or treasure.
Each problem tells a story about why and how it occurred. (There are isolated incidents.)
Solving problems requires a mindset that is alert, open-minded, patient, tenacious, and persistent.
Not everyone is required to take a personal and active role in improving quality.
The "true" problem must be understood once action is taken.
Each problem must be pursued and resolved rapidly.
Effects
Tips for effective Cause-and-Effect Diagrams
Review all candidate problems (_) and eliminate or combine duplicates.
Clearly identify the "_" which you are trying to eliminate.
Brainstorm the various causes for the "_".
Resist the temptation to state solutions before all the causes are identified.
Challenge ideas as to whether they are a "Cause" of "Effect".
Insure that the "Causes" identified are process variables not special causes.
Failure Mode and Effects Analysis
Fault Tree Analysis
FMEA stands for ___
FTA stands for ___
FMEA
Failure modes
Effects analysis
Design FMEA
Process FMEA
The __ is a systematic process & tool that requires a thoughtful consideration for all of the potential failure mode associated with a new design or process. This tool also facilitates the analysis & assessment of the risk associated with all of the identified failure modes & their resulting effect on your customer.
_ - ways or modes in which something might fail
_ - studying consequences of failures
TYPES
Fault Tree Analysis (FTA)
and
or
_, sometimes called cause and effect tree analysis, is a method to describe combinations of conditions or events that can lead to a failure.
A cause and effect tree is composed of conditions or events connected by "_" gates and "_" gates
An effect with an "and" gate occurs only if all of the causes below it occur, an effect with an "or" gate occurs whenever any of the causes occur.
Source: Evane and Lindsay. Ch. 7. Managing for Quality and Performance Excellance. 2017.