Describing Relationships
 Call Kai
 Learn
Learn Practice Test
 Spaced Repetition
 Match
Match Flashcards
 Knowt Play
1/19

Earn XP
Description and Tags
Relation between explanatory/outcome (X-Y), how to summarise and visualise categorical-categorical, numeric-categorical and numeric-numeric relationships
Name | Mastery | Learn | Test | Matching | Spaced | Call with Kai | Chat |
|---|
No analytics yet
Send a link to your students to track their progress
20 Terms
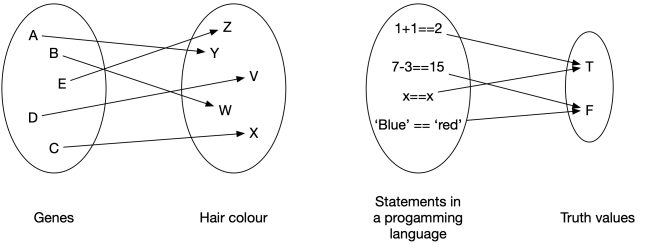
What is a relationship?
Connection between 2 things which can be defined as a mapping between the elements of those 2 things (usually prefer to define these using a function)
Typically have theories about relationships or predictions between variables → have importance (questions are built on this)
What is the dependent variable?
Thing we want to predict/understand (AKA outcome) → y
What is the independent variable?
Things we hypothesise influence the DV (AKA predictor, explanatory variable) → x
What are covariates?
Things will influence the outcome, but we may not have a hypothesis about (AKA nuisance variable)
Usually controlled statistically or by designs to minimise effect
Also x
What is a model?
Representation of a system in a formal language → try to rep the important aspects of a system + ignore extraneous
What is a frequency table used to describe?
A single categorical variable?
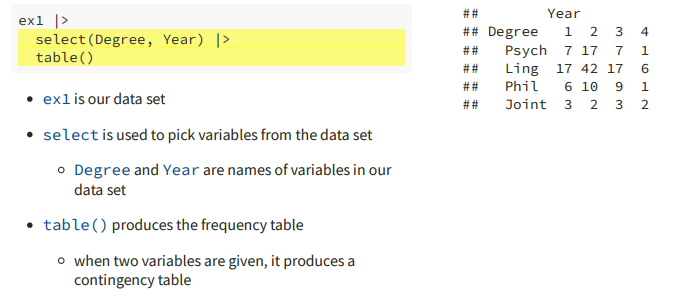
What is a contingency table used to describe?
2 categorical variables → shows the frequency of one level within levels of the other
What is the code for contingency tables?
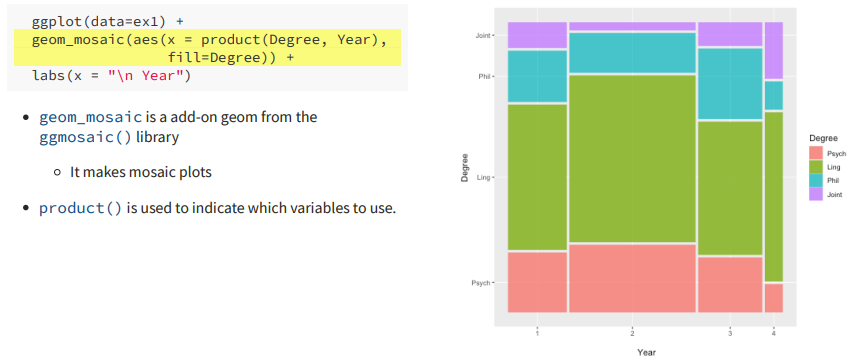
How can a contingency table be visualised?
As a mosaic plot
What is the code for mosaic plots?
What do we typically look at when describing continuous-categorical pairs?
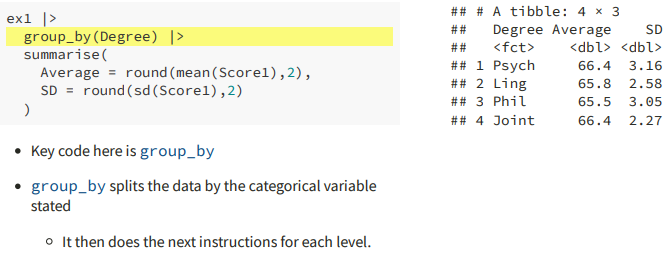
Grouped stats of the continuous variable at each level of the categorical variable
Mean
Standard deviation
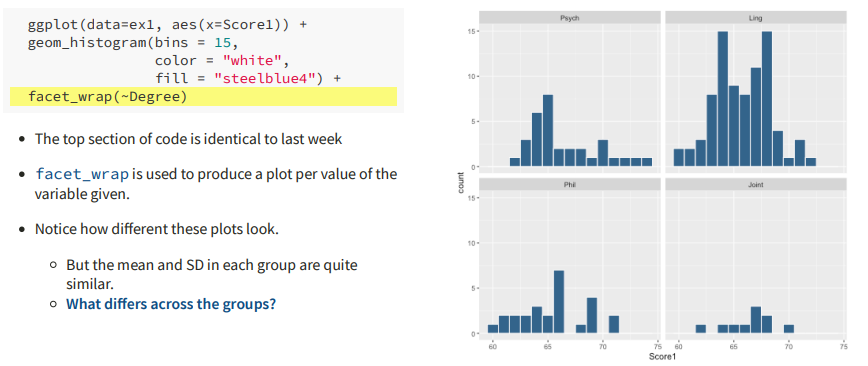
Distribution shape
What is the code for calculating grouped summary statistics?
What is the code for grouped histograms?
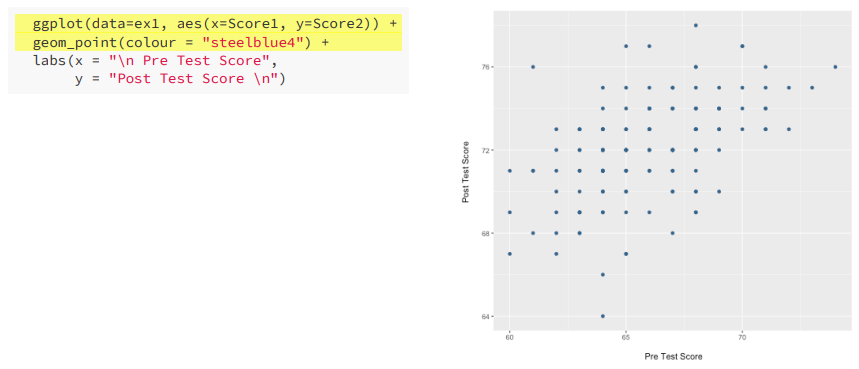
When are scatterplots used and why?
When describing 2 continuous variables because we cannot compute summary stats of one at each level of the other (too many values)
What is the code for scatterplots?
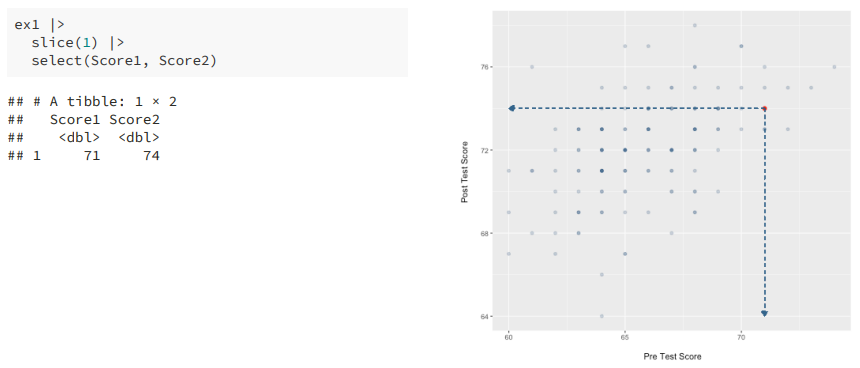
What is the code for understanding a scatterplot?
What is covariance?
Numerical value representing the degree to which variables vary in the same way (concerns variation in 2 variables) → similar to variance but summed term is the combined deviance from the respective means of x + y

What is the code for calculating covariance?
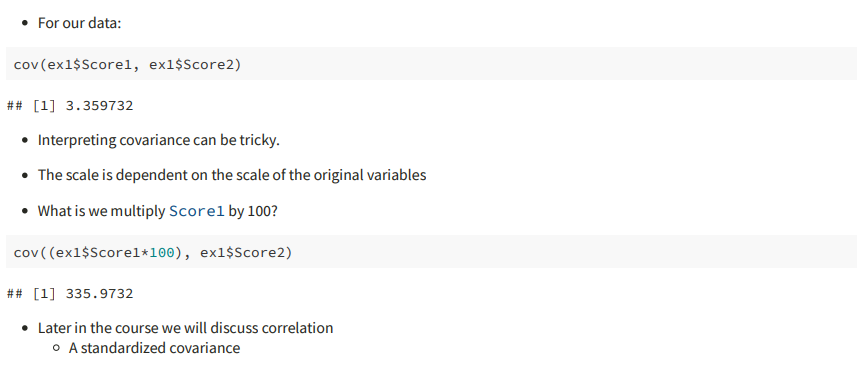
What is standardised covariance?
Correlation coefficient (not sensitive to measurement scale)
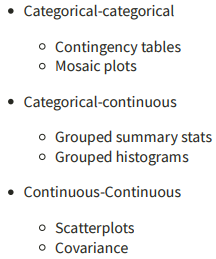
Summary of visualisations of different relationships