Statistics 243
 Call Kai
 Learn
Learn Practice Test
 Spaced Repetition
 Match
Match Flashcards
 Knowt Play
1/22

There's no tags or description
Looks like no tags are added yet.
Name | Mastery | Learn | Test | Matching | Spaced | Call with Kai | Chat |
|---|
No analytics yet
Send a link to your students to track their progress
23 Terms
Statistics
collecting, organizing, summarizing and drawing conclusions from a date.
Data
Collection of number, charcters, images, etc with the context and how they were gatherd. Information along with the context and lens through which they were gathered.
Population data
All of the date
Sample data
A portion of the population data
Descriptive Statistics
numerical values like mean, median, avrage that describe data
Inferential statistics
Generalizing conclusions from sample data to a population.
Numerical variables
quantitive, associated with numbers. example: continuous (measurable can have decimal/fractions like length or weight) and discrete variables (countable and distinct whole number # of items)
Categorical variables
qualitative, associated with words, pictures, qualties, regular variables like yes/no, gender. Ordinal variables- categorical variables that look like numbers like ratings, phone number, grade level.
Proportion, Percentage, fraction
Categorical variables quantity of interest. Examples:95% of college students own a laptop
Mean or avarege
Numerical variables quantity of intrest. Ex. The average age of nursing students is 24 years.
Census Sampling
type of sampling method-samples the entire population, usually difficult, takes time and expensive. EX. survey every PCC student, survey Washington. county residents
Simple random sampling
people chosen at random usually w/ help of tech, easier should be larger than 30; EX: 100 studnets at pcc were randomly selected
Cluster Sampling (All from Some)
Divide the population into a subgroups, pick a few subgroups then survey everyone in the selected groups. EX: separate pcc students by Zip code- randomly pick 10 zip codes then survey all the students in those zip codes. Cons: some groups are left out entirely
Stratified sampling (some from All)
Divide the population into subgroups based on a characteristic then randomly select SOME people from EVERY subgroup. EX: Separate pcc students by Zip code then randomly select a few people from each zipcode.
Systemic Sampling
Selecting a random starting point then choosing every nth person from a list. EX: Choose every 10th student from list of all PCC
Voluntary or self selected sampling
Individuals volunteer to be part of a survey. EX: sending an email to all PCC students asking them to take part in the survey and only using those individuals who reply
Convenience sampling
Sample is made up of the first people or things you find. EX: survey just my math 243 students
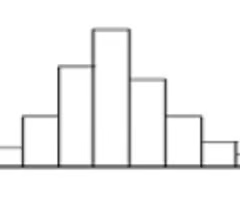
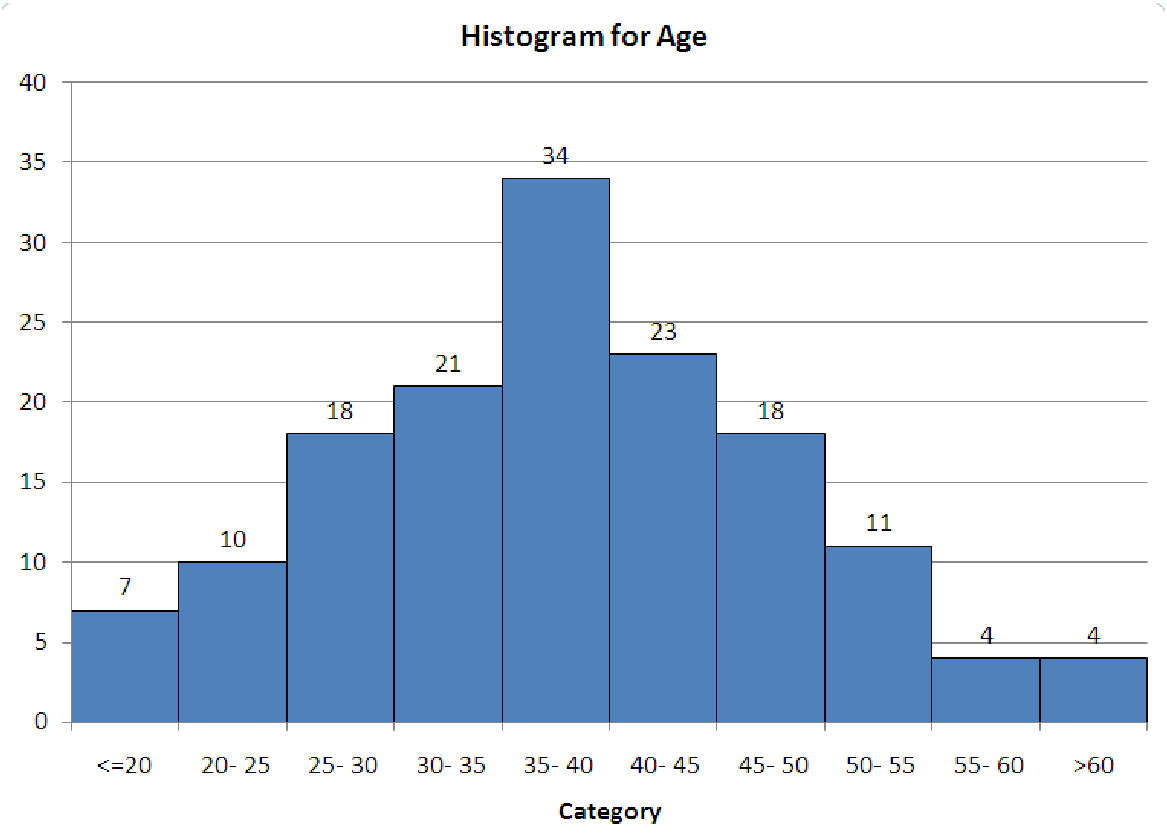
Symmetric Graph: highest point of data is in roughly the middle of the graph and the slope of the data to the left and right look pretty much the same. Mean=Median
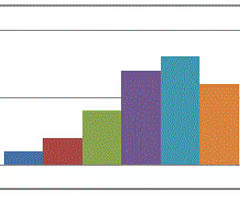

Skewed left graph: Most of the data is to the Right but their are outliers which form a short/small "tail" towards the left closer to smaller values. Mean is less then < Median. Median is less effected and mean is pulled downwards
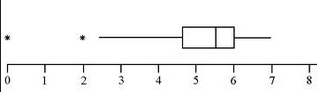
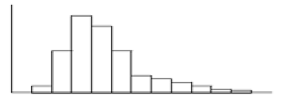
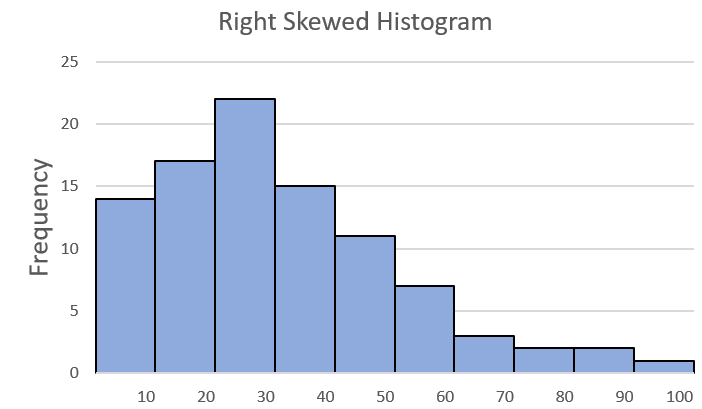
Skewed right graph: Most of the data is to the left side but their are outliers which form a short/small “tait” to the right closer to the higher values. Mean is more than > Median because right tail pulls mean upwards higher than median.
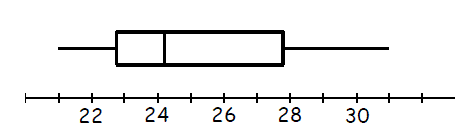
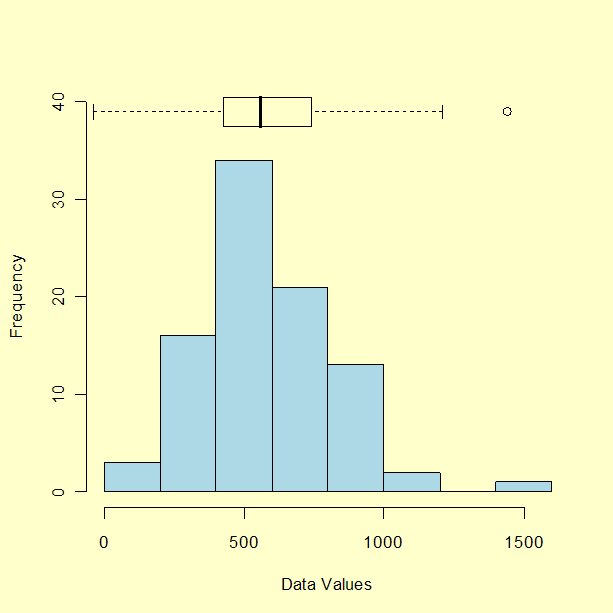
Outliers
Extreme values by themselves.
Mean Definition & Calculation
Average of the data. Add all values, divide by the number of values.
Interquartile Range (IQR) definition and equation
Q3-Q1; Used to calculate the spread when data is skewed