1.2.9a - indirect taxes
1/10
There's no tags or description
Looks like no tags are added yet.
Name | Mastery | Learn | Test | Matching | Spaced | Call with Kai |
|---|
No analytics yet
Send a link to your students to track their progress
11 Terms
what is an indirect tax
a tax on expenditure
two main types of indirect tax
ad valorem = percentage
eg. VAT
specific/unit = fixed value
eg. excise duties
on whom are indirect taxes placed
the producer
effect of indirect tax
increase costs of production:
supply curve shifts LEFT
price RISES
quantity [bought/sold] FALLS
show an indirect tax diagram for SPECIFIC TAX
BEFORE TAX:
- TE = TR (total expenditure = total revenue)
AFTER TAX:
- TE reduced (price up, demand down)
- TR reduced (some of TE went to government)
- consumers paid half, producers paid half
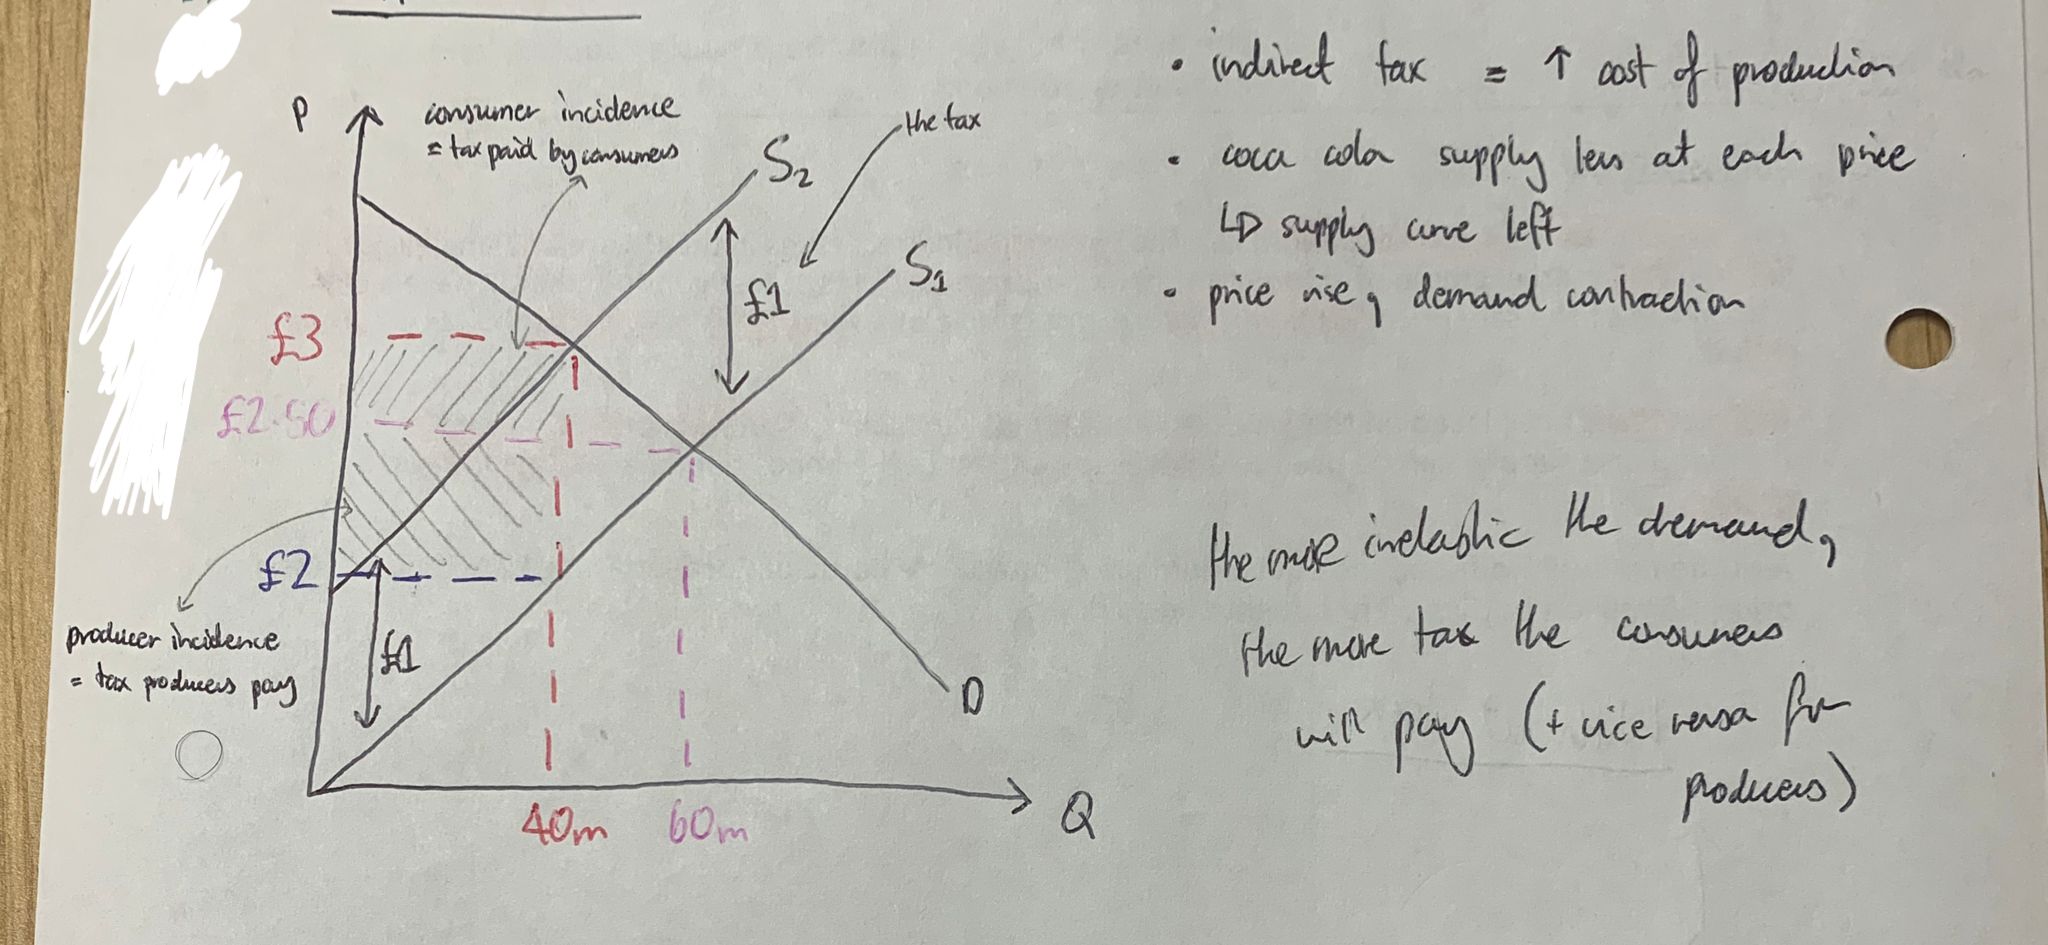
the more inelastic the demand…
…the more tax is passed onto the consumers
(+ vice versa)
(bc the ppl don’t care what price they’ll still buy the same)
the more inelastic the supply
…the more tax is passed onto the producers
(+ vice versa)
(bc they don’t care what price they’ll still supply the same)
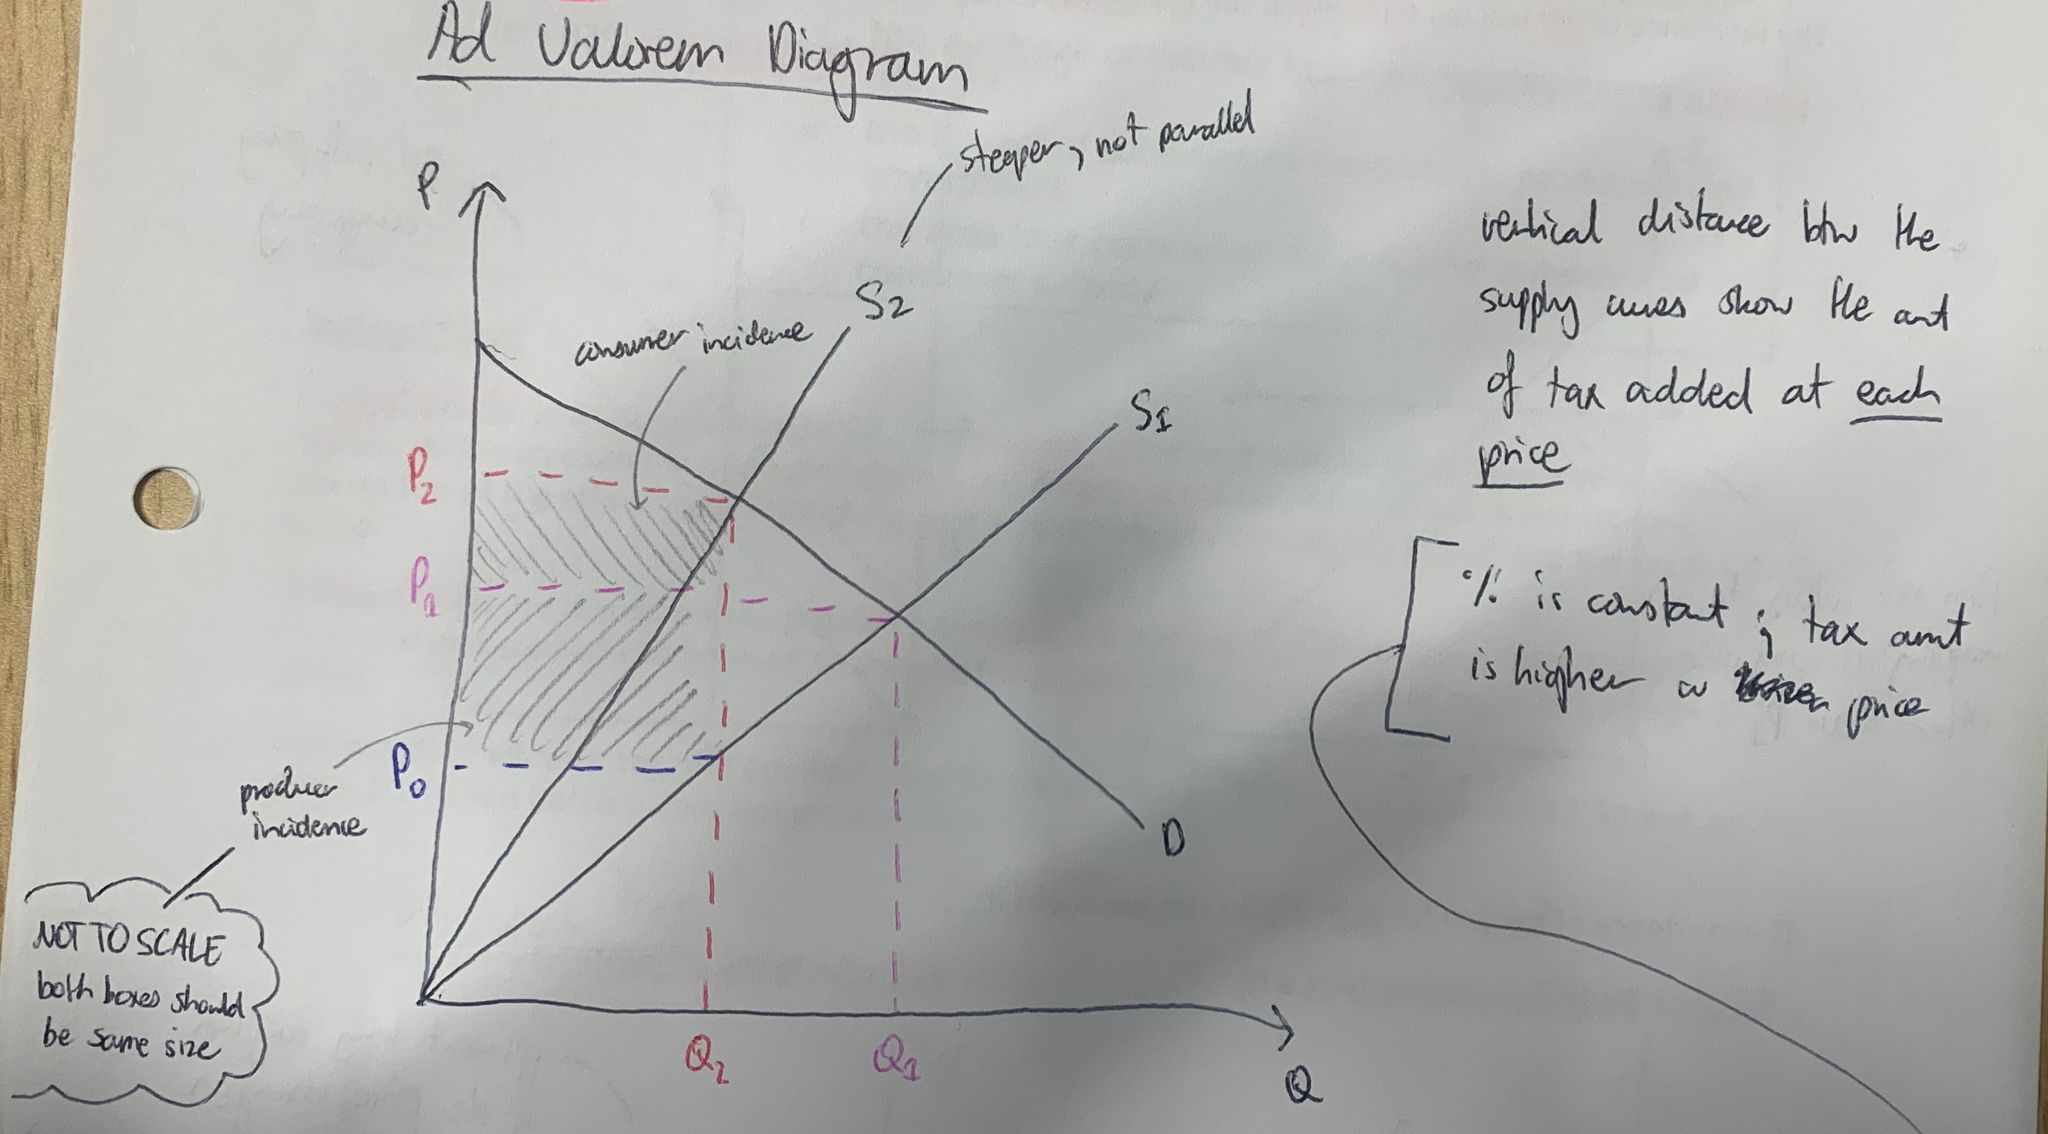
difference between specific and ad valorem tax graphs
supply curve still shifts left but at a STEEPER GRADIENT
because…
…vertical distance between the curves shows the tax, so HIGHER PRICES means vertical distance gets BIGGER because the amount of TAX RISES (bc its a percentage)
what can you also do with indirect tax diagrams
add them into externalities diagrams to show the reduction in welfare loss
4 stakeholders and the effects of indirect taxation on them
consumers | producers | government | society |
higher prices = some unwilling/unable to buy | loss of sales and revenue | will gain tax revenue | net welfare loss |
loss in consumer surplus (welfare) | will pay a proportion of the tax (producer incidence) | less neg externalities | |
will pay a proportion of the tax (consumer incidence) |