Stat 200 Exam 1
 Call Kai
 Learn
Learn Practice Test
 Spaced Repetition
 Match
Match Flashcards
 Knowt Play
1/93

There's no tags or description
Looks like no tags are added yet.
Name | Mastery | Learn | Test | Matching | Spaced | Call with Kai | Chat |
|---|
No analytics yet
Send a link to your students to track their progress
94 Terms
a dataset
has many cases or units
cases or units
the subjects or objects that we obtain information about
variable
any characteristic/feature that is recorded for each case (columns)
case
rows, ex: students, countries, people
variable types
categorical and quantitative
categorical
divides cases into categories, often words/symbols
nominal categorical
ex: political party, eye color
ordinal categorical
natural order (year in school, quality of service, letter grade scale)
quantitative
measures a numerical quantity for each case
discrete and continuous
discrete quantitative
can only take a countable set of values (classes missed, puppies in a litter)
continuous quantitative
can take any value within some range (height, distance biked per day, G/dl)
population
includes ALL individuals or objects of interest
sample
all of the cases we have collected data on, a SUBSET of the population
statistical inference
the process of using data from the SAMPLE to gain information about the POPULATION
inference is only valid if…
the sample is REPRESENTATIVE of the population
sampling
drawing from population
drawing from a sample is a process called…
statistical inference
how to avoid bias
take a RANDOM sample from the population
“lottery machine” & never trust people to pick at “random”
simple random sample
each unit of the population has the same chance of being selected, regardless of the other units chosen for the sample
non-ideal methods of sampling
sampling cases based on something obviously related to the variables you are studying
sampling realities
random sampling is ideal, but not always feasible
sometimes it’s OK to reimagine the population of interest
sampling bias or selection bias
participants included are not representative of the entire population
nonresponsive data
some participants included in the sample do not participate in the survey or study
response bias
some participants respond based on leading questions
association
if values of one variable tend to be related to values of another
causation
changing the value of one variable influences the value of another
confounding variable
a THIRD variable that is ASSOCIATED with both the explanatory and response variable
in observational studys/experiments
observational study is
association and has confounders
randomized experiment
causation
control group
when determining whether a treatment is effective, it is important to have a comparison group
treated exactly the same but does not receive treatment
placebo
placebo only works if
blinded/masked
two types of randomized experiments
randomized comparative and matched pairs
randomized comparative
randomly assign cases to different treatment groups and then compare results on the response variables
matched pairs
each case gets both treatments in random order, and then we study the difference in the response variable between the two treatments for each pair
parameter
a summary measure for the entire population
statistic
a summary measure for a sample
sample proportion
p-hat = x/n
n = sample size and x = successes
side-by-side bar chart
height of each bar is the count from the corresponding cell in the two-way table
height could also be expressed as percentages
segmented bar chart
stacked instead of side-by-side
risk
common way to refer to a proportion
number in category/total number in group
risk formula
relative risk
captures a relationship between two two-level CATEGORICAL variables
idea: relate the risk to the explanatory variable
if possible ask for control group at bottom, denominator = baseline risk
relative risk example
5 times the risk
two groups have same risk
= 1
numerator has bigger risk
>1
denominator has bigger risk
<1
odds
a related quantity
compares chance an event happens to the chance it does not
odds example
3 to 2, 1 to 2, 60 to 40 —→ 3 to 2

histogram
the height of each bar corresponds to the number of cases within that range of the variable
x-axis is numeric
histogram
cannot change order of bars
histogram
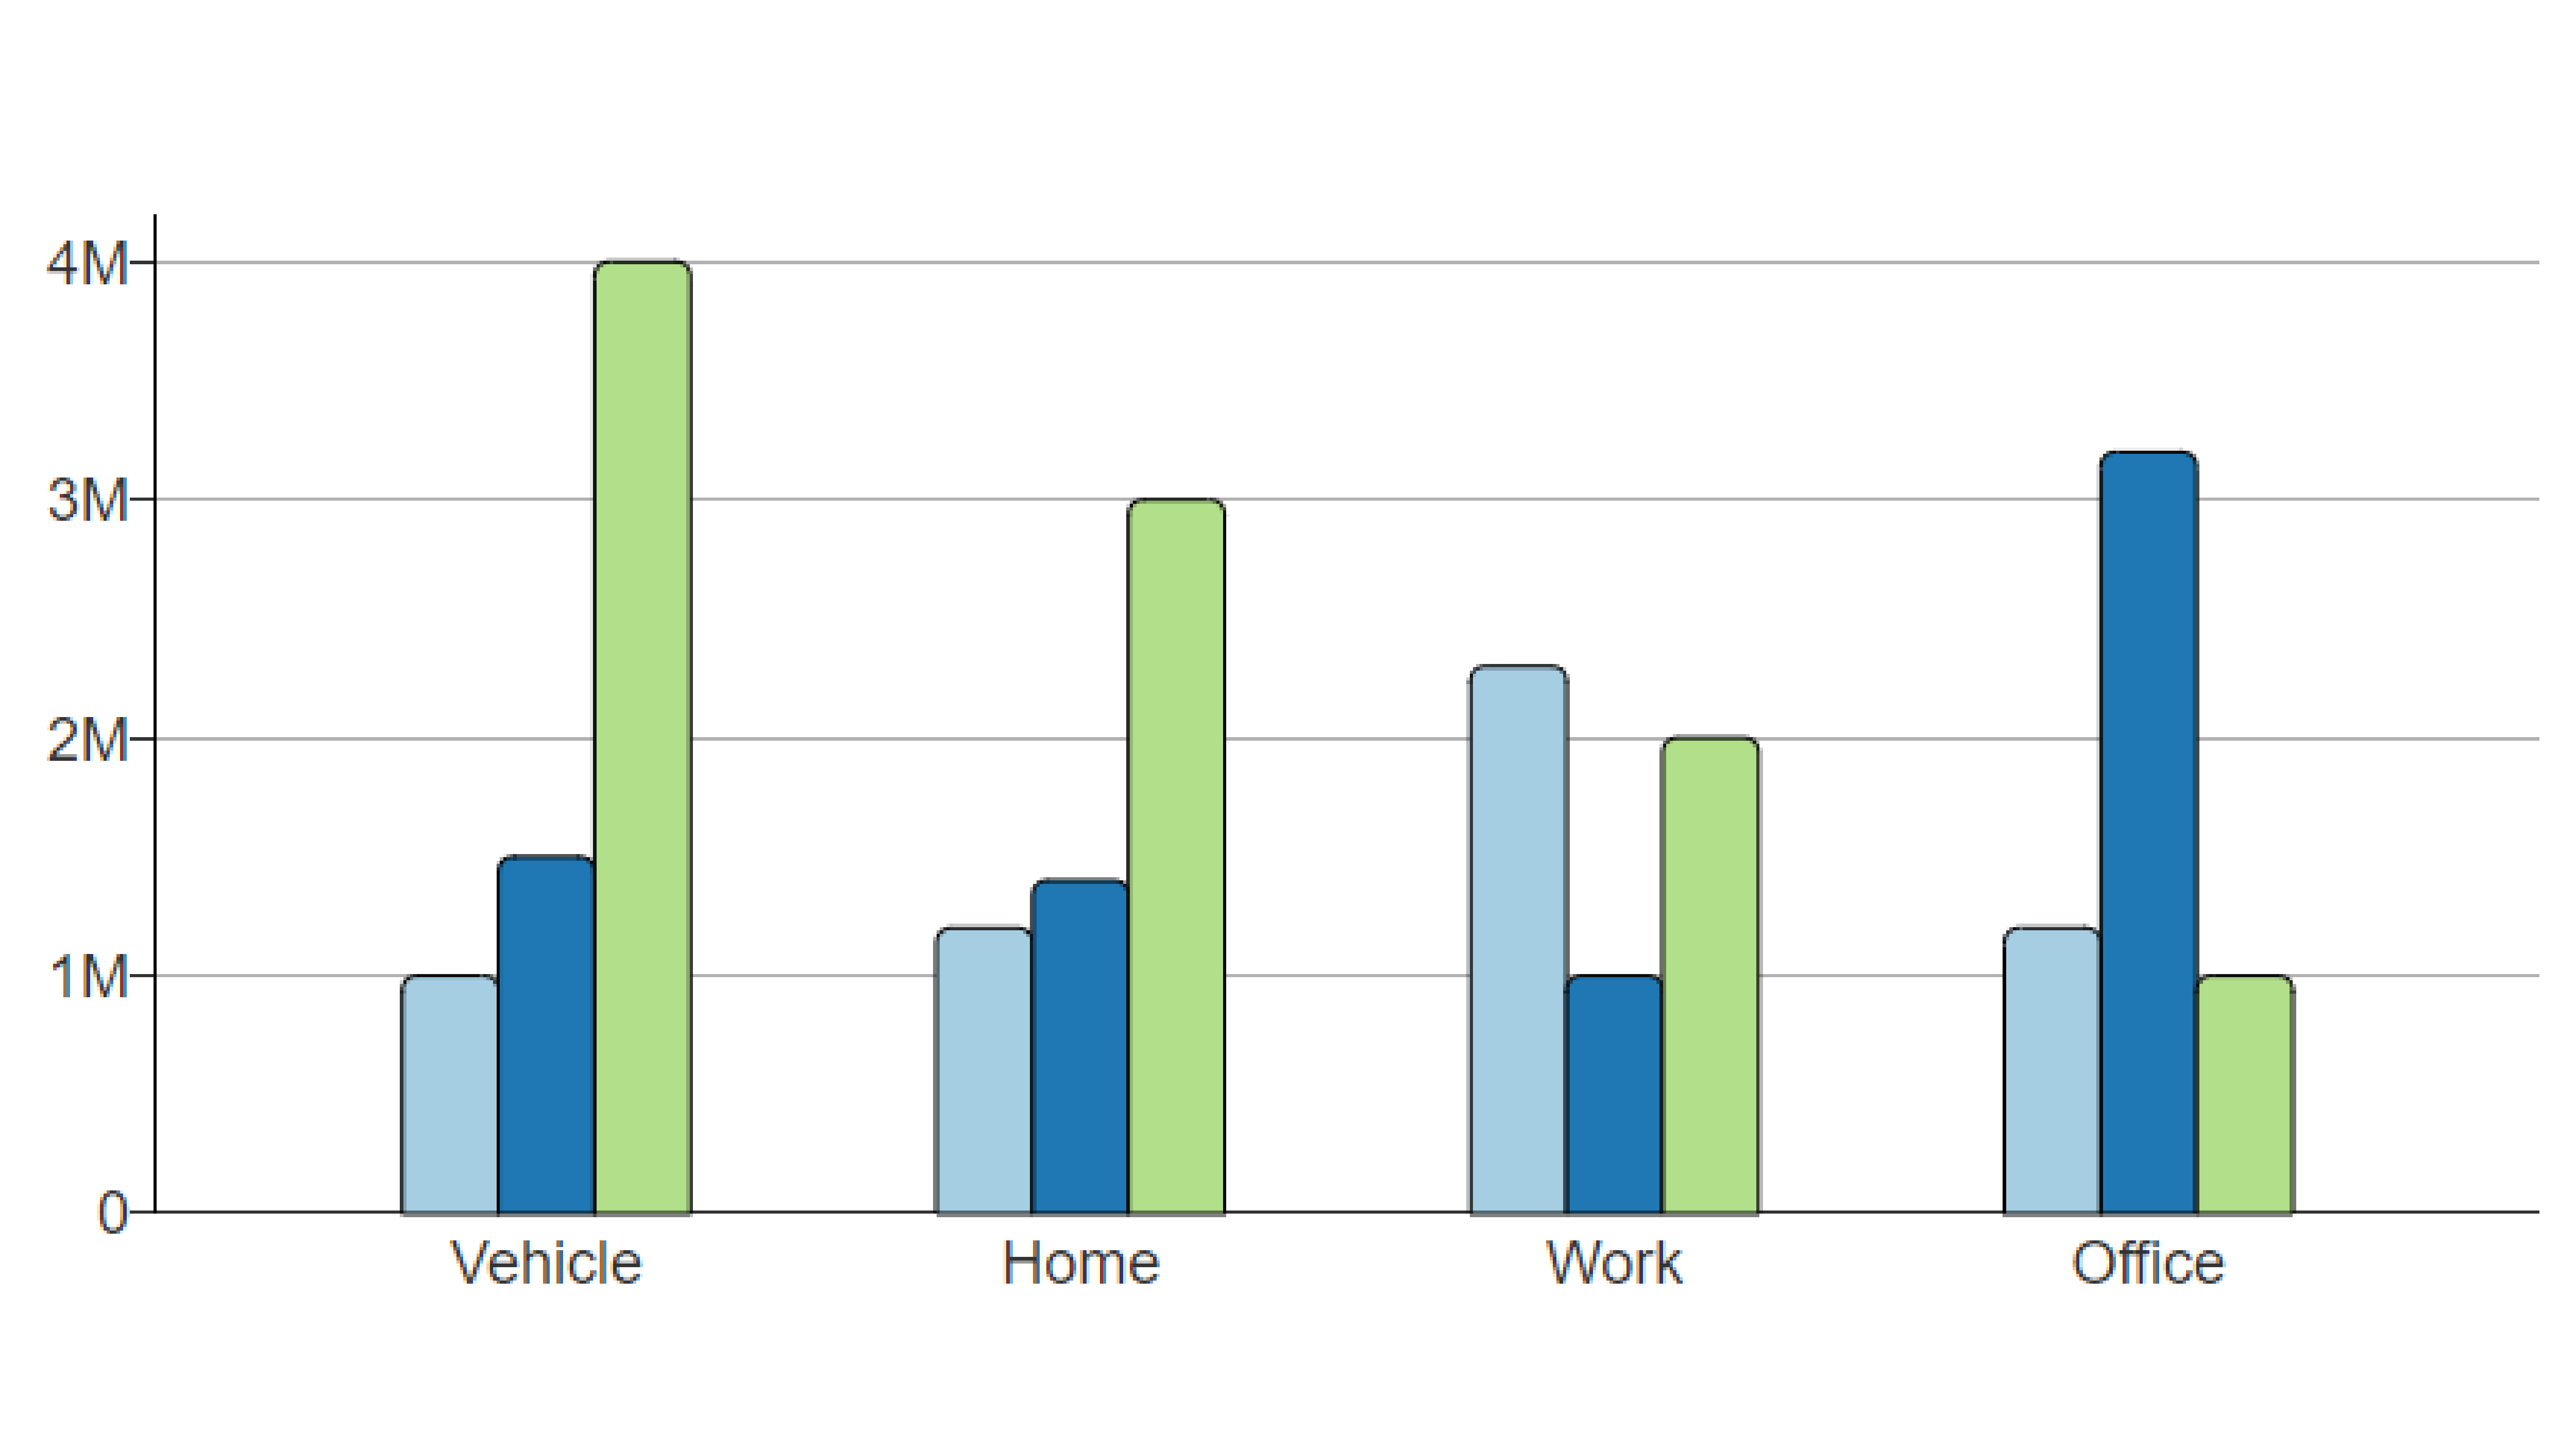
no numerical x-axis
bar chart
could change order of bars without changing the meaning
bar chart
sample size, number of cases is denoted by
n
xn
n values of the variable x
for symmetric distributions
the mean and median will be about the same
for skewed distributions
the mean will be “pulled” in the direction of the skewness
a distribution is left skewed so the
median is higher
resistant statistics
a stat is resistant if relatively unaffected by extreme values
is the median a resistant statistic?
yes
is the mean a resistant statistic?
no
standard deviation
measures the spread of a distribution
standard deviation is roughly…
the average distance from data points to the mean
the larger the standard deviation…
the more variability there is in the data and the more spread out the data is
the 95% rule
if distributions of data is approximately bell-shaped, about 95% of the data should fall within 2 standard deviations of the mean
2 standard deviations of the mean
x-bar - 2s and x-bar + 2s
x = mean
s = standard deviation
z-score
tells us how many standard deviations a particular value is from the mean
z = observed value - mean / sd
is range a sensitive statistic?
yes, not resistant
is IQR resistant?
yes, quite resistant because it is in the middle 50% of data
positive association
same direction
negative association
different direction
no association
if knowing that value of one variable does not give you any information about the value of another
correlation
a measure of the strength and direction of linear association between two quantitative variables
sample correlation
r (statistic)
population correlation
p (rho) (parameter)
strongest/perfect correlation
-1 < x < 1
the sign in a correlation indicates…
the direction
the magnitude in a correlation indicates…
strength
r = 0
has NO linear correlation
can you still have association and be zero/no linear association
yes
(non-zero) correlation does not imply…
causation
is correlation resistant?
no it is very sensitive, not resistant at all
residual
the vertical distance from the line to the point
residual equation
y - yhat
actual - predicted
do not use the regression equation or line…
to predict outside the range of x values observed in your data
if none of the x values are anywhere near 0…
than the intercept is not directly interpretable
in simple linear regression we assume the relation between x and y is…
linear (makes sense to draw the line)
influential point
an outlier with usually large impact
only used if LINEAR
an influential point
graph(s) to use for ONE CATEGORICAL variable
bar chart and pie chart
graph(s) to use for ONE QUANTITATIVE variable
histogram, box plot, and dot plot
graph(s) to use for one CATEGORICAL & QUANTITATIVE variable
box plot and bar chart
graph(s) to use for TWO QUANTITATIVE variables
scatter plot
graph(s) to use for TWO CATEGORICAL variables
segmented bar chart