ECON 2105 Module 4 CPs
1/27
There's no tags or description
Looks like no tags are added yet.
Name | Mastery | Learn | Test | Matching | Spaced |
|---|
No study sessions yet.
28 Terms
Which of the following statements is correct? firms
If all firms set the same price and pay the same nominal wage, then the higher the real wage that they pay, the lower is their markup.
Which of the following statements is correct? rate
Employment rate = employed / population of working age
Figure 9.5 depicts the wage-setting curve and how it is derived using the best response function of the employees and the isocost lines for effort of the employers.
Based on this figure:
In a country where the stigma attached to unemployment is high, the wage-setting curve would be lower.
Figure 9.8 depicts the market's demand curve and the firm's isoprofit curves. Based on this information, which of the following statements is correct?
If the firm finds itself producing at point C, it can increase its profit by selling more units at a lower price.
The following diagram depicts the price-setting curve. Based on this information, which of the following statements is correct?
At point C, the real wage is too low and the markup is too high. Therefore the firm is able to increase profit by lowering prices and hiring more workers.
Figure 9.11 depicts the labour market model. Consider now a reduction in the degree of competition faced by the firms. Which of the following statements is correct regarding the effects of reduced competition?
The equilibrium real wage falls.
Which of the following statements is correct regarding the effects of a rise in the real wage on the labour supply of a worker?
At high wage levels, the income effect dominates the substitution effect, leading to lower labour supply.
Figure 9.12 depicts the labour market when there has been a negative aggregate demand shock. Based on this information, which of the following statements is correct?
At B, the firms are able to make higher profits by lowering the wage.
Figure 9.16 depicts the model of a labour market where there are 90 million workers. The current labour market equilibrium is at A. Now consider the case where the total labour supply is increased to 100 million. Based on this information, which of the following statements are correct regarding the adjustment process in the labour market?
Initially, unemployment doubles.
The wage-setting curve shifts downward.
Figure 9.20 depicts the effect of union wage-setting. What can we conclude from this figure?
The resulting bargained wage-setting curve will be above the wage-setting curve with no union.
Which of the following statements are correct? competitive goods
In a competitive goods market the buyers are price-takers, while in a labour market the buyers of employment (the firms) are price-setters.
There is no economic rent for either the buyers or the sellers in competitive goods markets. In contrast, in labour markets the sellers receive economic rents.
The following is the graph of the natural log of UK real GDP per capita between 1875 and 2014:
Based on this information, which of the following statements is correct?
The slope of the best-fit straight line is the average annual growth rate.
The following graph shows the relationship between real GDP growth and change in unemployment for the US between 1961 and 2019.
The equation shown is the regression result for the best-fitting line. Based on this information, which of the following statements is correct?
With real GDP falling by 2.8% in 2009, the predicted rise in the unemployment rate would have been 2.11 percentage points.
Which of the following statements is correct regarding measuring GDP?
GDP can be measured either as the total spending on domestically produced goods and services, or the total value added in domestic production, or the sum of all incomes received from domestic production.
Which of the following would increase GDP?
A decline in imports, holding all other components of GDP constant.
An increase in government spending.
Figure 13.9a plots the growth rate of real GDP, as well as the growth rates of the agricultural, industrial, and service sectors between 1550 and 1700 in Britain.
Which of the following statements can be deduced from the graph?
The growth rate of the industrial sector was more volatile than that of the service sector.
The agricultural sector largely drove fluctuations in GDP.
The following diagram shows the path of income for a household that receives news about an expected rise and fall in future income at the depicted times.
Assume that the household prefers to smooth out its consumption if it can. Based on this information, which of the following statements is correct?
If the household is credit-constrained and has 'weakness of will', then its consumption will match precisely its income path.
Consider a local economy comprising of just two firms, Firm A and Firm B. Currently both firms have low capacity utilization. The following table shows the profits (or losses if negative) when the firms invest or do not invest:
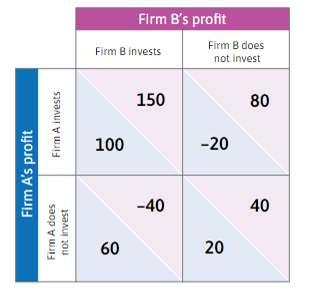
Based on this information, which of the following statements is correct?
To achieve the Pareto-efficient Nash equilibrium, the firms have to coordinate in some way or develop business confidence.
Figure 14.2 depicts a consumption function of an economy, where C is the aggregate consumption spending and Y is the current income of the economy.
Based on this information, which of the following statements is correct?
The MPC is normally less than 1 as some households are able to smooth their consumption.
The following are the labour market and the multiplier diagrams, representing the medium-run supply side and the short-run demand side of the aggregate economy, respectively:
Assume that the economy's production function is given by Y = N, where Y is the output and N is the employment. Based on this information, which of the following statements is correct?
The shifts in the aggregate demand cause short-run cyclical fluctuations in unemployment around the medium-run level shown in the labour market diagram.
The following diagram depicts the change in the aggregate goods market equilibrium when there is a €2 billion increase in investment.
The economy's marginal propensity to consume is 0.5. Based on this information, which of the following statements is correct?
The multiplier is 2.
Which of the following statements is correct regarding household wealth?
The total broad wealth equals material wealth plus expected future earnings.
Figure 14.9 depicts possible investment projects for Firms A and B.
Based on this information, which of the following statements is correct?
An expected rise in energy prices leads to a fall in the expected profit rates, resulting in fewer projects being profitable at a given interest rate. This results in reduced investment.
Figure 14.10c depicts the aggregate investment function of an economy.
Based on this information, which of the following statements is correct?
A forecast of a permanent demand increase shifts the investment line outwards.
The aggregate demand of an open economy is given by the after-tax domestic consumption C, the investment I (which depends on the interest rate r), the government spending G and net exports X - M:
Given this equation, which of the following increases the multiplier?
A fall in the marginal propensity to import.
Which of the following statements is correct? fiscal
A fiscal stimulus can be implemented by raising spending to directly increase demand, or by cutting taxes to increase private sector demand.
Which of the following statements is correct regarding the multiplier?
Reverse causation can be a problem when estimating the multiplier empirically.
If firms anticipate that the government's fiscal policy will be effective, then the multiplier will be higher.
Figure 14.16 shows the effects of France's increased government spending and tax cuts in 1982 on the economies of France and Germany. Based on this information, which of the following statements are correct?
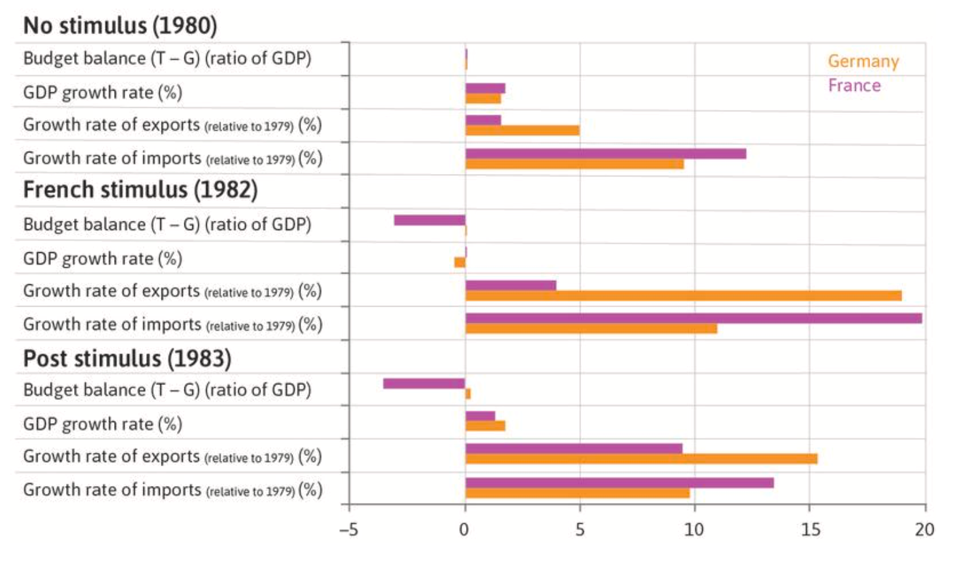
The French budget balance worsened by more than 3% as a result of the fiscal expansion.
The German economy benefitted from the spillover effect of higher French imports of German goods.