Experiment 3 - Part 3
1/9
There's no tags or description
Looks like no tags are added yet.
Name | Mastery | Learn | Test | Matching | Spaced | Call with Kai |
|---|
No analytics yet
Send a link to your students to track their progress
10 Terms
How did you calculate the theoretical vortex shedding frequency?
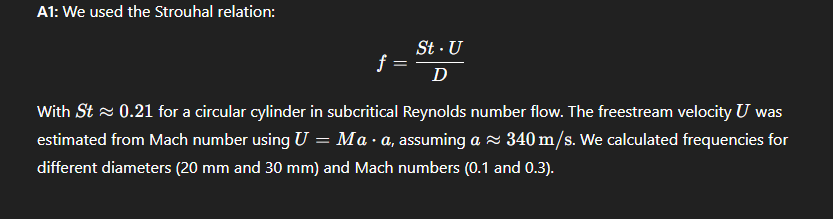
Q2: Why is the Strouhal number a useful benchmark in this context?
A2: It provides a predictive, dimensionless link between geometry and dynamic flow behavior (i.e., vortex shedding). By comparing measured frequencies with theoretical values, we can validate whether the 3HP is correctly capturing the dominant unsteady phenomena in the wake.
Q3: How was the shedding frequency extracted from the measured data?
A3: After converting the 3HP output to pressure (using Experiment 1 calibration), we applied a Short-Time Fourier Transform (STFT) using Hann windows. For each time slice, we identified the dominant frequency. The average of these over time gave the final measured vortex shedding frequency.
Q4: Why did you subtract the mean (DC offset) before spectral analysis?
A4: To eliminate any DC bias that could distort the frequency spectrum. Removing the mean ensures the signal is centered around zero, which improves the accuracy and clarity of the spectral analysis.
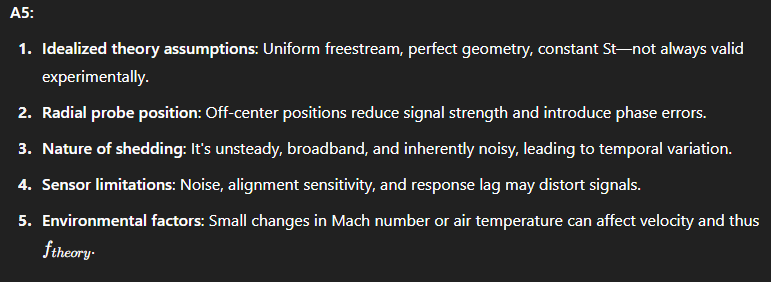
Q5: What were the main sources of error between theoretical and measured shedding frequencies?
Q6: How acceptable were the deviations between measured and theoretical values?
A6: The deviations ranged from ~19% to 34%, which is acceptable for this type of aerodynamic measurement. These are within expected experimental uncertainties given the complexity of the unsteady flow and the simplifications in the theoretical model.
Q7: Why does radial position affect the signal quality in 3HP measurements?
A7: Because vortex shedding is strongest near the centerline. Moving radially outward reduces the coherence and amplitude of pressure fluctuations, leading to weaker signals and higher uncertainty in frequency detection.
Q8: Why use STFT instead of regular FFT?
A8: STFT allows us to observe time-varying frequency content, which is critical because vortex shedding is not constant—it fluctuates due to turbulence. A standard FFT would only give us a global frequency distribution, ignoring temporal variations.
Q9: What are the key differences observed between cylinder and airfoil wake behavior?
A9:
Cylinder: Wide, deep wake highly sensitive to Mach number and diameter. Strong vortex shedding.
Airfoil: Thin, stable wake with little sensitivity to flow conditions. Indicates streamlined, efficient flow.
Q10: What did this experiment demonstrate about probe performance?
A10:
5HP: Best for steady-state flow mapping and accurate angle of attack calculations.
3HP: Effective for detecting dynamic wake behavior and vortex shedding, especially when analyzed using STFT.