Chapter 5: Perform the Analysis: Types of Data Analytics
 Call Kai
 Learn
Learn Practice Test
 Spaced Repetition
 Match
Match Flashcards
 Knowt Play
1/83

There's no tags or description
Looks like no tags are added yet.
84 Terms
The AMPS Model
In the AMPS model, we’re now going to look at Perform the Analysis.

There are four types of questions that drive data analysis:
What happened?
Why did it happen?
Will it happen in the future?
What should we do, based on what we expect will happen?
Descriptive analytics answers
“What happened?”
Did we make a profit last year?
Did return on assets improve or decline over the past year?
Did the airline company’s on-time departures improve this past month?
How much did we pay in federal taxes last year?
How long have the existing accounts receivable been outstanding?
Which product is the most profitable one for the company?
Diagnostic analytics answers
“Why did it happen?”
Why did advertising expense increase, but sales fall?
Why did sales, general and administrative expenses increase relative to the industry?
Why did overall tax increase even though net income did not?
Can our variance analytics help explain why the labor expenses increased over the past year?
Why were some checks greater than $10,000 signed by two members of management and others of similar size only signed by one?
Predictive analytics answers
“Will it happen in the future?”
What is the chance the company will go
bankrupt?Do we extend credit or not to customers based on customer background (credit score, employment record, existing debt)? Will they be able to pay back their loans?
Can the IRS find those individuals or corporations evading taxes using predictive techniques?
Can we predict when the financial statements might be misstated?
Prescriptive analytics answers
“What should we do based on what we expect will happen?“
If we have all 12/31 year- end audit clients, how will we organize our audit work in the new year?
How can revenues be maximized (or costs be
minimized) if there is a trade war with China?What is the level of sales that will allow us to breakeven?
Should the company lease or own their
headquarters office building?Should the company make its products or outsource to other producers?
These questions are covered throughout
the textbook: 1
Descriptive Analytics (Chapter 6).
What happened?
What is happening?
Diagnostic Analytics (Chapter 7).
Why did it happen?
What are the reasons for past results?
Can we explain why it happened?
Predictive Analytics (Chapter 8).
Will it happen in the future?
What is the probability something will happen?
Is it forecastable?
Prescriptive Analytics (Chapter 9).
What should we do, based on what we expect will happen?
How do we optimize our performance based on potential constraints?
Why would diagnostic analytics be arguably harder to
perform than descriptive analytics, figuring out what
happened as opposed to why it happened? What makes them different from each other?
Descriptive analytics addresses the questions of “What happened?” or “What is happening?”
Descriptive analytics are
analytics performed which characterize, summarize, and organize features and properties of the data to facilitate understanding.
Descriptive analytics summarize data:
Counts
Totals, sums, averages, subtotals
Minimums, maximums, medians, standard deviations
Graphs (bar charts), histograms
vertical analytics, horizontal analytics
Ratio analytics
Counts:
Show how frequently an attempt occurs.
How many times was taxable income greater than net income over the past five years?
Totals, sums, averages, subtotals:
Summarize measures of performance.
What is the balance of finished goods inventory on hand?
Minimums, maximums, medians, standard deviations:
Summarize measures showing extreme values to help explain what happened.
What was the greatest $ refund offered by the customer service department and who approved it?
Graphs (bar charts), histograms:
How long have receivables been outstanding for our company? Potentially answerable by creating an Accounts Receivable Aging Schedule.
Percentage change from one period to the next using vertical analytics, horizontal analytics, or common-size financial statements.
How much did cost of goods sold as a percent of revenues increase over the past two years?
Ratio analytics like return on assets, return on sales (profit margin), asset turnover ratios, debt-to-equity ratios:
Calculate important financial ratios for comparison.
Which retail company (for example, Amazon, Walmart, Target, Kroger) has the highest return on assets?
Here is an example of descriptive (summary) statistics for the retail industry:
Exhibit 5.3 Summary Statistics for the Retail Industry Reported in Recent Years

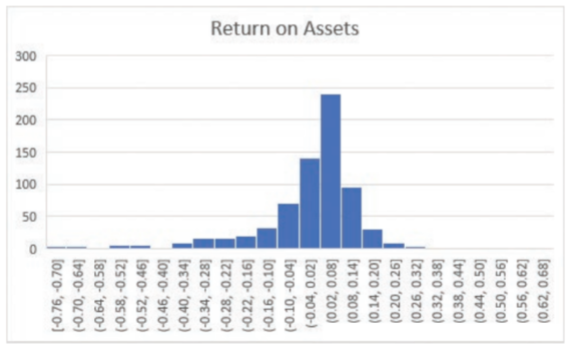
Here is the visual of descriptive statistics (histogram) for the retail industry
Exhibit 5.4 A Histogram of Return on Assets for the Retail Industry Reported in 2020
How would summing the total net income over the
past 4 years be considered descriptive analytics?
Diagnostic analytics addresses the questions of “Why did it happen?”
Diagnostic analytics are
analytics performed to investigate the underlying cause that cannot be answered by simply looking at the descriptive data but can be answered by various types of analyses.
Diagnostic analytics are useful for finding anomalies and relationships:
Identifying Anomalies/Outliers
Finding previously unknown linkages, patterns, or relationships between variables.
Performing Drill-Down Analytics
Determine Relations/Patterns/Linkages between
Identifying Anomalies/Outliers –
Often a first step in diagnostic analytics is to look for and identify unusual, unexpected results or transactions.
Performing Drill-Down Analytics –
look for patterns in the underlying data set by summarizing data at different levels and uncovering additional details to understand why something happened.
Determine Relations/Patterns/Linkages between Variables –
find the extent to which there are patterns in the data, or data moves together.
Diagnostic analytics can show how data compares to other data:
Sequence checks and sequence analytics
Duplicate Transactions
Variance analytics
Benford’s Law
Sequence checks and sequence analytics
Why are some check numbers missing documentation? Does it signify errors or fraud or can they be explained?
Duplicate Transactions
Why are there duplicates of some transactions in the
financial reporting records? Are they fraud or just errors?
Variance analytics
typically performed in management accounting), used to identify differences from expectations.
Why is the labor rate and labor use variance for direct labor at the manufacturing plant unfavorable?
Benford’s Law
used to identify fraud or irregular transactions.
Why do some refunds from Verizon offered by customer service representatives depart from the distribution expected by Benford’s Law? Are they associated with fraud?
Diagnostic analytics reveal previously unknown relationships:
Drill-downs and roll-ups
PivotTables (cross-tabulations)
Correlation/Regression
Hypothesis testing
Drill-downs and roll-ups
used to get detail when needed.
Which customers included in the total accounts receivable owing have the highest balance outstanding? Do some accounts need to be written off due to uncollectibility?
PivotTables (cross-tabulations)
Why were some transactions approved and recorded on the weekend?
Correlation/Regression
How are R&D expenses related to future firm profitability?
Hypothesis testing
Are Nordstrom’s sales returns as a percentage of sales higher during the holiday season (for example, Christmas, New Year’s, Hanukkah, etc.) as compared to non-holidays?
How would a test of Nordstrom’s sales returns around
the holiday season help us determine if and why sales
returns are different from the nonholiday season? How
would this be an example of diagnostic analytics?
Predictive analytics addresses the questions of “Will it happen in the future?”, “What is the probability something will happen?” or “Is it forecastable?”
Predictive analytics are
analytics performed to provide foresight by identifying patterns in historical data and assessing likelihood or probability.
Predictive analytics are used to identify unknown events in the future. 1
Classification
Regression
Forecasting Using Time Series Analytics
Classification –
A predictive analytics technique used to separate or classify a sample (or population) into two or more groups or classes.
Regression –
A predictive analytics technique used to predict a specific dependent variable outcome value based on independent variable inputs.
Forecasting Using Time Series Analytics –
A predictive analytics technique used to predict future values based on past values of the same variable.
Why would forecasting future sales, earnings and
cash flows be considered predictive analytics?
Prescriptive analytics addresses the questions of “What should we do based on what we expect will happen?” and “How do we optimize our performance based on potential constraints?”
Prescriptive analytics are
analytics performed which identifies best possible options given constraints or changing conditions.
Prescriptive analytics are useful for testing different scenarios.
Sensitivity Analytics -
Capital Budgeting -
Marginal (or incremental) analytics -
Sensitivity Analytics -
evaluation of outcomes based on uncertainty regarding the inputs.
What happens to Bank of America profits if the interest rates change from 3% to 4% or 5% or more?
Capital Budgeting -
evaluating future cash flows using various analytics techniques including net present value and internal rate of return.
What are the cash flows associated with an investment in a new piece of equipment at Boeing, or a new truck at JB Hunt?
Marginal (or incremental) analytics -
technique used to determine the change in profit associated typically with the cost or benefit of the next (or the marginal) unit.
Should Tesla make or buy their batteries?
Should Cisco sell its outdated routers at a bargain price?
Should Kellogg’s make new cereal products or stick with the existing ones?
Prescriptive analytics allows different inputs to forecast different outputs. 1
Goal Seek Analysis –
What-if Scenario Analytics -
Goal Seek Analysis –
a form of what-if analytics that tells us what will need to be done (or assumed) in order to reach a desired outcome, output or result.
For McGraw Hill, what are the needed sales to breakeven on sales of this textbook?
What-if Scenario Analytics -
analytics of potential future events by considering potential outcomes.
What are the possible income scenarios if there is a tax law change?
What is capital budgeting, and why is it considered to
be part of prescriptive analytics?
A summary of different types of data analytics
Exhibit 5.11 Circumplex of Descriptive, Diagnostic, Predictive and Prescriptive Analytics and Analytics Techniques

A sample is a subset of
a population of observations.
Population -
a group of phenomenon having something in common.
Sample -
a subset of members of a population selected to represent that population.
A parameter describes
the population
while a statistic describes
the sample.
Parameter –
a characteristic of a population (μ)
Statistic –
a characteristic of a sample (x̄)
Probability distributions appear in various forms.
Normal Distribution
Uniform Distribution
Poisson Distribution
Normal Distribution –
bell-shaped curve.
Uniform Distribution –
every outcome equally likely.
Poisson Distribution –
low mean and being highly skewed to the right; mean number of events per interval of space or time.
Normal Distribution, Means and Standard Deviations
Exhibit 5.13 Normal Distribution and the Frequency of Observations around its Mean

Hypothesis testing is used to identify phenomena.
Null Hypothesis (H0)
Alternative Hypothesis (HA)
Null Hypothesis:
assumes the hypothesized relationship does not exist, that there is no significant difference between two samples or populations
H0:We expect that there is no difference in sales returns between holiday and non-holiday season.
Alternative Hypothesis:
a hypothesis used in hypothesis testing that is opposite of the null hypothesis, or a potential result that the analyst may expect
HA: We expect that there will be greater sales returns during the holiday season as compared to the non-holiday season.
Alpha, p-values and confidence intervals help
determine strength of a result.
There are two types of results from a statistical test of hypotheses that may occur or may be interpreted in different ways:
the p-value and/or confidence intervals.
The p-value is compared to
a threshold value, called the significance level (or alpha). A common value used for alpha is 5% or 0.05 (as is 1% or 0.01).
If p-value > alpha:
Fail to reject the null hypothesis (that is, not significant result).
If p-value <= alpha:
Reject the null hypothesis (that is, significant result).
For example, if alpha (α) is 5%, then the confidence level is 95%
Therefore, statements such as the following can also be made:
With a p-value of 0.09, the test found that Saturday and Sunday sales are not different than Sunday sales, failing to reject the null hypothesis at a 95 percent confidence level.
This statistical result should then be reported to management, reporting the results of the statistical test.
The 95% of the figure represents the confidence interval—
we are 95%confident that the true population
parameter of Saturday and Sunday sales falls somewhere in that area. Generally, the 95% interval is + two standard deviations around the mean.
We can visualize the results of hypothesis
testing.
Exhibit 5.14 Statistical Testing Using Alpha, p-Values, and Confidence Intervals

Regression represents a line of
expected values.
We can think about this like an algebraic equation where y is the dependent variable and x is the independent variables, where y= f(x)
Let’s imagine we are considering the relationship between SAT scores and the college completion rate for first-time, full-time students at four-year institutions.
In this example y (college completion rate) = f (factors
potentially predicting college completion rate), including the independent variable SAT score (SAT_AVG).
We interpret regression output to determine how significant the results are.
Exhibit 5.16 Regression Results Explaining College Completion Rate

Analytics Types, Examples, and Excel Tools/Functions
Descriptive
Descriptive statistics such as counts, totals, sums, averages, standard reports, financial statements; histogram, box plots, graphs, charts
SUM(), COUNT(), COUNTIF(),AVERAGE(), SUBTOTAL(), MEDIAN(); Pivottables; quartiles, quintiles, deciles, charts/graphs Analysis toolpak: histogram, descriptive statistics
Analytics Types, Examples, and Excel
Tools/Functions
Diagnostic
Variances, differences from expectations, correlations, identify outliers/anomalies (fuzzy lookup); sequence testing, drill-downs and roll-ups to get detail when needed, pivottables (crosstabulations); principal component analysis clustering, hypothesis testing
Pivottables; Analysis toolpak: Testing of means of various groups (t-test), correlation, rank, and percentile
Conditional formatting Excel add-in: Fuzzy lookup
Analytics Types, Examples, and Excel
Tools/Functions
Predictive
Classifications, regressions, time series
Analysis toolpak: correlation, regression, forecasting sheet
Analytics Types, Examples, and Excel
Tools/Functions
Prescriptive
Optimization, what-if scenarios, sensitivity analytics, simulation, machine learning
What-if analytics, sensitivity analytics, scenario manager, goal seek, NPV(), I RR()
Let’s suppose we are comparing the ROA of retail
companies to the ROA of manufacturing companies. We perform a two-sample t-test, resulting in a p-value of 0.11. Assuming an alpha of 0.05, what can we conclude about these companies?
Excel’s Data Analysis Toolpak offers a variety of analytics tools. 1
Exhibit 5.20 Analytics Tools Available within the Data Analysis Toolpak

Which Data Analysis Toolpak tool would be most useful in predicting the level of sales a firm will experience, given its investment in advertising expense?
If we were trying to see if the amount spent on advertising expense increased the company sales, what would be the dependent variable, and what would be the independent variable in the regression? Would this be considered predictive analytics or descriptive analytics?