Chapter 16- The Nature of Communities
1/65
There's no tags or description
Looks like no tags are added yet.
Name | Mastery | Learn | Test | Matching | Spaced |
|---|
No study sessions yet.
66 Terms
Communities
Groups of interacting species that occur together at the same place and time
Practical definition of communities used by ecologists
Ecologists usually define communities based on physical or biological characteristics
Ecologists often define a community arbitrarily based on the questions they are posing
Ex: A study of marine invertebrates in seaweed might restrict the community to that interaction, and not include mussel-eating birds, etc.
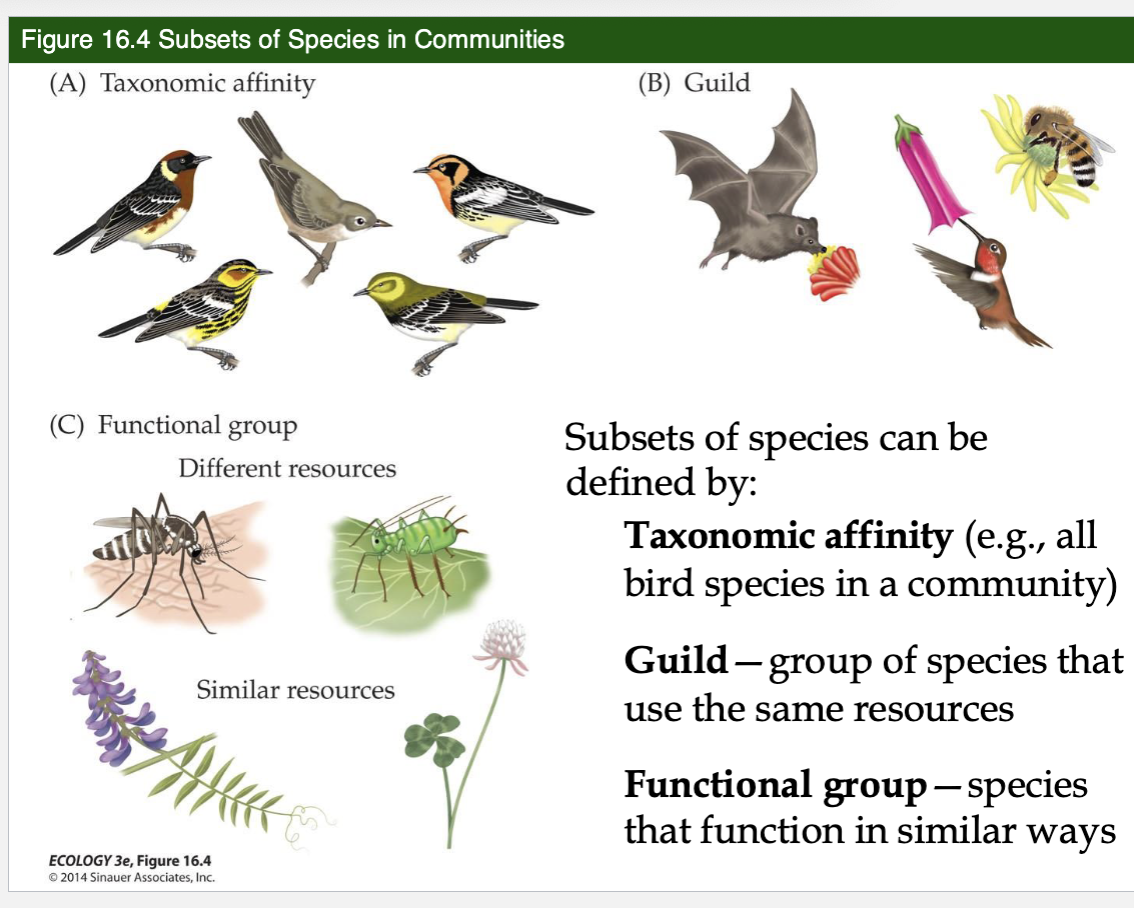
Subsets of species can be defined by 3 features
Taxonomic Affinity
Guild
Functional Group
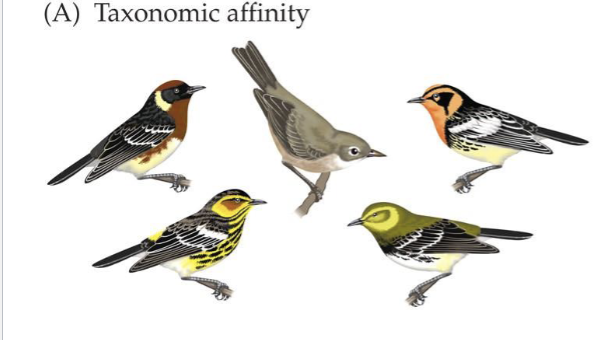
Taxonomic Affinity
Groups of species classified together because of evolutionary lineage
E.g. all bird species in a community
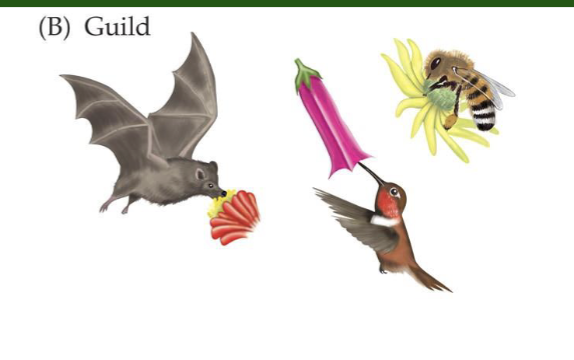
Guild
Group of species that use the same resource, even though they might be taxonomically distant
Ex: some birds, bees, and bats feed on flower pollen, thus forming a guild of pollen-eating animals
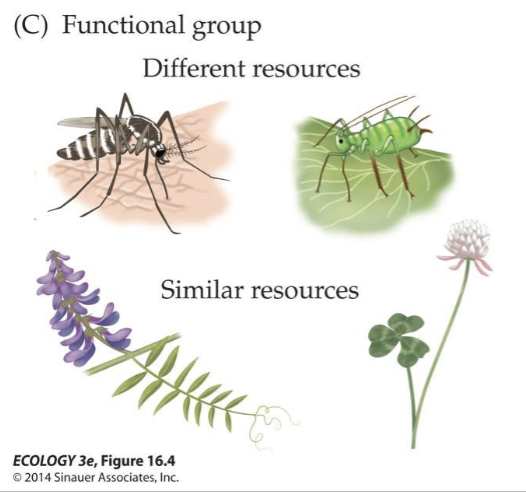
Functional Group
Species that function in similar ways but may or may not use similar resources
For example, nitrogen-fixing plants (legumes) can be placed in the same functional group
Ecologists often characterize communities based on transfer of energy via…
Trophic Interactions (or energetic interactions). The network of interactions is called a food web
Food web
a representation of the trophic or energetic connections among species within a community
What can food web be organized by?
Trophic levels
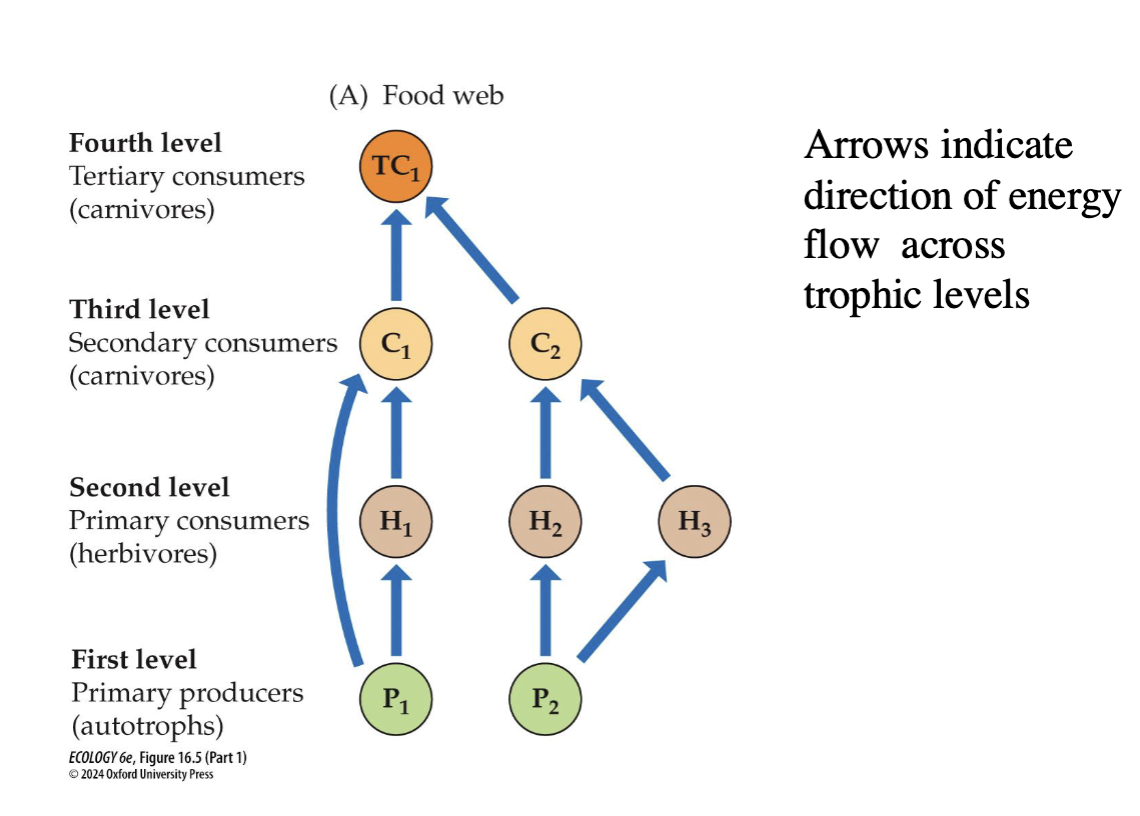
Trophic Levels
A measure of how an organisms obtains energy within a food web
Groups of species that have similar ways of interacting and obtaining energy.
Primary Producers
Autotrophs
Primary Consumers
Herbivores
Secondary Consumers
Carnivores
Tertiary Consumers
Carnivores
What is the variation in food web complexity based upom
The community structure, and (from an ecologist’s perspective) on the question being asked
What do food webs tell us little about?
Strength of interactions or their importance in the community
Ex: some species span the trophic levels, and some change feeding status as they mature
Some species are omnivores, feeding on more than one trophic level
Idealized foods webs often do not included important elements such as symbionts (including mutualists and parasites) and detritivores
Does not include noon-trophic interactions such as competition and some positive interactions
Detritus
Organic Matter
Detritivores (mostly fungi and bacteria)
Consume detritus through a process called decomposition
Horizontal interactions
Non-trophic interactions
Ex Competition and some positive interactions
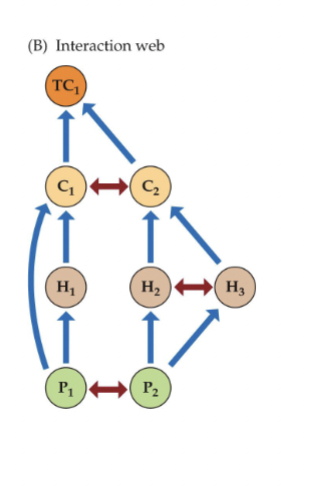
Interaction Web
More accurately describes both the trophic (Vertical) and Non-trophic (horizontal) interactions among the species in a traditional food web
2 descriptor components of community structure
Species Diversity
Species Composition
Community structure
The set of characteristics that shape a community
provides the necessary quantitative basis for generating hypotheses and experiments directed at understanding how communities work.
Species diversity
a measure that combines the number of species (species richness) and their abundances compared with those of the other species (species evenness) within the community
Species richness
the number of species in a community
Species evenness
which tells us about the commonness or rarity of species, requires knowing the abundance of each species relative to those of the other species within the community, a harder value to obtain
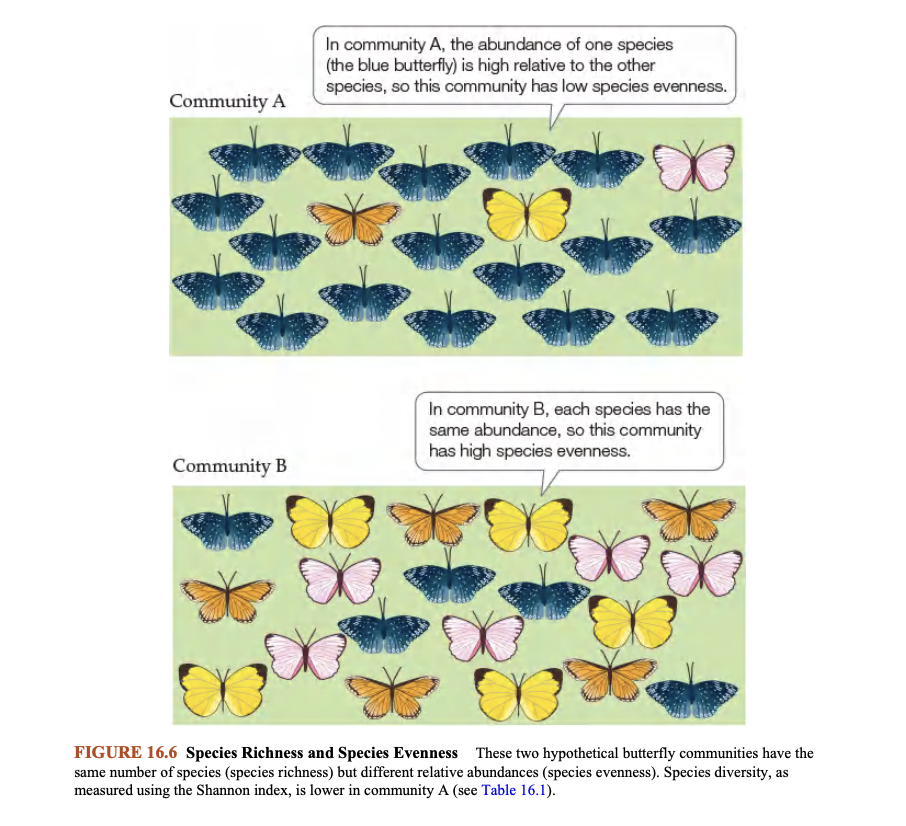
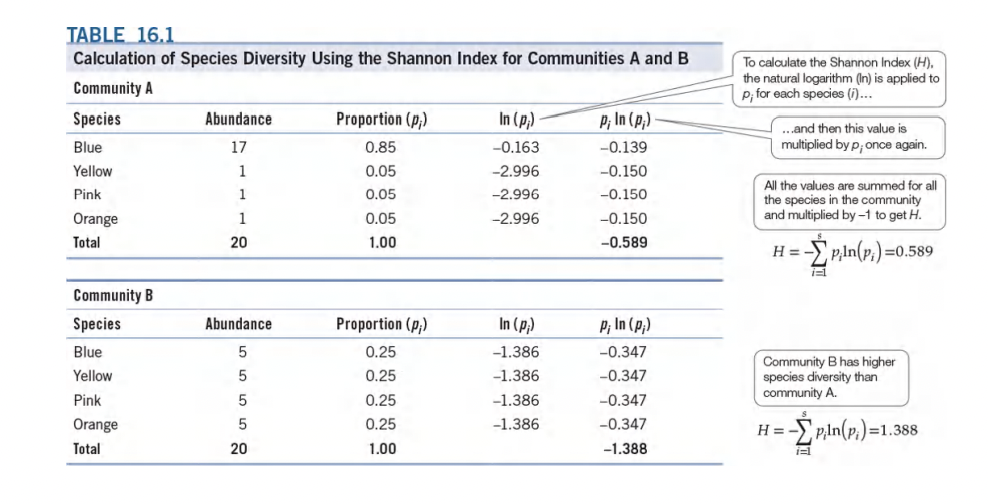
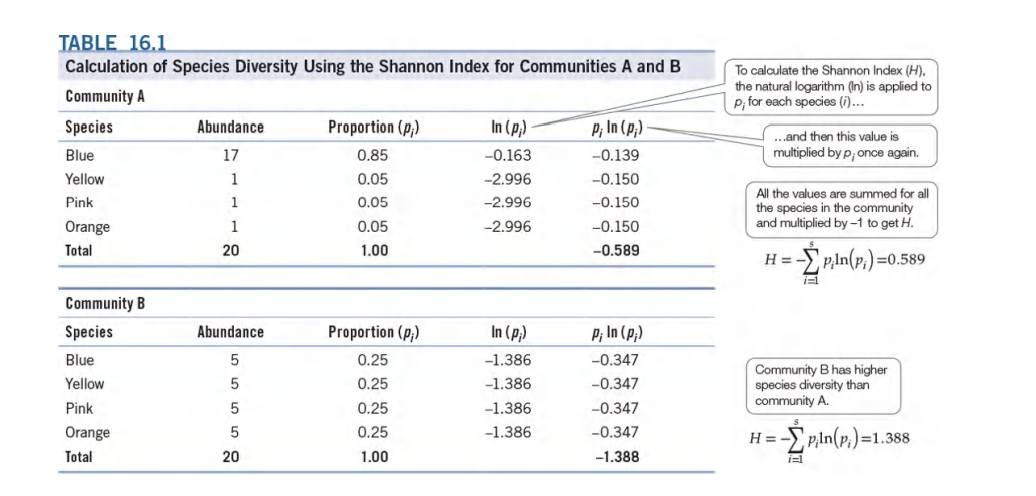
The contributions of species richness and species evenness to species diversity can be illustrated using a hypothetical example
Let’s imagine two meadow communities, each containing four species of butterflies. Both communities have the same butterfly species richness, but their species evenness differs. In community A, one species constitutes 85% of the individuals in the community, while the other four species constitute only 5% of the individuals in the community; thus, species evenness is low.
In community B, the number of individuals are evenly divided among the four species (25% each), so species evenness is high. In this case, even though each community has the same species richness (four species), community B has the higher species diversity because it has higher species evenness
Shannon Index
Commonly used species diversity index
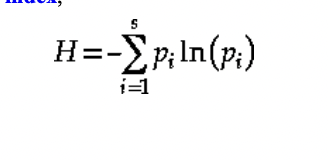
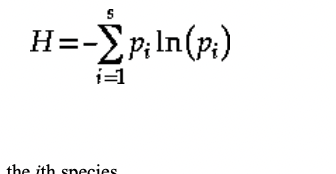
Shannon Index Formula
H= -∑pᵢ ln(pᵢ)
H= Shannon Index Value
pᵢ= = the proportion of individuals found in the ith species
ln = the natural logarithm s = the number of species in the community
Claude Shannon
Mathematician / engineer / computer scientists / unicyclist / juggler
His Master’s thesis laid the foundation for digital computing
He conceived and laid the foundations for information theory, which has been essential for the electronic communications networks that now lace the earth
Components of Shannon Index
The lowest possible value of H is zero. The higher a community’s H value, the greater its species diversity.
These calculations show that community A has the lower Shannon index value (H), confirming mathematically that this community has lower species diversity than community B.
Given that both communities have the same species richness, the difference in species diversity is driven by the lower species evenness in community A.
Biodiversity
Describes diversity at multiple spatial scales, from genes to species to communities.
Implicit in the term is the interconnectedness of genes, individuals, populations, species, and even community-level components of diversity.
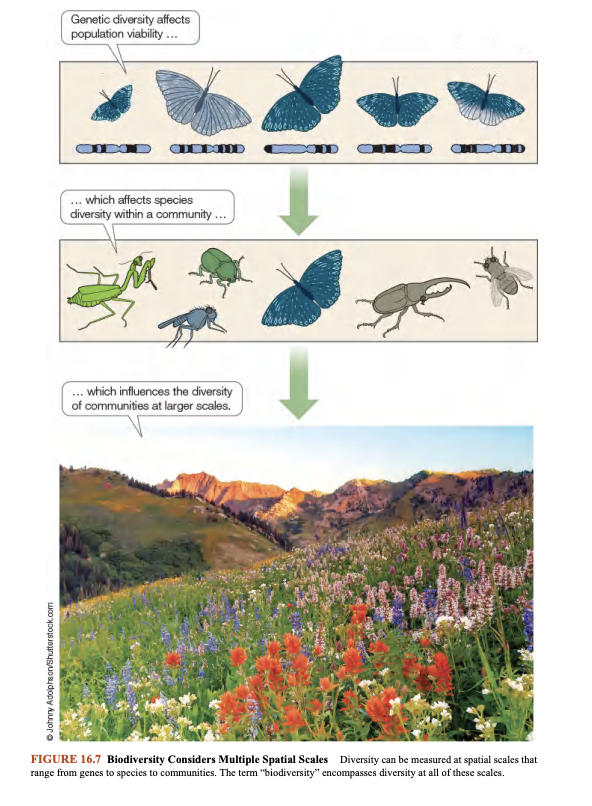
Population’s viability
its chance of persistence
genetic diversity among individuals within a population influences that population’s viability, which in turns affects species' diversity in a community
The number of community types in an area is critical to…
diversity at larger regional and latitudinal scales.
1 thing Species diversity indices allows ecologists to compare
Different communities
Graphical Representations of Species Diversities
Give us a more explicit view of the commonness or rarity of the species in communities
Rank Abundance Curve
Rank abundance curves
Plot the proportional abundance of each species (p ) relative to the others in rank order, from most abundant to least abundant
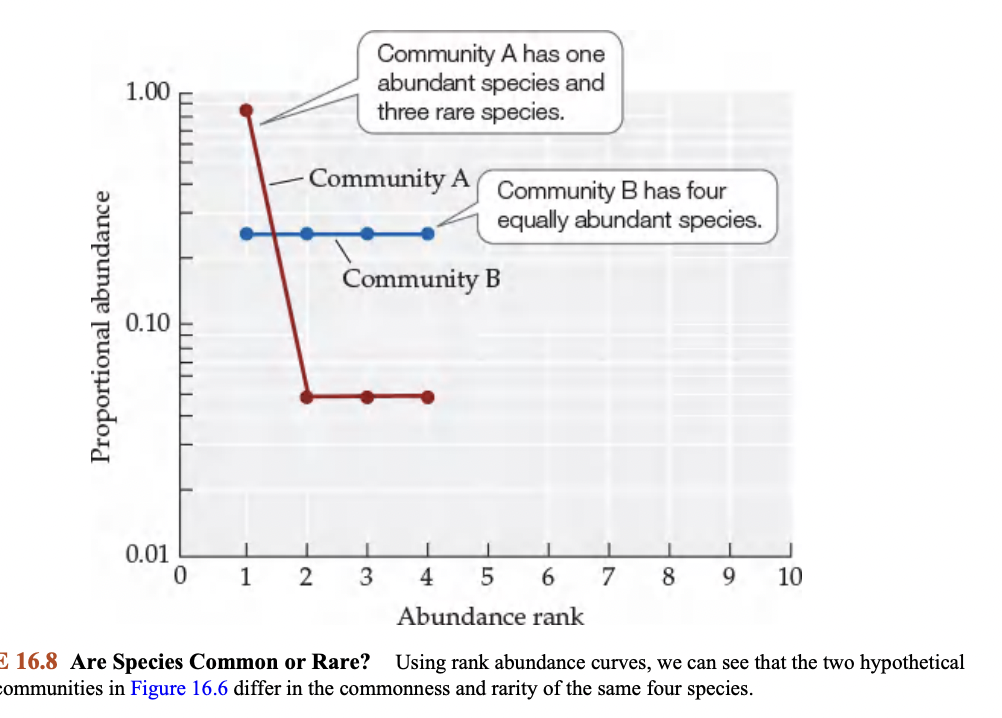
Outcomes of Figure 16.6
If we use rank abundance curves to compare our two butterfly communities from Figure 16.6, we can see i that community A has one abundant species (i.e., the blue butterfly) and three rare species (i.e., the yellow, pink, and orange butterfly species), whereas in community B, all the species have the same abundance
These two patterns could suggest the types of species interactions that might occur in these two communities. For example, the dominance of the blue butterfly in community A might indicate that it has a strong effect on one or more of the other species in the community. In community B, where all the species have the same abundance, their interactions might be fairly equivalent, with no one species dramatically affecting the others.
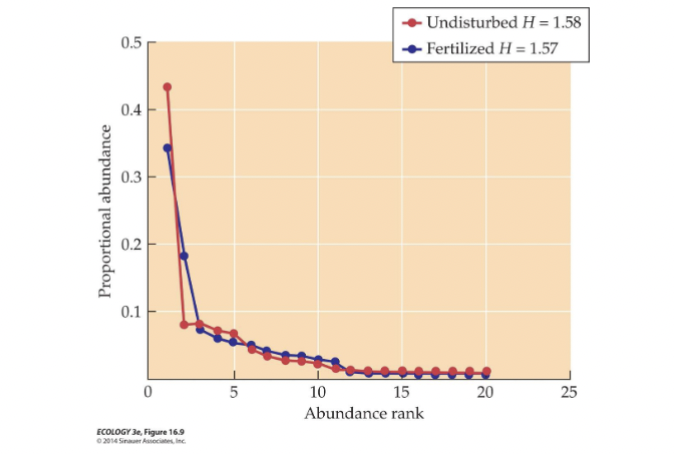
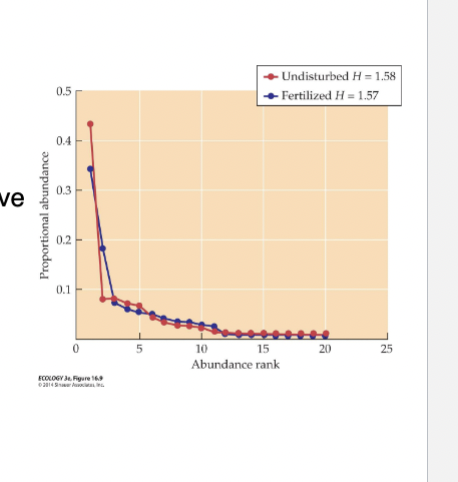
20 phylogenetic groups of bacteria were found in the fertilized / unfertilized pastures in Scotland
Species composition: Identity of species in a community.
Two communities could have identical species diversity values, but completely different species.
The identity of species is critical to understanding community structure
Species composition
Identity of species in a community
obvious but important characteristic that is not revealed in species diversity indices
For example, two communities might have the same species diversity value but have completely different members
In the case of the bacterial communities in Scottish pastures that we considered in, although diversity indices for two communities were nearly identical, their composition differed. Five taxonomic groups of bacteria out of the 20 the researchers found were present in one or the other pasture, but not in both.
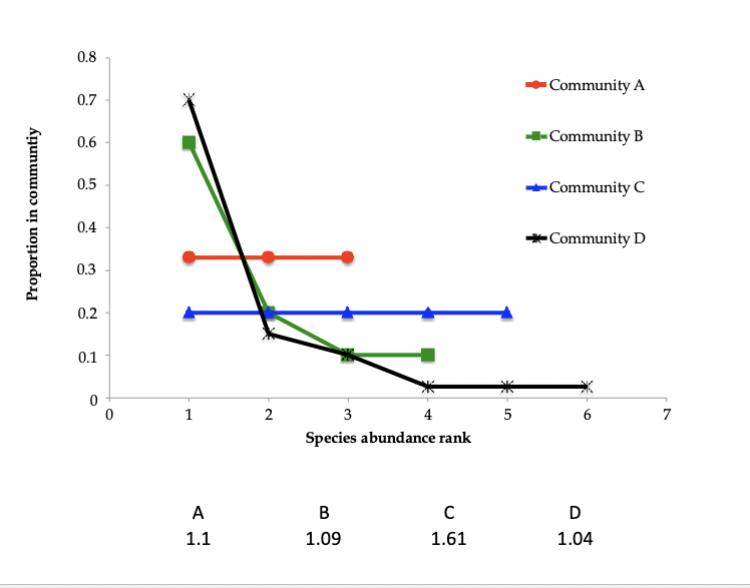
Whaat does this graph show?
Community A (1.1) and Community B (1.09), Community D (1.04): These values are very close to 1. This proximity indicates that each of these communities is highly dominated by one species, with the other species present in very low abundances. Essentially, even though there might be several species recorded, the contribution of most of them to the overall community is minimal.
Community C (1.61): A higher value like 1.61 suggests that the species in this community are more evenly distributed. In other words, rather than one species overwhelmingly dominating, several species contribute more significantly to the community’s overall makeup. This higher number can be viewed as indicating a modestly more diverse—and balanced—system compared to the others
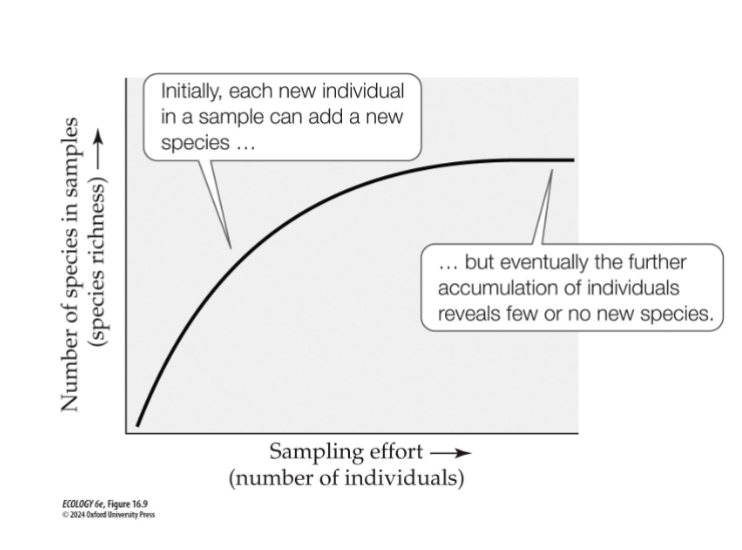
Species accumulation Curve
Species richness plotted as a function of total number of individuals counted.
These curves can help determine when most or all of the species in a community have been observed.
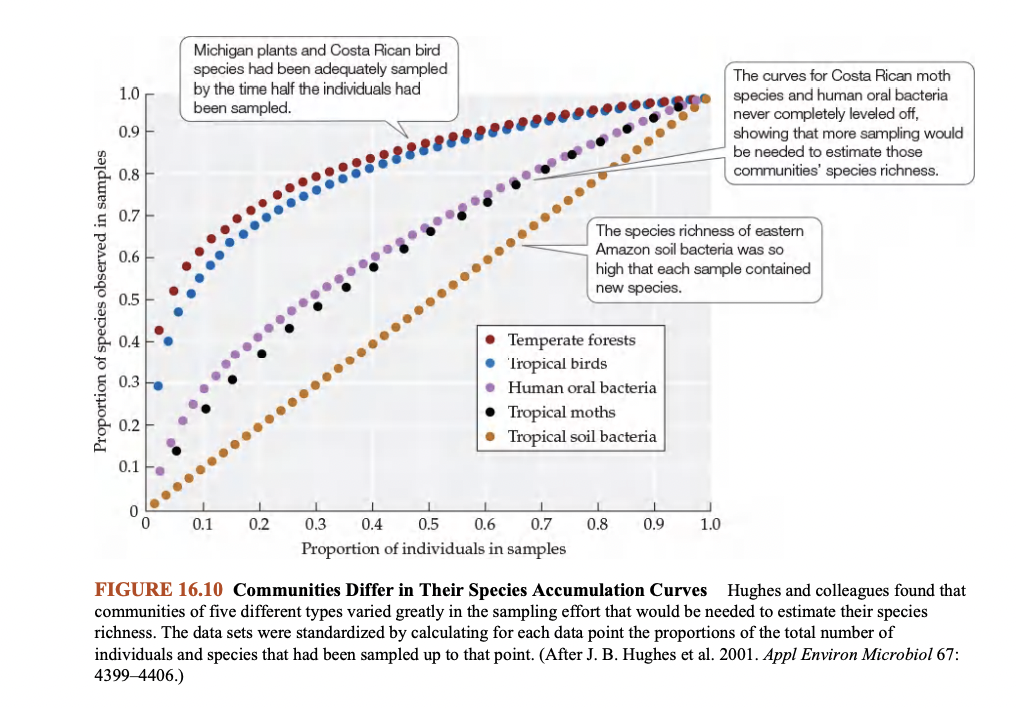
Hughes et al. (2001) compared species accumulation curves for five different communities.
Hughes and colleagues found that communities of five different types varied greatly in the sampling effort that would be needed to estimate their species richness.
A comparison of species accumulation curves not only provides valuable insight into the differences in species richness among communities, but also demonstrates the influence of the spatial scale at which sampling is carried out. For example, if we were to sample the richness of bacteria in tropical soils at the same scale at which we sampled Costa Rican moths, the bacterial richness would be immense in comparison. But such comparisons do suggest that our ability to sample all the bacteria in the human mouth is roughly equivalent to our ability to sample all the moth species in a few hundred square kilometers of tropical forest. The work of Hughes et al. also reminds us how little we know about the community structural characteristics of rarely sampled assemblages, such as microbial communities
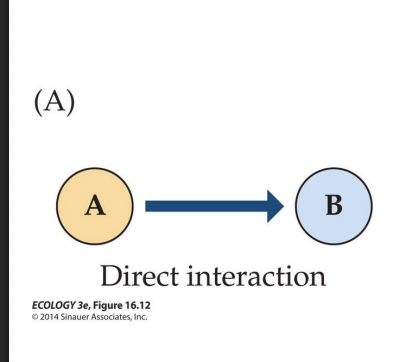
Communities are characterized by complex networks of…
Direct and Indirect interactions that vary in strength and direction
Direct Interactions
Between two species (e.g., competition, predation, facilitation).
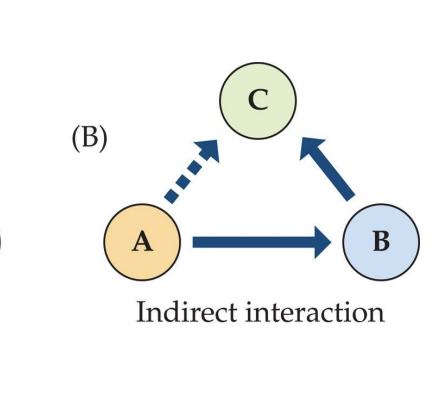
Indirect Interactions
The relationship between two species is mediated by a third (or more) species
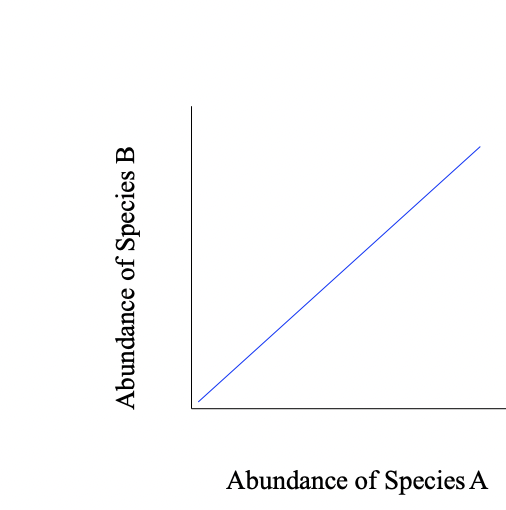
Positive interactions on graph
Positive (+). The sign refers to slope of this relationship
This can be interpreted as: As species A increases, species B increases
Or, as species A decreases, species B decreases
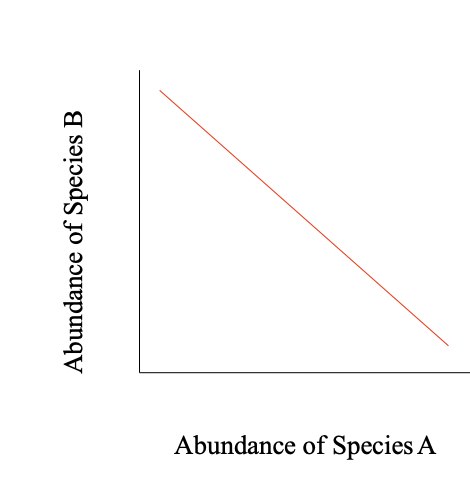
Negative interactions on graph
Negative ( - )
As speciesA increases, species B decreases
Or, as species A decreases, species B in increases
Drawing of Direct Interaction
Drawing of Indirect Interaction
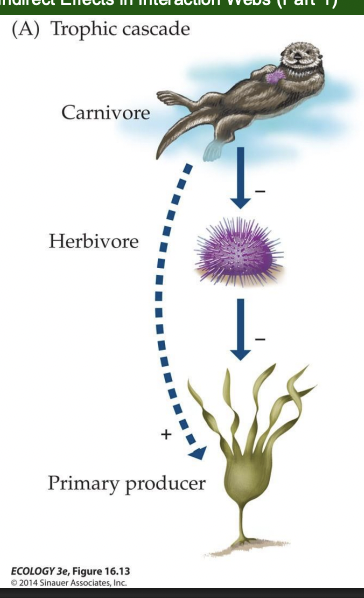
Trophic Cascade
Changes in abundance at one trophic level can affect abundance at other trophic levels.
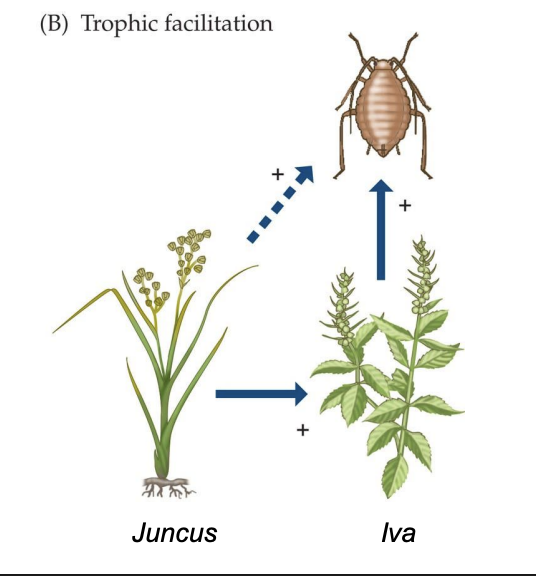
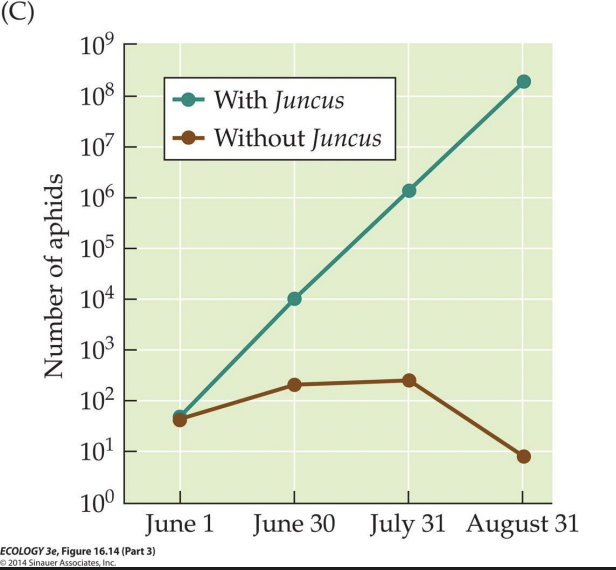
Trophic Facilitation
A consumer is indirectly facilitated by a positive interaction between its prey and another species.
Indirect Effects in Interaction Webs
Pay attention to the + or – symbols in the relationships
The overall effect of an indirect interaction can be determined by multiplying the signs of all the direct interactions together:
+ • + = +
+ • - = -
- • - = +
Results of Trophic Facilitation in a New England Salt Marsh
In summary, the graph demonstrates that in a New England salt marsh, Juncus exerts a strong trophic facilitation effect—its presence transforms the environment to allow aphid populations to multiply dramatically, while in its absence, conditions restrict aphid growth. This finding not only highlights the importance of specific plant species in shaping community dynamics but also offers insights into how modifications to a habitat could have cascading effects through the food web.
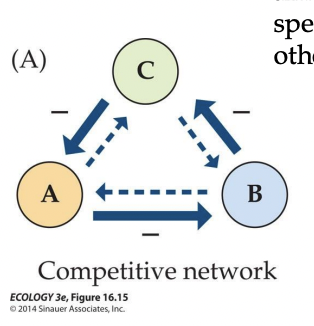
Competitive Networks
Interactions among multiple species in which every species has a negative effect on every other species.
In a network, as opposed to a linear hierarchical system, no one species dominates the interaction, allowing for coexistence.
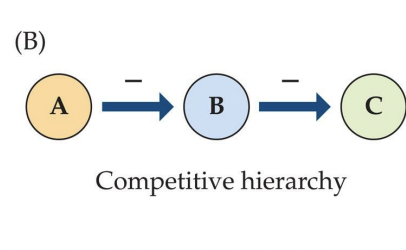
Competitive Hierarchy
one species dominates the interaction
Interaction Strength
Magnitude of the effect of one species on the abundance of another species
It is measured by removing one species (the interactor species) from the community and observing the effect on the other species (the target species).
Per Capita Interaction Strength Formula
(ln(C/E)) / I
LN = natural log (log base e)
C = Number of target individuals with interactor present
E = Number of target individuals with interactor absent
I = Number of interactor individuals
If C>E
Positive Interaction
If C<E
Negative Interaction
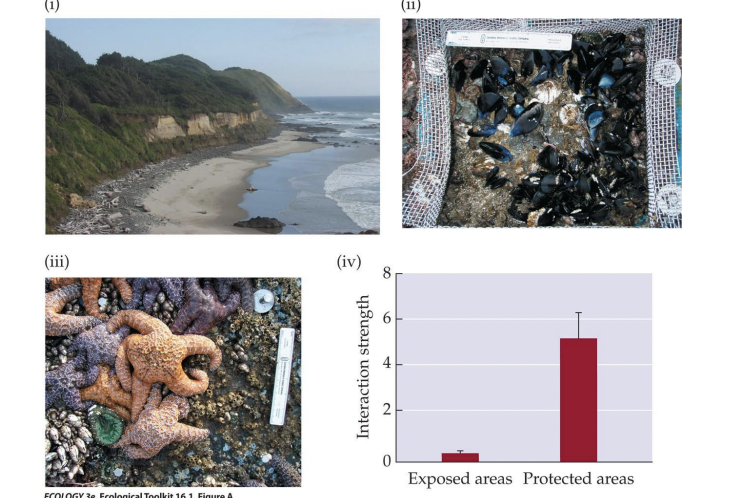
What did Menge et al. (1996) show?
interaction strength can vary based on environmental factors
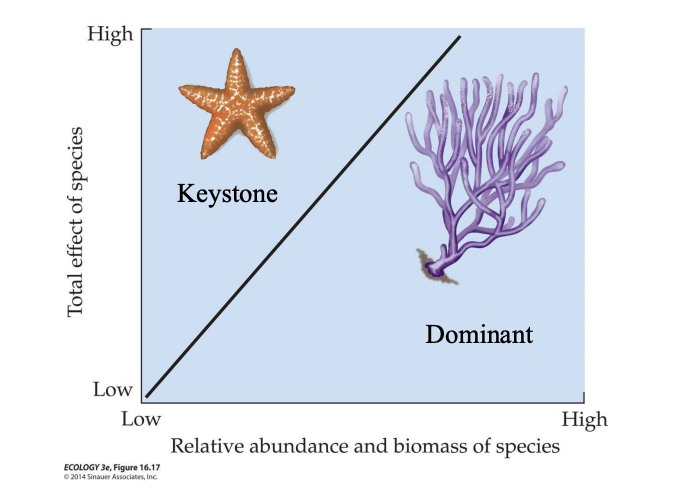
Dominant or foundation species:
have large effects on other species and species diversity, due to their considerable abundance or biomass.
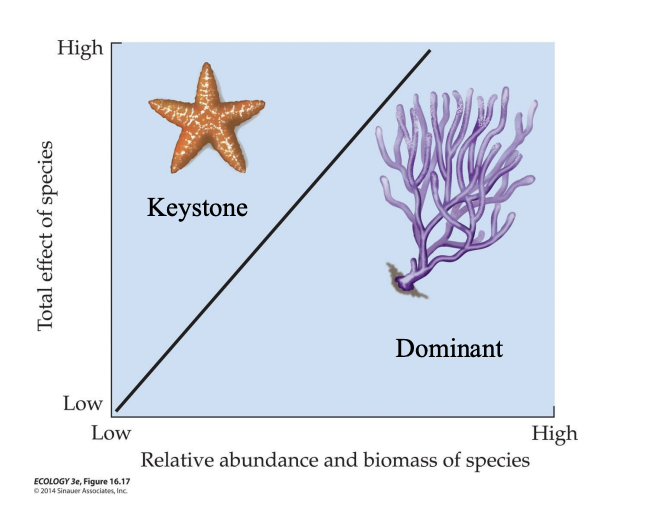
Keystone species
have strong effects because of their role in a community.
effect is large in proportion to their biomass or abundance.
usually influence community structure indirectly, via trophic means, as in the case of sea otters.
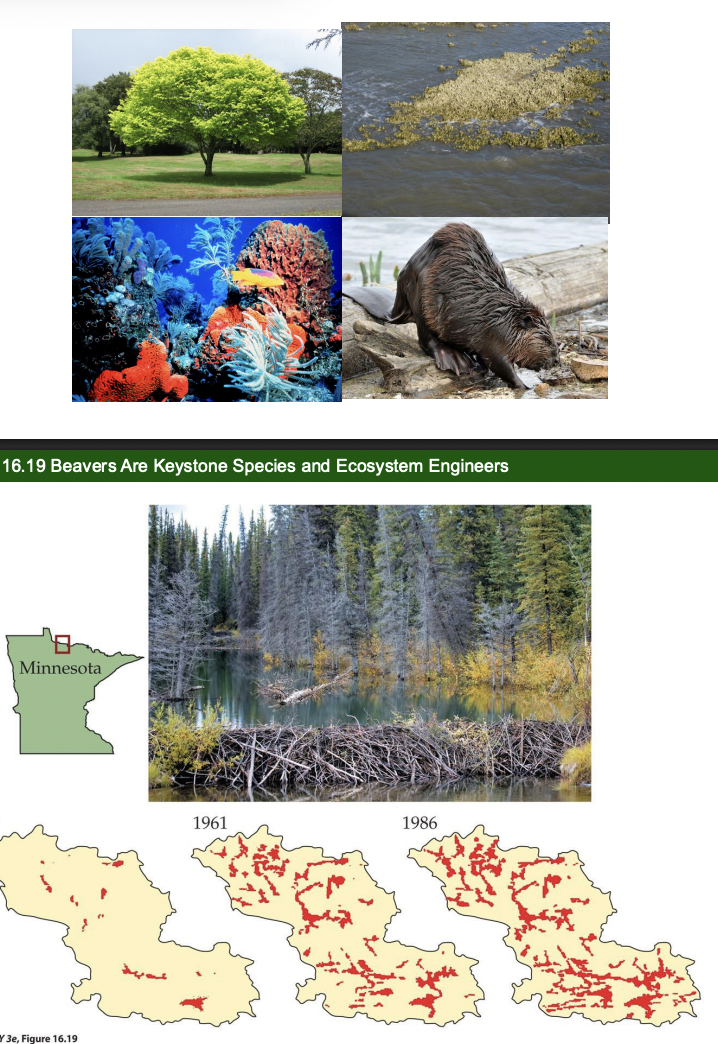
Ecosystem Engineers
create, modify, or maintain physical habitat for themselves and other species
Redundant species
having the same function as other species within a larger functional group.
They contribute to overall diversity but their presence or absence has little significance for the ultimate regulation of the community
Context- Dependent Species Interactions
changeable under different environmental conditions
Example: Some keystone species play important roles in their communities in one context, but not in others.
sea stars in protected vs. unprotected habitats