Apps Exam Revision Morning Of
1/81
There's no tags or description
Looks like no tags are added yet.
Name | Mastery | Learn | Test | Matching | Spaced |
|---|
No study sessions yet.
82 Terms
Linear Recurrence Relation
Tn+1=bTn+c , T1= a
Arithmetic Recursive Equation
Tn+1 = Tn+d , T1 = a
a = first term
d = common difference
Tn = term value
Arithmetic Explicit Rule for the nth term
Tn = a + (n - 1)d
Tn = term value
a = first term
n = term position
d = common difference
Geometric Recursive Equation
Tn+1 = Tn x r , T1 = a
a = first term
Tn = term value
r = common ratio
n = term position
Geometric Explicit rule for the nth term
Tn = a x rn-1
a = first term
r = common ratio
tn = term value
n = term position
Common Difference:
d = t2 - t1
Common Ratio
r = tn+1/tn
or
r = t2 / t1
or
r = any term / previous term
What kind of Graph is a Project Network
A Directed Graph
What is the Critical Path
The path that gives way to the minimum completion time
What will cause a delay in the completion of a project
Delays on activities on the critical path
What may cause a delay on the completion of a project
Delays on activities outside the critical path
Steps for finding Minimum Cost in a Hungarian Algorithm n x n matrix
1) Subtract smallest entry in each row from all entries in that row
2) Subtract smallest entry in each column from all entries in that column
3) Cross out all zero entries with a minimum number of horizontal & vertical lines
4) If the number of zero lines is n go to step 7. If the number of zero lines is less than n go to step 5.
5) Determine x, the smallest non-sero entry not crossed out by the lines. Subtract this entry from each uncrossed out entry. add x to each entry located at the intersection of zero lines.
6) Uncross all entries. Repeat steps 3, 4, & 5 until n zero lines are obtained
7). Assign worker to task according to location of the final zero entries.
Steps for finding Maximum Returns in a Hungarian Algorithm n x n matrix
Subtract each entry from the largest entry in the matrix - execute steps 1 to 7.
Define - Numerical Data:
A measurable quantity
Define - Categorical Data:
Describes a quality or characteristic
Define - Continuous, Numerical Data:
Values within a given interval
Define Discrete Numerical Data:
A set of distinct whole values
Define - Ordinal, Categorical Data:
Observations that can be ordered
Define - Nominal Categorical Data
Observations that have no order
Define - Extrapolation:
when the fitted model is used to make predictions using values of the explanatory variable that are outside the range of the original data. Extrapolation is a dangerous process as it can sometimes lead to quite erroneous predictions.
Define - Interpolation:
when the fitted model is used to make predictions using values of the explanatory variable that lie within the range of the original data.
Define - Residual Values:
The difference between the observed value and the value predicted by a statistical model, for example, by a least-squares line.
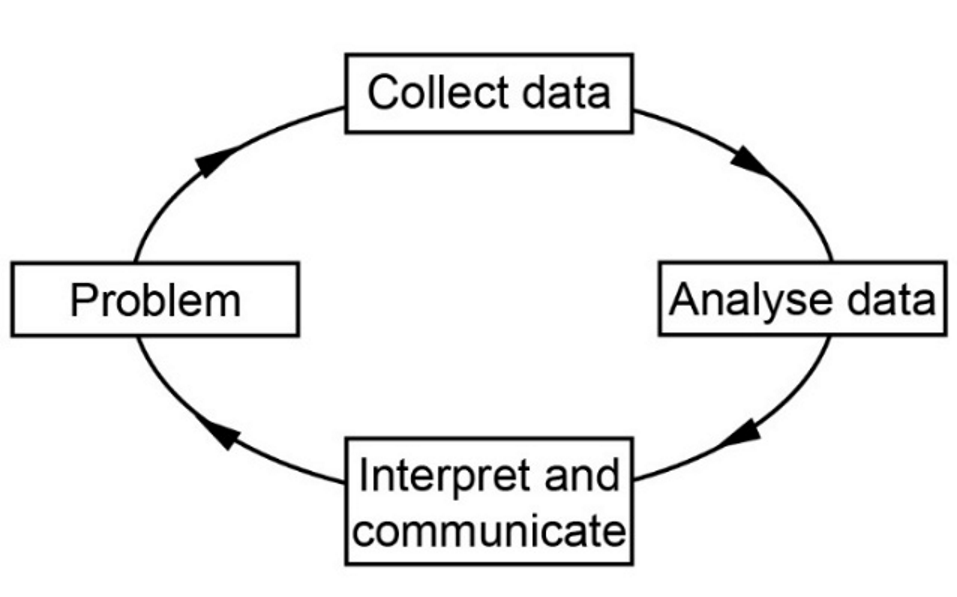
Statistical Investigation Process:
The statistical investigation process is a cyclical process that begins with the need to solve a real-world problem and aims to reflect the way statisticians work. One description of the statistical investigation process in terms of four steps is as follows.
Step 1.
Clarify the problem and formulate one or more questions that can be answered with data.
Step 2.
Design and implement a plan to collect or obtain appropriate data.
Step 3.
Select and apply appropriate graphical or numerical techniques to analyse the data.
Step 4.
Interpret the results of this analysis and relate the interpretation to the original question; communicate findings in a systematic and concise manner.
Define - Explanatory Variable:
(EV) is the variable used to explain or predict a difference in the response variable.
Define - Response Variable:
(RV) is the variable that is effected by the explanatory variable
Two Way Frequency Tables
A two-way table shows the relationship between two categorical variables.
When calculating percentages in a two-way frequency table always use the explanatory variable totals.
Discuss - Association:
Association means there is a relationship or connection between categorical variables.
Questions that may be asked to ascertain the credibility of a described association:
Method of data collection
Comparison of percentages rather than absolute numbers & vice versa
Exploration of other explanatory variables
To determine if there is an association move across the categories of the explanatory variables to see if the percentages of the categories in the response variable change, or if they’re the same.
If the percentage in the response variable do not change, it is reasonable to say there is no association.
If the percentages are different, it is reasonable to say there is an association between the two variables.
‘The table suggest that there is/isnt an association between ___ & ___ units & that ___ have a greater/lesser ___ for ____than ____.’
‘Although there us an observed association it cannot be concluded that the <insert explanatory variable> causes <insert response variable>, lurking variables may be contributing to the results.’
Scatterplots/Scattergraphs:
A visual display used to determine if there is an association between two numerical variables.
When construction a scatterplot, the x-axis (horizontal axis) is used for the explanatory variable, the y-axis, (vertical axis) is used for the response variable
Each point represents the value of two related variables in the data set.
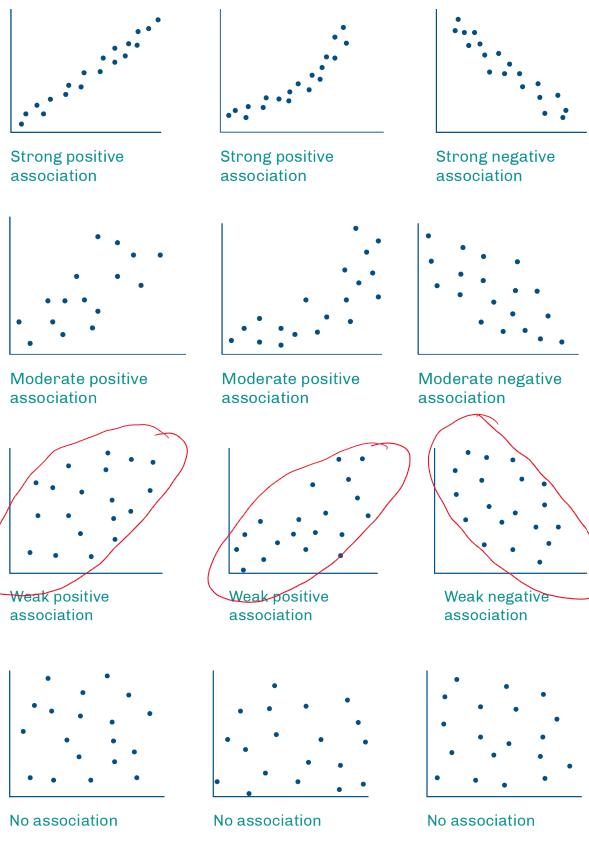
Description of a Scattergraph:
Form - Shape of the Data:
Linear
Non-Linear
No Relationship
Direction - If Linear:
Positive Correlation (as the EV increases, the RV increases)
Negative Correlation (as the EV increases, the RV increases)
Strength of the Association:
Refer to the attached image
Line of Best Fit
The line of best fit shows the trend for the association & is sometimes called the trend line.
The line of best fit is used to make predictions for the response variable.
Reliability of Prediction:
Reliability of prediction can be affected by:
Number of points on the scatter graph (more points more reliable)
Strength of the relationship (stronger
How would you display Categorical Data
With a frequency table &/or a stacked column graph
How would you display Numerical Data
With a scattergraph
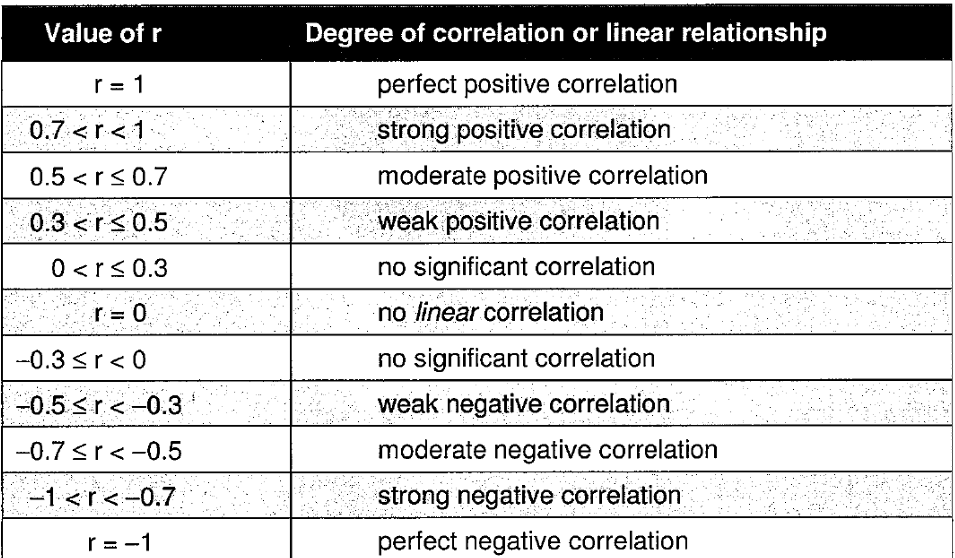
The Correlation Coefficient (r)
A measure of the relationship between two variables.
Define - Mean
The average of a set of data
Define - Mode
The score which occurs most often
Define - Median
The middle score when they scores are arranged in ascending or descending order
What are Measures of Spread
Range
Interquartile Range
Standard Deviation
Define - Range
The difference between the highest & lowest score
Define - Interquartile Range
Quartile 3 - Quartile 1
(the middle 50% of all scores)
What does Standard Deviation Measure
Standard deviation is a measure of the dispersion of a set of scores from the mean.
Define - Outlier
An outlier is an extreme score that lies outside the other scores.
Outlier lie out side the interval:
Scores that are less than: Q1 - 1.5 x IQR
Scores that are more than Q3 +1.5 x IQR
Outliers will impact the least squares regression line & the correlation coefficient.
To ensure the regression line is as accurate as possible, the outliers are often removed from the data (only remove outliers if instructed).
Interpreting the Value of the Gradient “a”
on average the <response variable> increases or decreases by <insert numerical value of gradient> <insert response variable units> for every one <insert explanatory variable unit> increase in the <explanatory variable>.
Interpreting the y-intercept “b”
The <response variable> is b <insert response variable units> units when the <explanatory variable> is zero <insert EV units>.
This value may not make sense in the context of the question, if this is the case, state “this is non-sensical in this context” and where possible, explain why.
Define - The Coefficient of Determination (r2):
Calculated by squaring the correlation coefficient - r.
It is a value between 0 & 1 used to measure how useful a line of best fit is as a linear model for a particular set of data, the higher the coefficient of determination, the stronger the association.
e.g., if r2 = 0.7, 70% of the variation in y is explained by the variation in x.
“<r2 as a percentage> of the variation in the <response variable> can be explained by the variation in the <explanatory variable>
Predictions from a Regression line
Reliable information - Interpolation
Less Reliable information - Extrapolation
Interpreting a Residual Plot:
If a residual plot is random then it is appropriate to use a linear regression line, If the residual plot displays a pattern then a linear regression is not appropriate.
Define - Bipartite Graph:
A graph whose set of vertices can be split into two distinct groups in such a way that each edge of the graph joins a vertex in the first group to a vertex in the second.
Define - Complete Graph:
A simple graph in which every vertex is joined to every other vertex by an edge. The complete graph with n vertices is denoted Kn.
A complete bipartite graph is a bipartite graph where every vertex of the first set is connected to every vertex of the second set.
Define - Connected Graph:
A graph is connected if there is a path between each pair of vertices.
A bridge is an edge in a connected that if removed leaves a graph disconnected.
Define - Cycle:
A closed path which begins & ends at the same vertex with no repeated edges or vetices except the first.
Define - Degree of a Vertex (Graph):
In a graph the degree of a vertex is the number of edges that enter or exit from the vertex, thus loops are counted twice.
Define - Directed Graph:
A directed graph is a diagram comprising points, called vertices, joined by directed lines called arcs - directed graphs are commonly called digraphs.
Euler’s Formula:
For a connected planar graph, Euler’s rule states that v + f - e = 2, where v is the number vertices, e is the number of edges & f is the number of faces.
Define - Eulerian Graph
A connected graph is Eularian if it has a closed trail (starts & ends at the same vertex), that is includes every edge & once only; such a trail is called an Eularian trail.
An Eularian trail may include repeated vertices.
A connected graph is semi-Eularian if there is an open trail that includes every edge once only.
Define - Loop:
A loop is an edge in a graph that joins a vertex in a graph to itself
Define - Multiple Edge:
A multiple edge is where two or more edges connect the same vertices.
Define - Hamiltonian Graph:
A connected graph is Hamiltonian if it contains a closed path (starts & ends at the same vertex), that includes every vertex (except the first one) once only.
No edge is repeated.
Define - Semi-Hamiltonian Graph:
Contains a path that includes every vertex in a graph once only but is not a cycle.
Define - Length of a Walk
The number of edges it includes
Define - Open Path
A path that starts & finishes at different vertices is said to be open.
Define - Open Walk
A walk that starts & finishes at different vertices is said to be an open walk.
Define - Path
A path in a graph is a walk in which all edges & vertices are different.
Define - Closed Path
A path that starts & finishes at the same vertex - a cycle is a closed path.
Define - Planar Graph:
A planar graph is a graph that can be drawn in the plane so that no two edges cross.
Define - Semi-Eulerian Graph
A connected graph is semi-Eulerian if there is an open trail that includes every edge once only
Define - Simple Graph:
A graph that has no loops or multiple edges
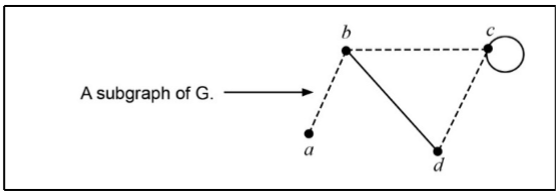
Define - Subgraph
When the vertices & edges of a graph are also vertices & edges of another graph is said to be a subgraph of graph G.
Define - Trail:
A trail is a walk in which no edge is repeated
Define - Walk:
A sequence of vertices such that from each of its vertices there is an edge to the next vertex in the sequence.
A walk can include repeated vertices or repeated edges
Define - Weighted Graph:
A graph in which each edge is labelled with a number used to represent some quantity associated with that edge
Define - Connected Planar
A graph that can be drawn in the plane so that edges only intersect at vertices where evert vertex is connected by an edge.
Define Traversable Network
Exactly two odd vertices or no odd vertices
Define Bridge
An edge that connects two graphs, without this edge the two graphs are not connected to each other
From an Adjacency Matrix how do you know if a Graph is Non-Directed:
Symmetrical across the leading diagonal
No loops - leading diagonal all zeroes
Sum of a row = degree of corresponding vertex for that row (+1 if there is a loop)
No multiple edges, all values in matrix are 0 or 1
From an Adjacency Matrix how do you know if a Graph is Directed
Not symmetrical across the leading diagonal
Sum of a row = out degree of the corresponding vertex
Sum of a column = in degree of the corresponding vertex
Define - Digraph
A graph with edges that are directed
Define - Eulerian Circuit
Covers every edge exactly once
starts & ends at the same vertex
All vertices are even
Define - Eulerian Trail
Covers each edge exactly once
Starts & ends at different vertices
Exactly two odd vertices
Define - Hamiltonian Cycle
Includes each vertex only once
Starts & finishes at the same vertex
Define - Hamiltonian Path
Includes every vertex exactly once
Starts & ends at different vertices
Define - Multiple Edge
Two or more edges connecting a pair or vertices