Epidemiological Studies Essay
 Call Kai
 Learn
Learn Practice Test
 Spaced Repetition
 Match
Match Flashcards
 Knowt Play
1/56

There's no tags or description
Looks like no tags are added yet.
Name | Mastery | Learn | Test | Matching | Spaced | Call with Kai | Chat |
|---|
No analytics yet
Send a link to your students to track their progress
57 Terms
Core public health disciplines
Epidemiology - study of distribution and determinants of disease frequency in human populations
Data/biostatistics - mathematical science of data analysis and the numbers that describe health in populations
environmental health - study of how the environment - natural or built — impacts human health and well-being
health management - strategic approach to mobilize societal resources to improve the health of populations
social/behavioral - study of the social determinants of health and behavioral modification to improve health
Prevalence (%)
total number of cases in a specified population at a specific time
# of cases/population at risk
Incidence
rate of new cases in a specified population over a defined period
# of new cases/population at risk per unit of time (per year)
Morbidity (%)
proportion of persons affected by a disease in a particular population
also refers to degree of pathology
Morality (%)
number of deaths per population at risk
ratio of the number of deaths to the number of population during a specified time-period (death-rate)
_____ used to measure disease. Why?
Mortality. - easy to determine, indicates severity, vital health statistics
YLL (Years of Potential Life Lost)
number of additional years of life that would have taken place in absence of disease
calculated by subtracting age of death from reference age
emphasizes diseases that kill younger persons
DALY (Disability adjusted life years)
measure of overall disease burden
years of healthy life lost due to ill-health, disability or early death
DALY = YLL + YLD (years lived with disability)
Epidemiology
studies patterns of disease occurrence in populations and the factors influening the pattern
derived from word epidemic
Who? When?, Where? = describe disease as well to control or prevent disease
Endemic
health conditions present in a population at a defined rate
Epidemic
sudden rise in endemic rate clearly exceeding normal levels
Facets of epidemiological investigations
1. counting the cases and determining their distribution by persons (who), place (where) and time (when)
2. use this information to determine possible cause of disease or outbreak
3. institute interventions to prevent or control disease based on findings
How did John Snow demonstrate epidemiological investigations
1. Cases - Who? cholera victims Where? London households When? 1853 cholera outbreak
2. Possible causation - Southwark/Vauxhall Water company, water being drawn form area of Thames contaminated with human fecal waste
3. Intervention - removed pump handle at Broad Street, cases decreased
Epidemiological studies used to __________
determine cause of disease and to test interventions
Descriptive epidemiology
who, where, and when questions (observational)
analytical epidemiology
examines relationships between exposures and outcomes in populations
cross-sectional
study that analyzes exposure and outcome data from a population at the ‘present’ time or limited period
prospective
follows individuals over time to observe and collect data on exposure and development of specific outcomes
retrospective
examines past exposures in individuals and their current outcomes
Cohort studies
healthy individuals are enrolled and observed over time to look for associations between exposure and outcomes
Case-control study
Compares people who have a specific outcome or disease (cases) to a similar group of people who do not have that outcome (controls) to identify past risk factors
Intervention studies
determine efficacy and safety of interventions (drugs, vaccines, behavior modification)
Nurses Health Study
cohort study that enrolled 120,000 married female nurses
send questionnaire every 2 years asking about diet, drinking, smoking, drugs, oral contraceptives (factors related to development of breast cancer)
Doll-Hill Study
smokers vs non-smoker mortality (10 years earlier) - analytical analysis
Strength of association
ratio of incidence in expose individual/ incidence of non-exposed individual

T/F Cohort studies are more efficient than case-control studies
False; case-control studies more efficient due to less people and less time
How are case-control studies conducted?
two groups (cases + controls)
determine exposure to factors that are possibly related to disease occurrence and progression
strength of association is determined with odds-ratio
how to calculate odds ratio (OR)

What do intervention studies test?
laboratory experiment: drugs or other intervention in individuals with disease, tests prevention
Error
Analytical epidemiology attempts to determine association between exposure and outcome
ALL studied are subject to error
Biological Variation
Fluctuation of biological processes in the same individual over time
Sampling Error
Random influences on who or what is selected for the study
Measurement error
random fluctuations in measurement (including medical services)
systematic error
not randomly distributed between exposed and unexposed subjects in a study —> consistent deviation from the true value
affect validity of study
Sampling error
random sampling error: potential source of variation between samples
systematic sampling error: the test group does not reflect the population being studied
Human behavior and experience are difficult to control
true
What study used to follow individuals and observe their diet
Cohort study - not require people to change their behavior
What study used individuals with heart disease vs healthy individuals
case control study - questions about diet over past 5 years
What biases are present?
Reporting + recall bias (diet intake unreliable)
Investigator/observer vias (investigators may favor certain outcomes)
Confounding variables
Systematic error
another factor is associated with exposure which affects the outcome
Example: Researchers notice that people who drink more coffee tend to have higher rate of lung cancer
Trap: coffee causes lung cancer
Confounding variable: smokers drink more coffee and also get lung cancer much more often
effect modification
occurs when the effect of one exposure on an outcome changes across the levels of a third background variable
Interaction
happens when two distinct exposures have a combined effect that is different from the sum of their individual effects
Can we believe epidemiological studies
Interpreting epidemiological studies is difficult
Biases and confounders must be controlled
Epidemiological studies of the risks of daily life are frequently and eagerly reported by the popular press
Correlation does not prove causation
Epidemiological studies identify associations or correlations between exposures and outcomes (roosters crow associated with sunrise, but does not cause it)
statistics used to quantify these associations.
Uncertainty
integral part of science
contradictory results from studies are common
statistics used to assist in decision making
sources of uncertainty
random error: unpredictable fluctuations in measurement or observation
systemic error: a bias pushes results in one direction including confounding variables
Mean, median, mode, range, variance, standard deviation
mean -average
median - middle value
mode - most common value
range - highest + lowest difference
variance - squared difference average of mean
standard deviation - square root of variance
probability
hypothesis testing
P value
scientist quantify uncertainty by measure probabilities
p value of .05 means that if an experiment was repeated 100 times, 95 times would yield same result and 5 times would yield different result
Confidence interval
range of values which likely contains true result (reliability)
T/F statistical significance means that there is a biological and clinical significance
FALSE - does not always mean
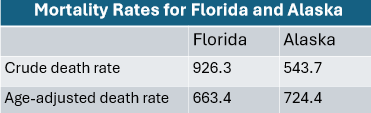
death rates are often adjusted
P value misconceptians
Low p values do not prove the hypothesis
p values suggests an effect exists, but says nothing about the size of the effect or its clinical or practical importance
sample size sensitivity —> in large datasets trivial differences can yield significant p-values
Cause-effect + 4 attributes that increase support
epidemiological studies cannot prove cause-and-effect
a large sample size is more likely to yield valid results than a small study
high relative risk or odds ratio values indicate a stronger association between exposure and outcome
A dose-response relationship between exposure and outcome
a biological explanation makes argument more convincing
John Graunt
publishes landmark analysis of morality data
detect new threats, identify special risk groups, plan public health programs, evaluate efficacy of programs, and prepare government budgets
Government agencies
National center for health statistics, part of CDC
Collects data from local governments, repository for vital statistics, conducts periodic surveys from representative populations
National Health and Nutrition Examination Survey - every year, 5000 individuals from 15 countries are visited and detailed data collected
behavioral risk factor surveillance survey
Data collected
vital statistics - births and deaths are most reliable data collected
The census - conducted every 10 years. denominator to calculate rates (information on age, sex, race, socioeconomic characteristics