Stats unit 1-2
1/33
There's no tags or description
Looks like no tags are added yet.
Name | Mastery | Learn | Test | Matching | Spaced | Call with Kai |
|---|
No study sessions yet.
34 Terms
Define Statistics
Science of dealing with, the collection the collection, analysis, interpretation, and presentation of numerical data.
What is the Population Vs. the Sample…
Population, the whole, is the whole set of data (I.e. the census gathering information about the entire population).
Sample is a portion of the population, but must be large enough to represent the entire population.
What is the difference between descriptive and inferential stats?
Descriptive stats provide a description of what the data shows. They summarise and present data you already have (e.g., mean, median, charts, tables). No conclusions beyond the sample.
Inferential statistics is when you use the data to infer/ make predictions about a larger population (involves hypothesis testing, confidence intervals, regression etc.)
What is the difference between a parameter and a statistic
Parameter: - descriptive measure of the population. - represented by Greek letters: µ population mean, σ² population variance, σ population standard deviation.
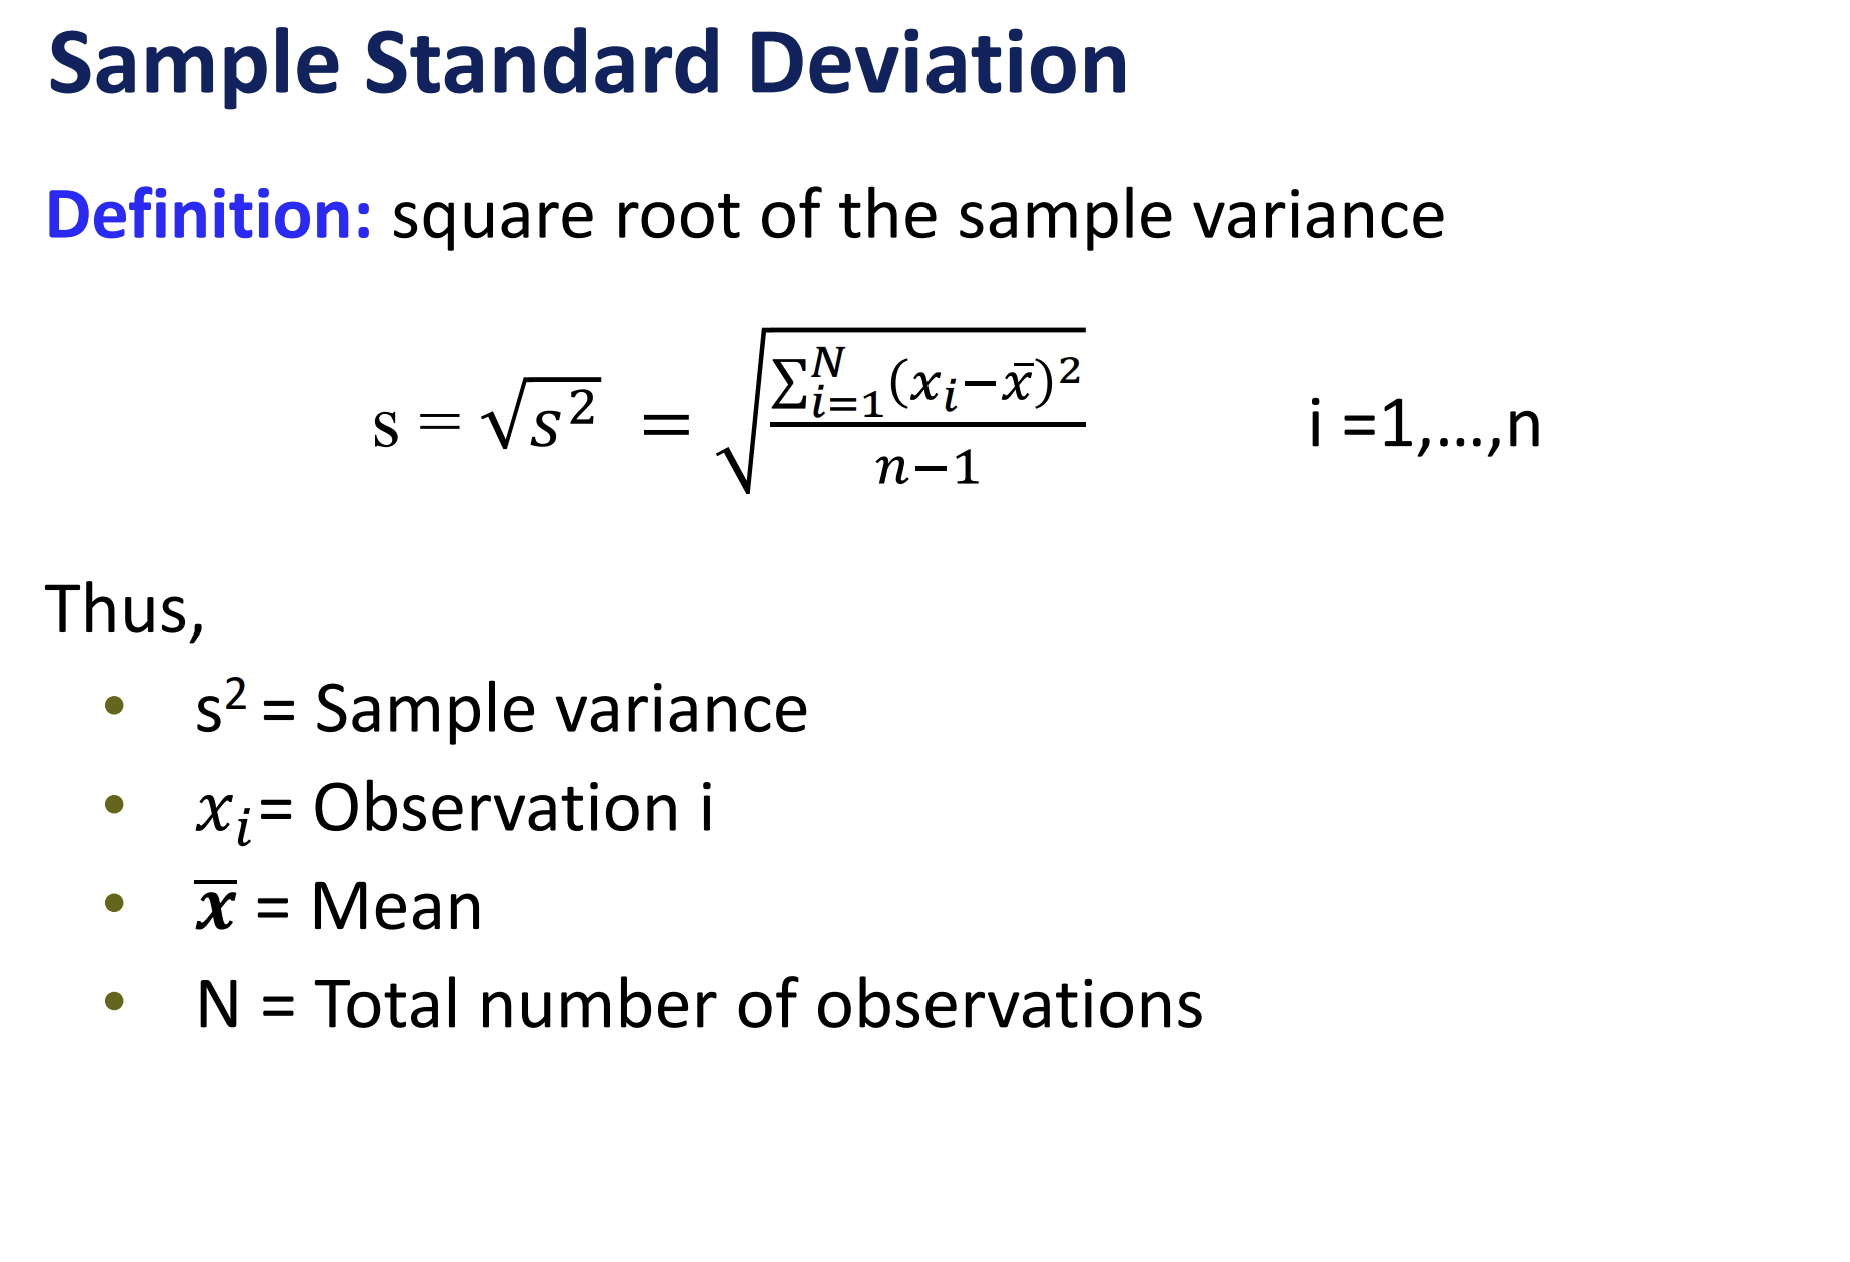
Statistic: - descriptive measure of a sample. - represented by Roman letters: 𝑥 sample mean, 𝑠² sample variance, 𝑠 sample standard deviation.
Four common levels of data measurement
Nominal
Ordinal
Interval
Ratio
Nominal
Numbers are just used to classify or categorize. Like a basketball player with jersey number 30 is not any better than one with number 15.
Example: Employment Classification
1 for Educator
2 for Construction worker
3 for Manufacturing worker
Ordinal
A variable is ordinal measurable if ranking is possible for values of the variable.
For example, a gold medal reflects superior performance to a silver or bronze medal in the Olympics
Interval
Numerical data with equal spacing between values, but no true zero.
You can compare differences (e.g., 5°C hotter), but ratios don’t make sense (you can’t say “twice as hot”).
Examples: temperature (°C/°F), dates, IQ scores.
Ratio
Numerical data with equal spacing between values and a true zero point.
You can compare differences and ratios (e.g., “twice as heavy”).
Examples: height, weight, age, income, distance.
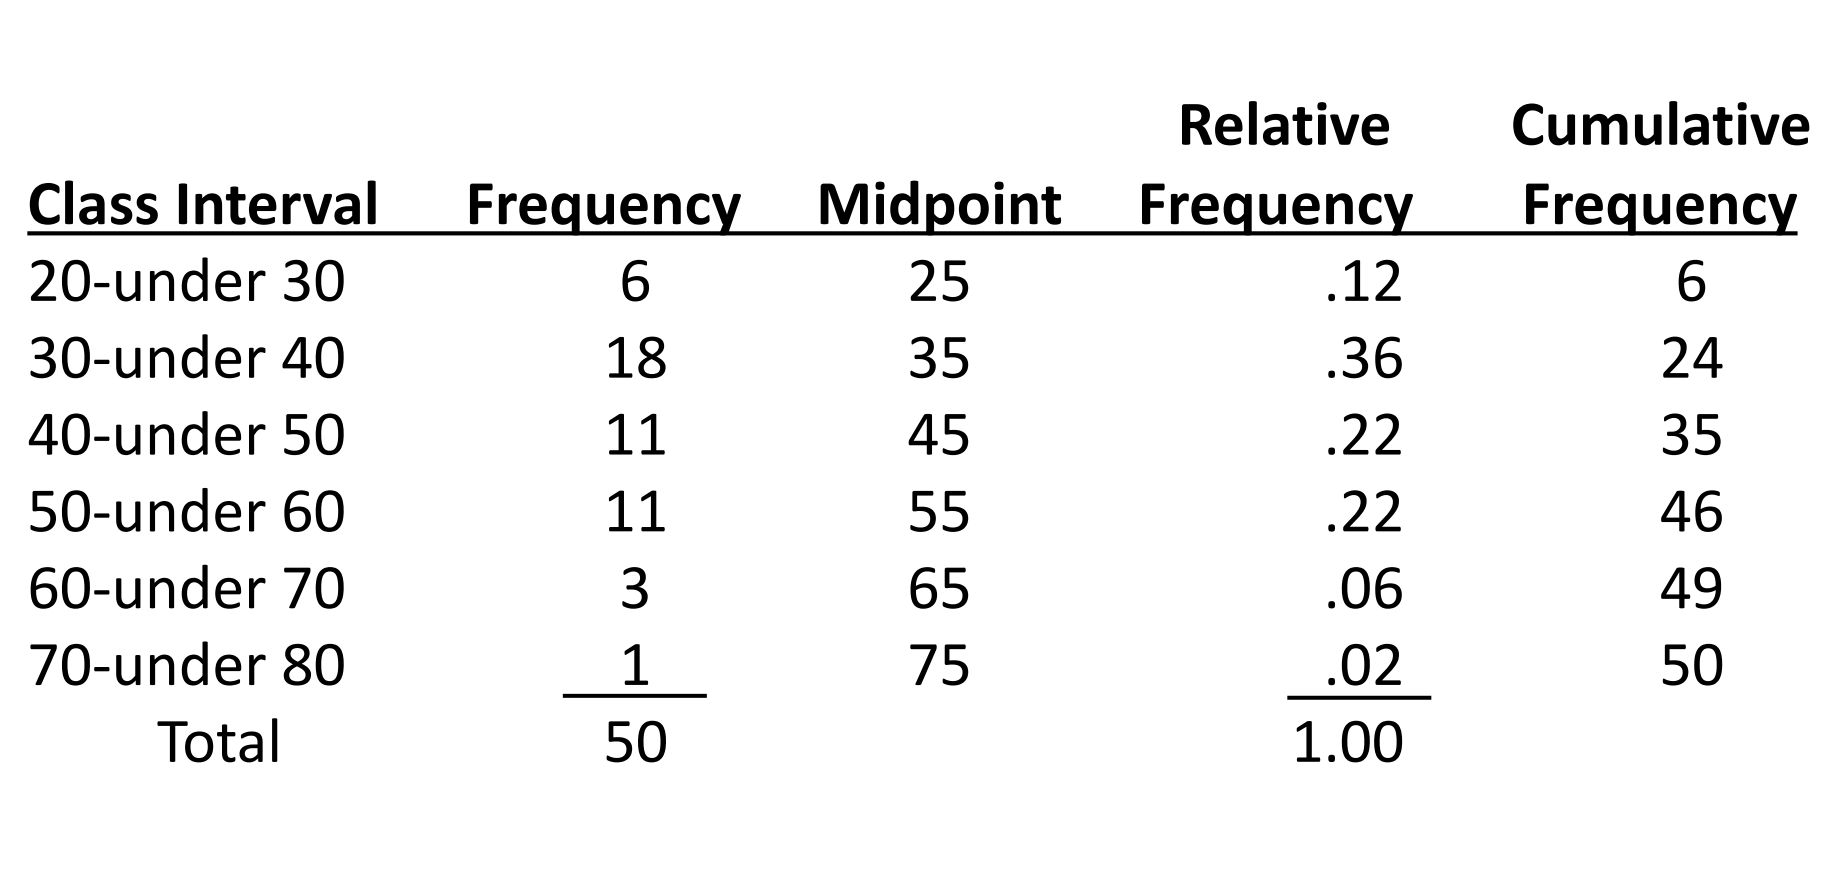
What is Grouped data Vs. Ungrouped data
Ungrouped data: has not been organized in anyway and is also called raw data
Grouped data: has been organized into a frequency distribution.
What is a frequency distribution
A frequency distribution is a summary of data presented in the form of class intervals and frequencies.
What is Bimodal?
in a tie for the most frequently occurring value, two modes are listed
What is multimodal
data sets that contain more than two modes
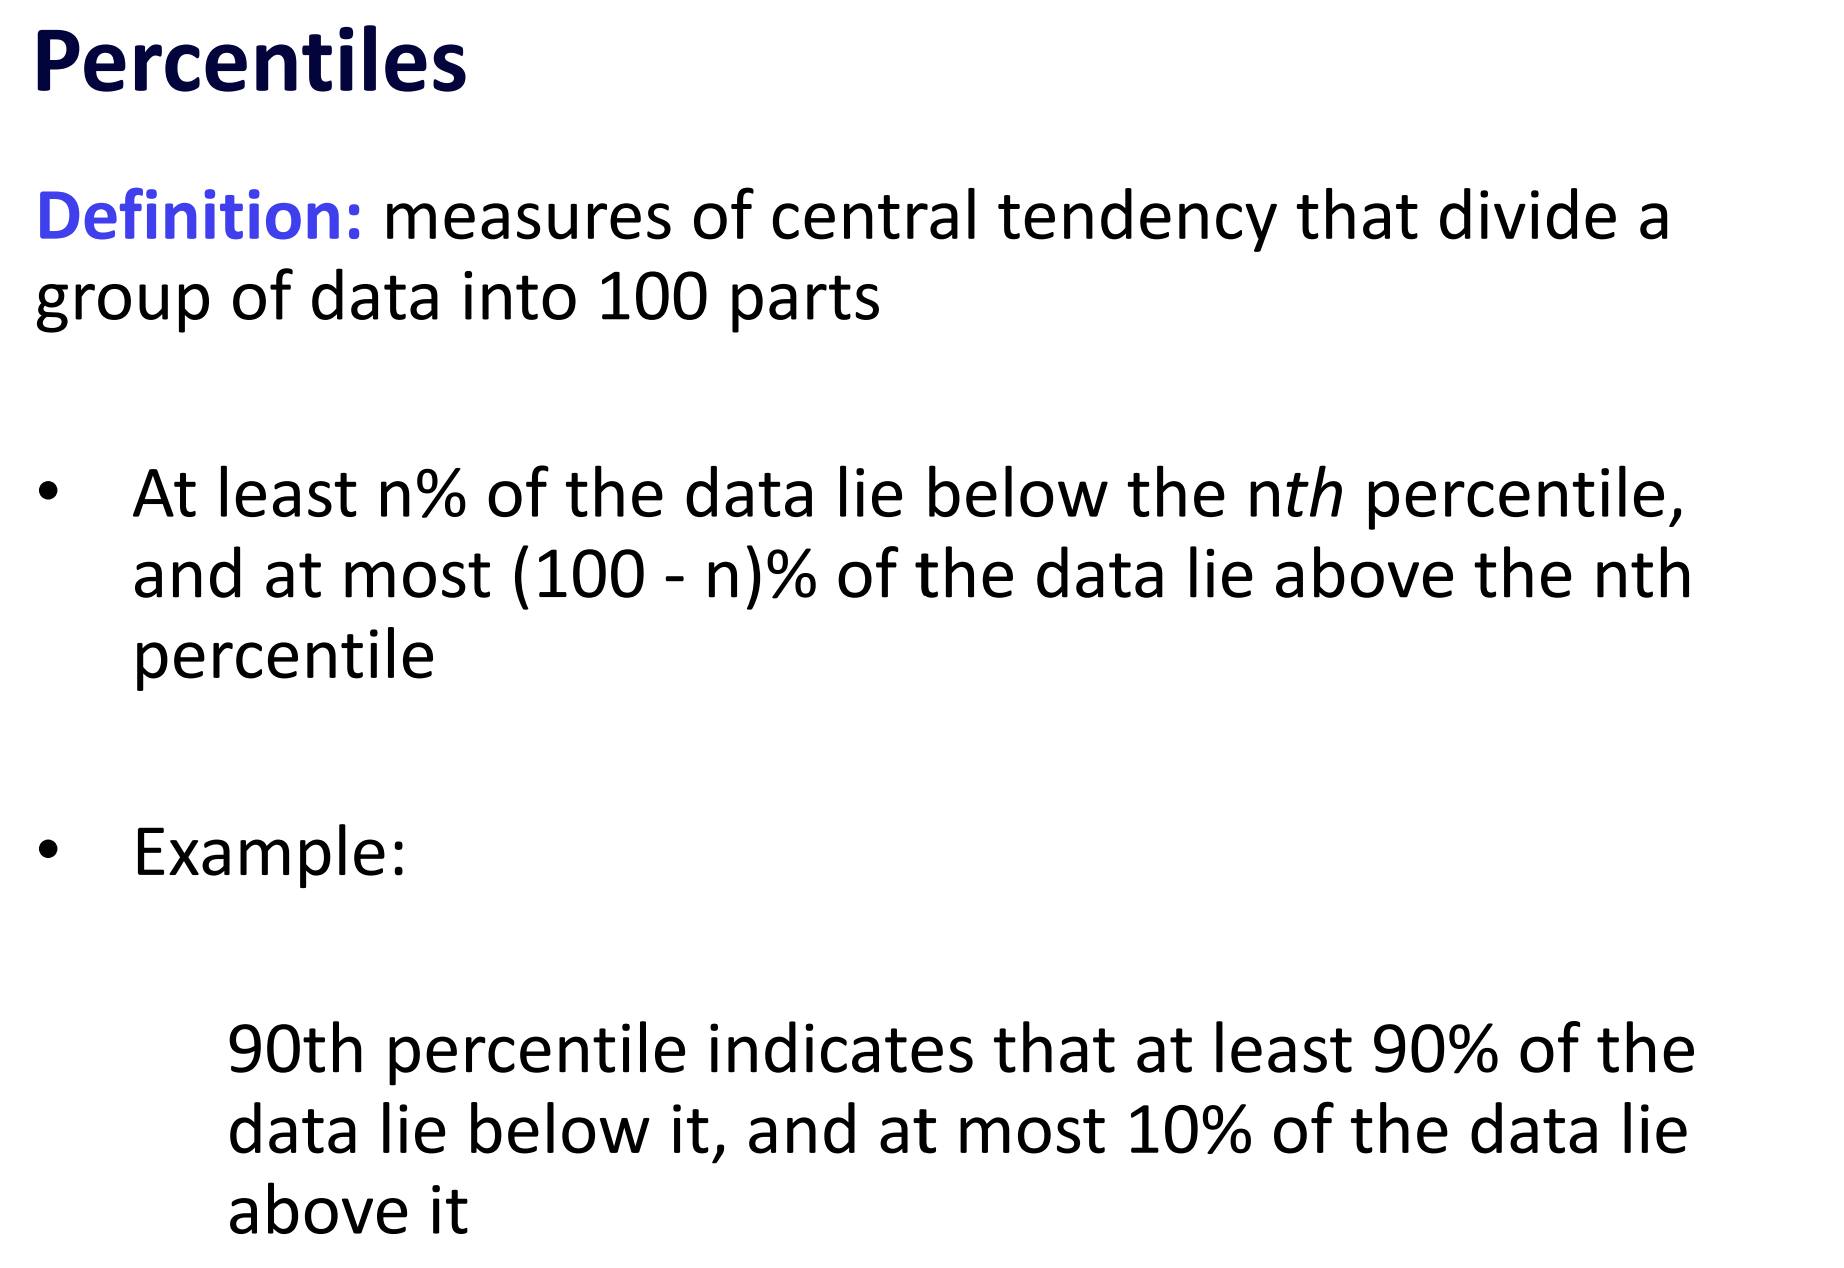
what are percentiles
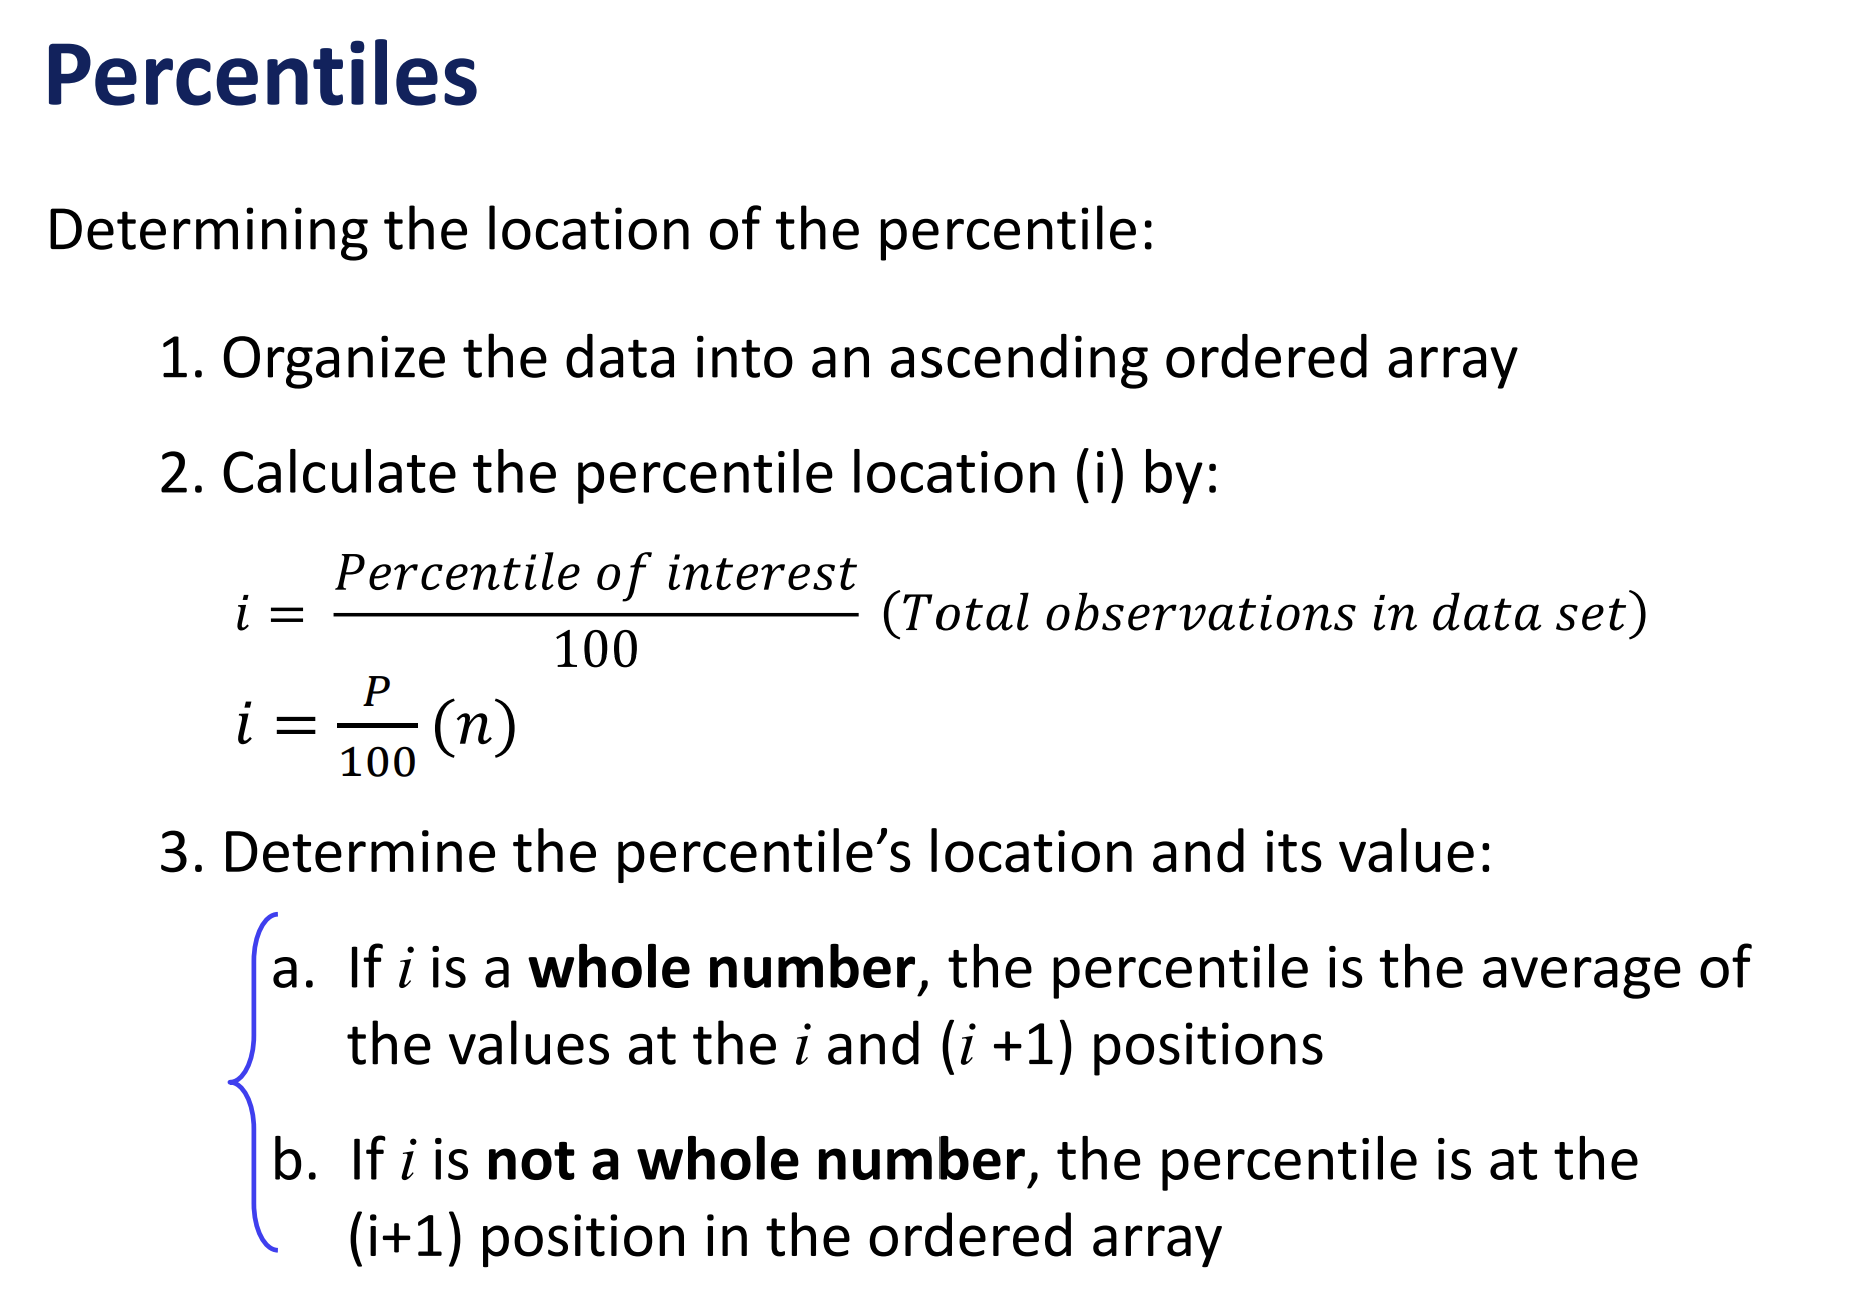
How to calculate percentile location and value
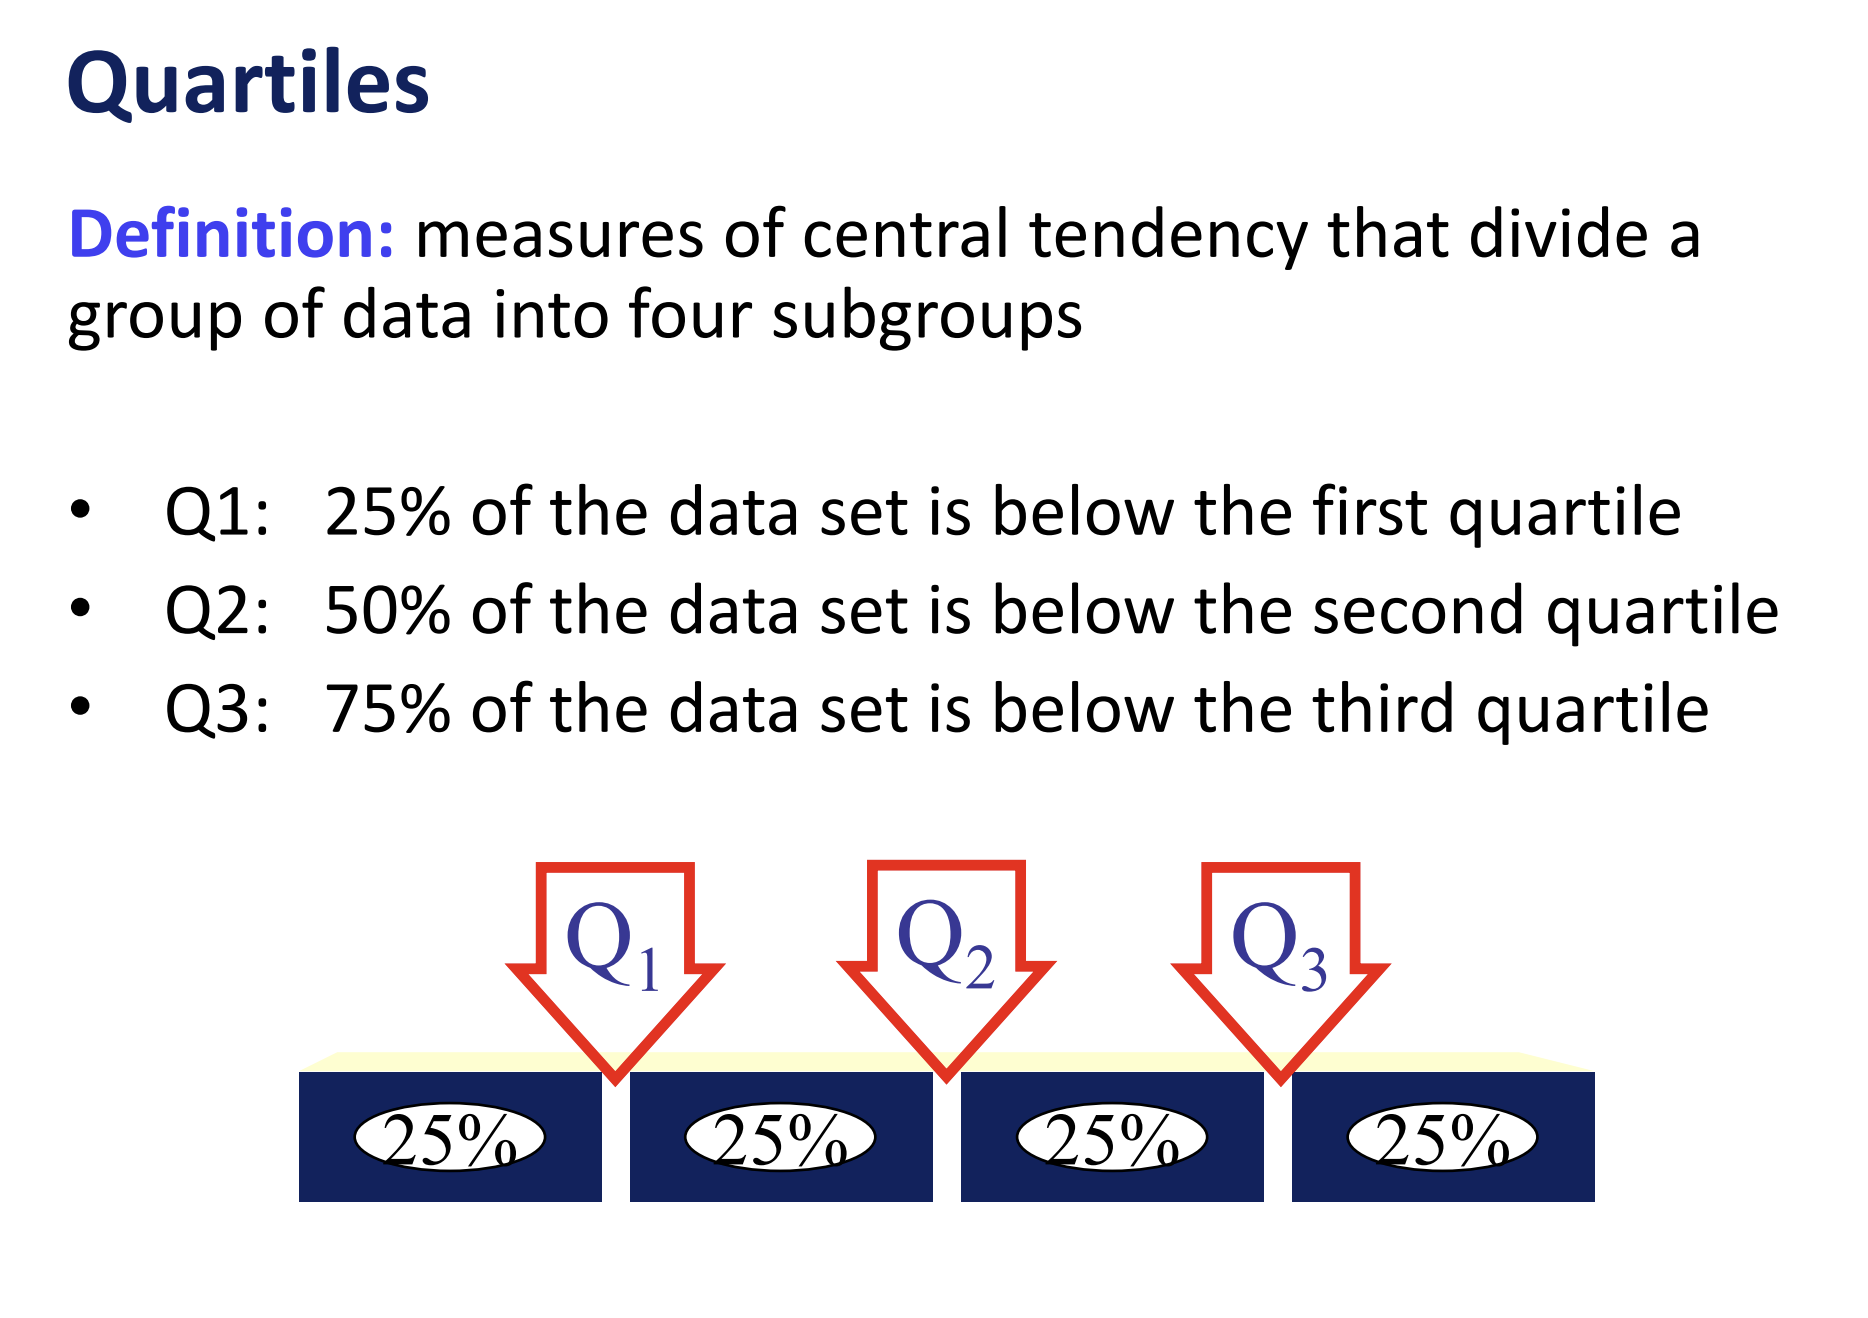
What are Quartiles
Quartiles Example

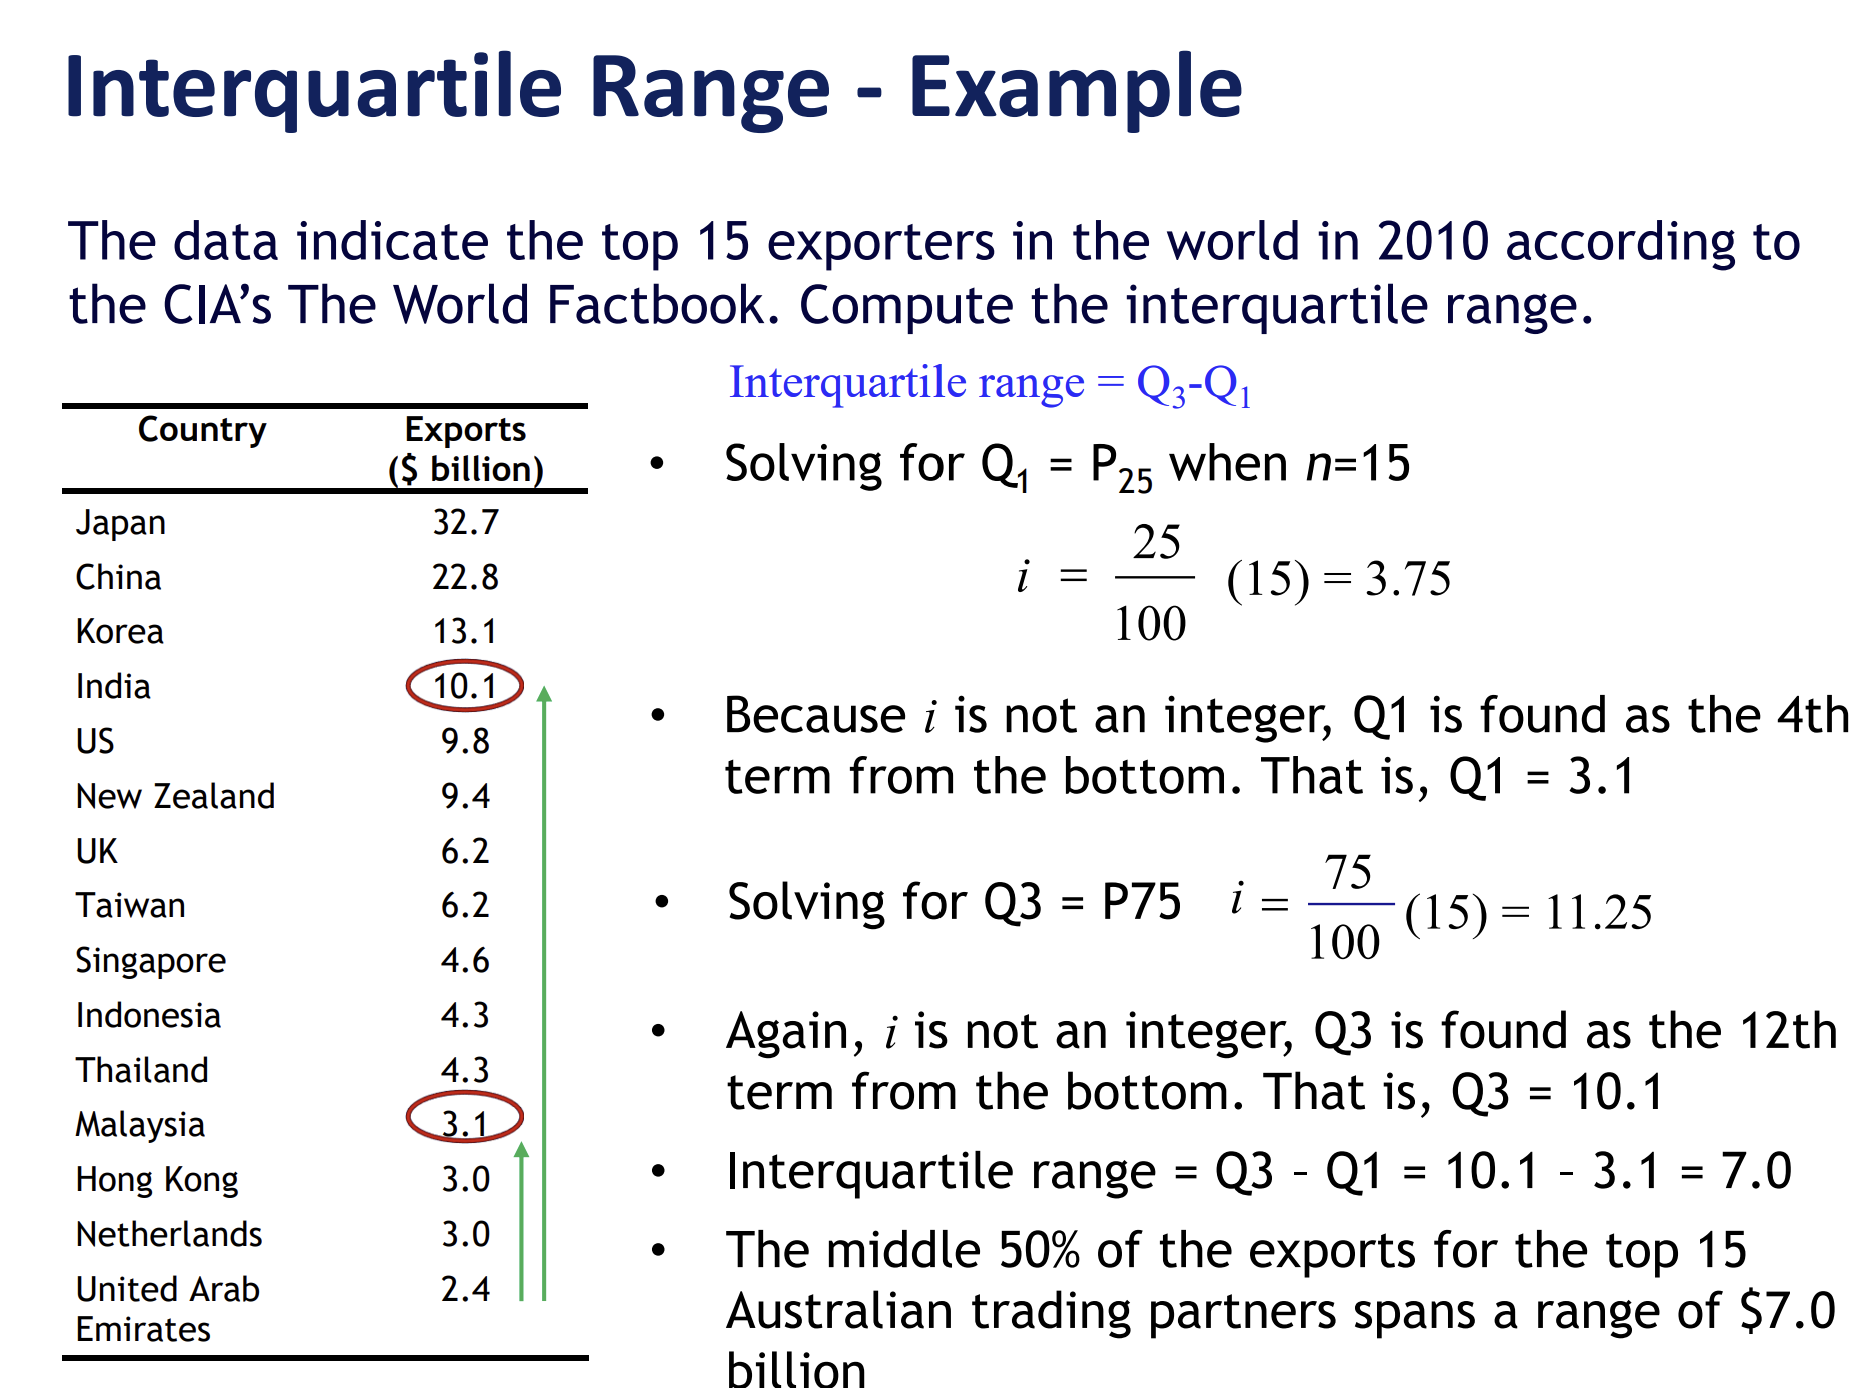
What is the interquartile range
The difference between Q3 and Q1
Interquartile range example
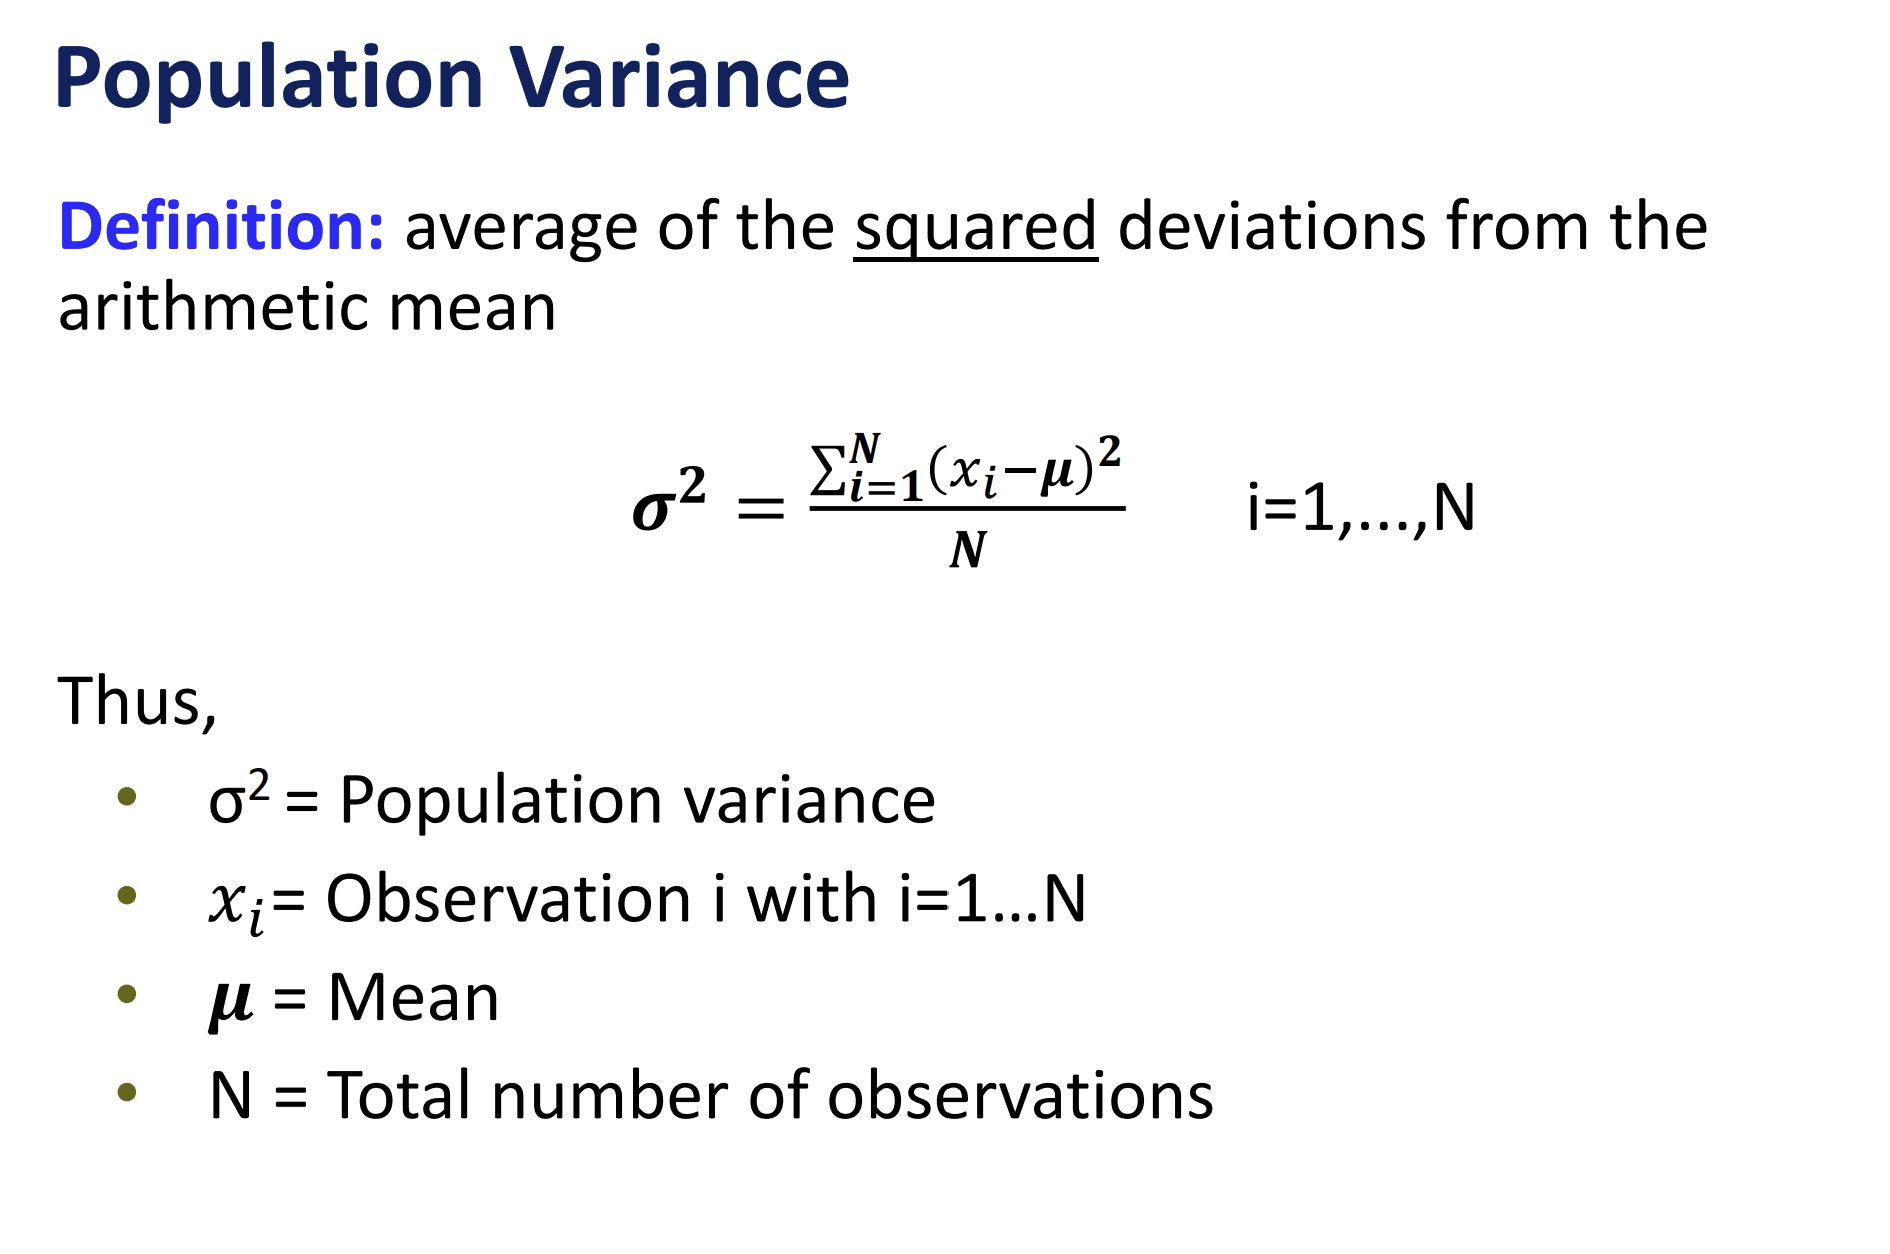
Population Variance
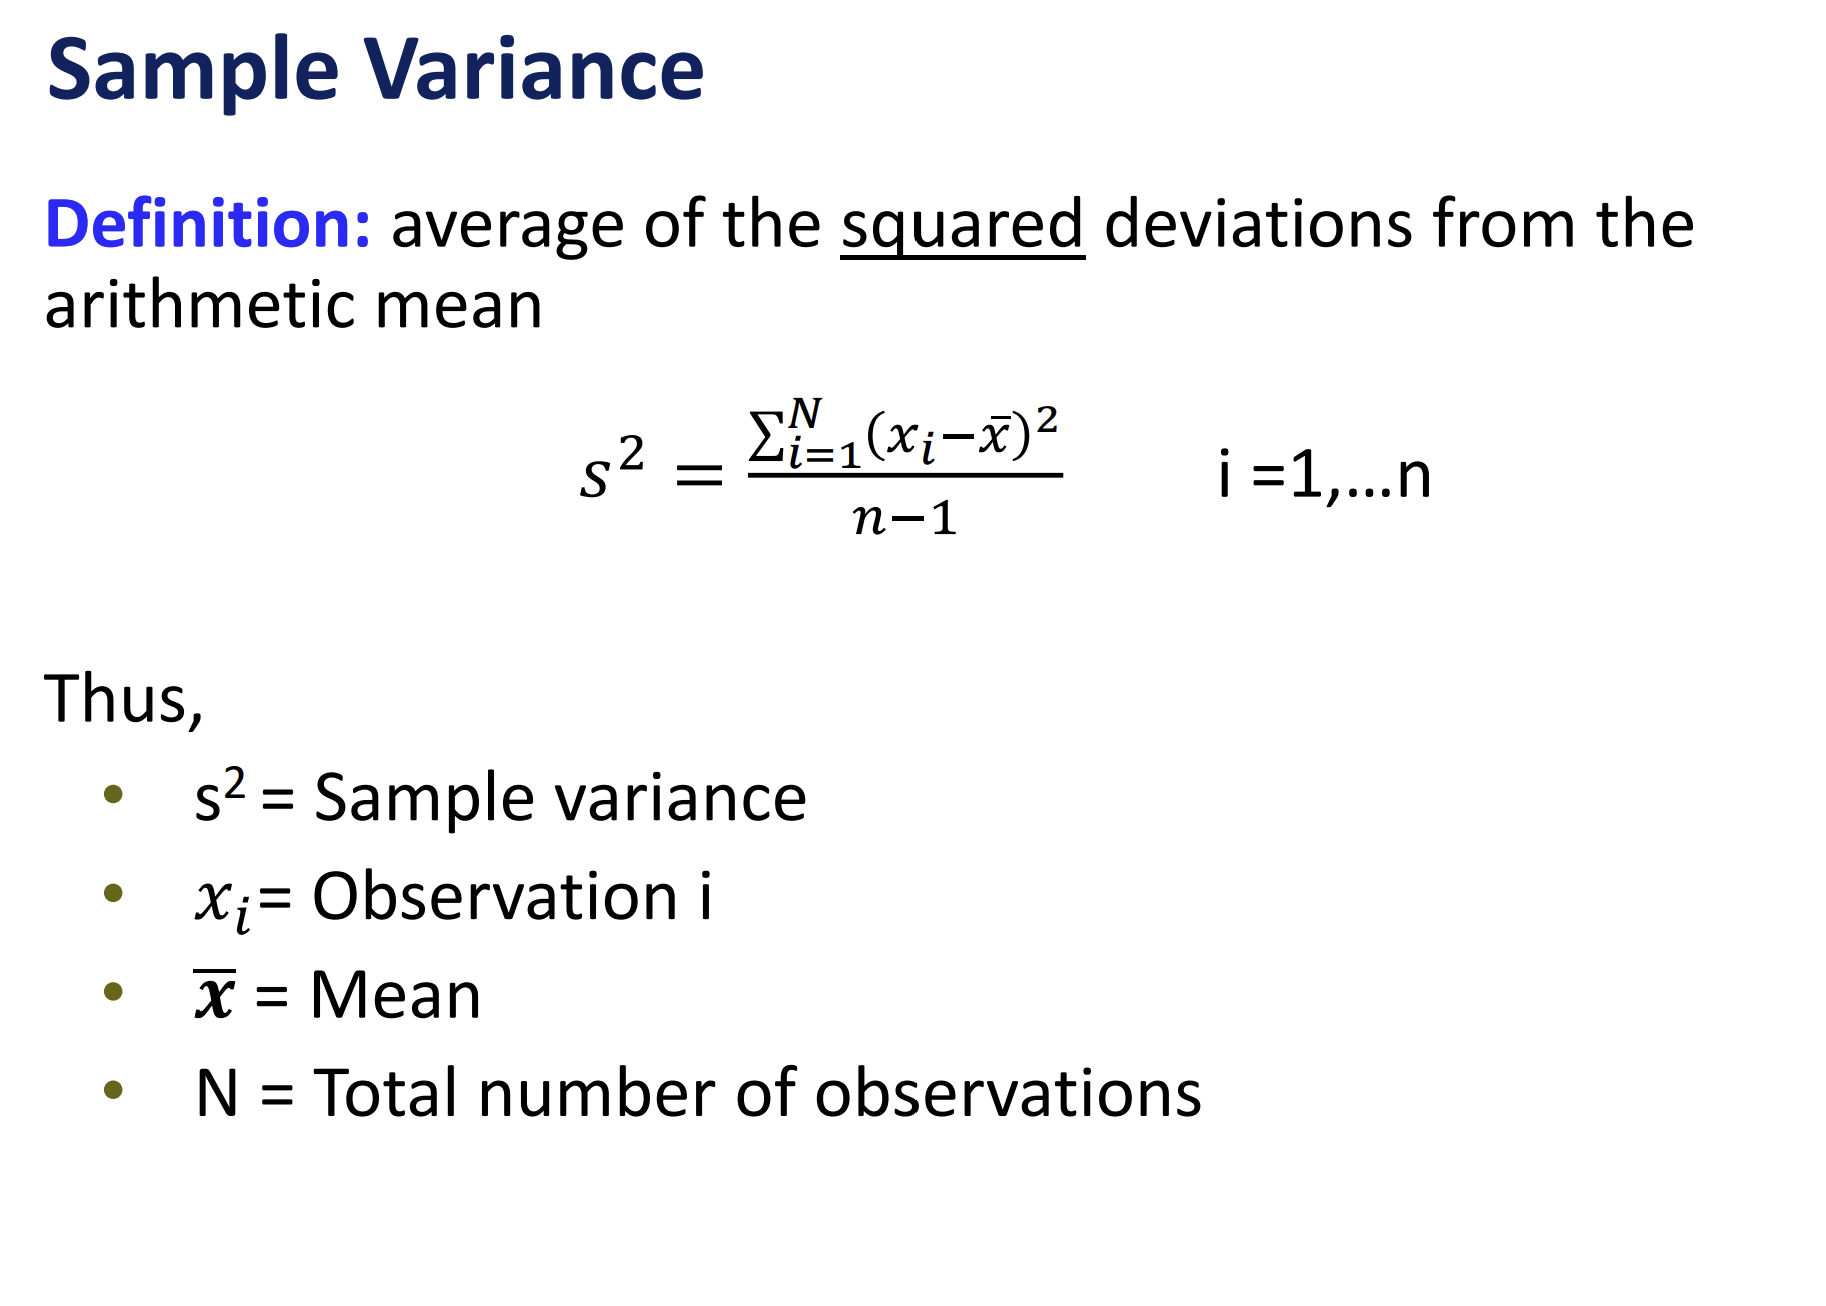
Sample Variance
Sample Standard Deviation
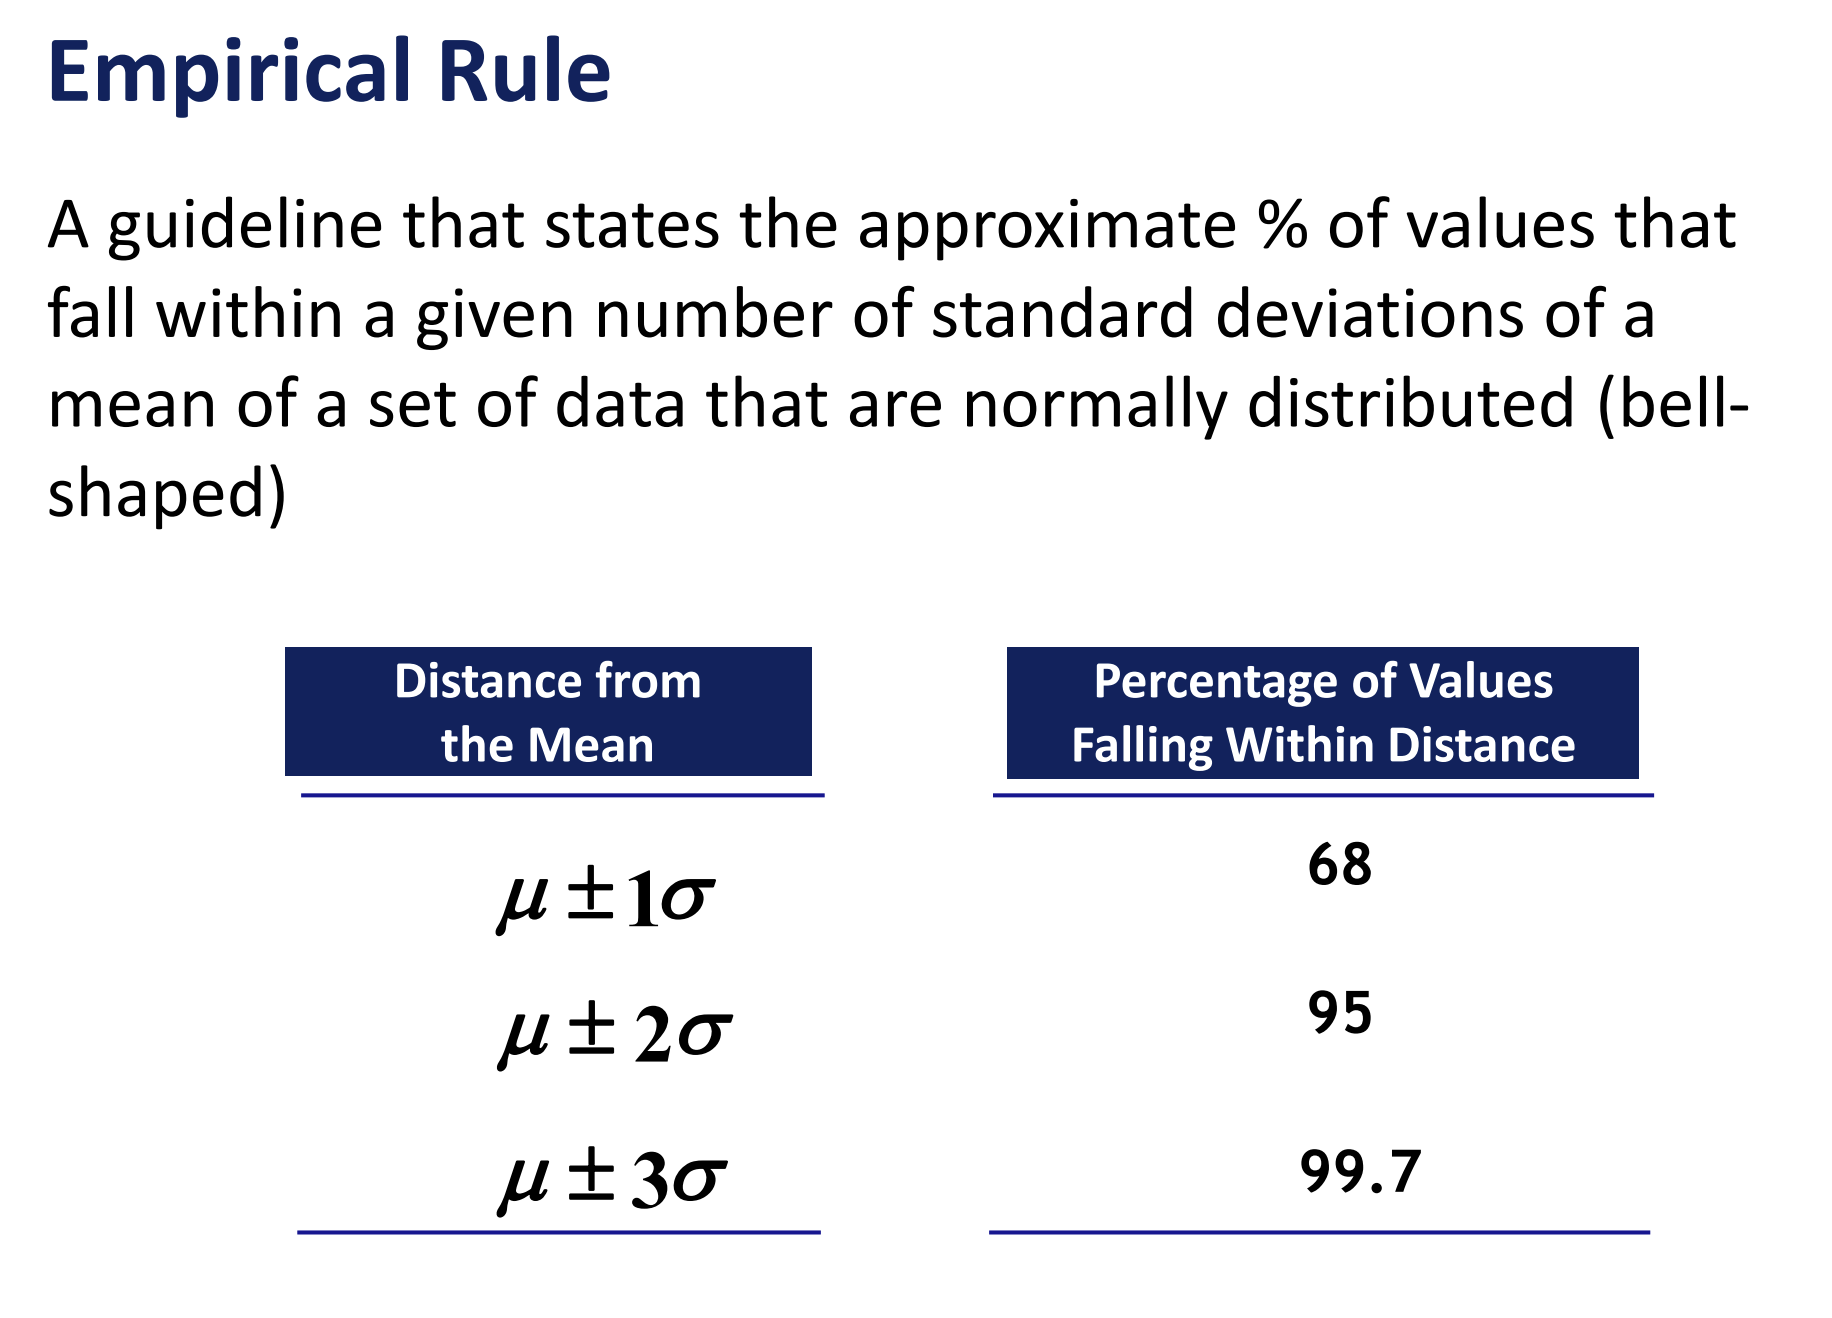
Empirical rule
Empirical Rule example

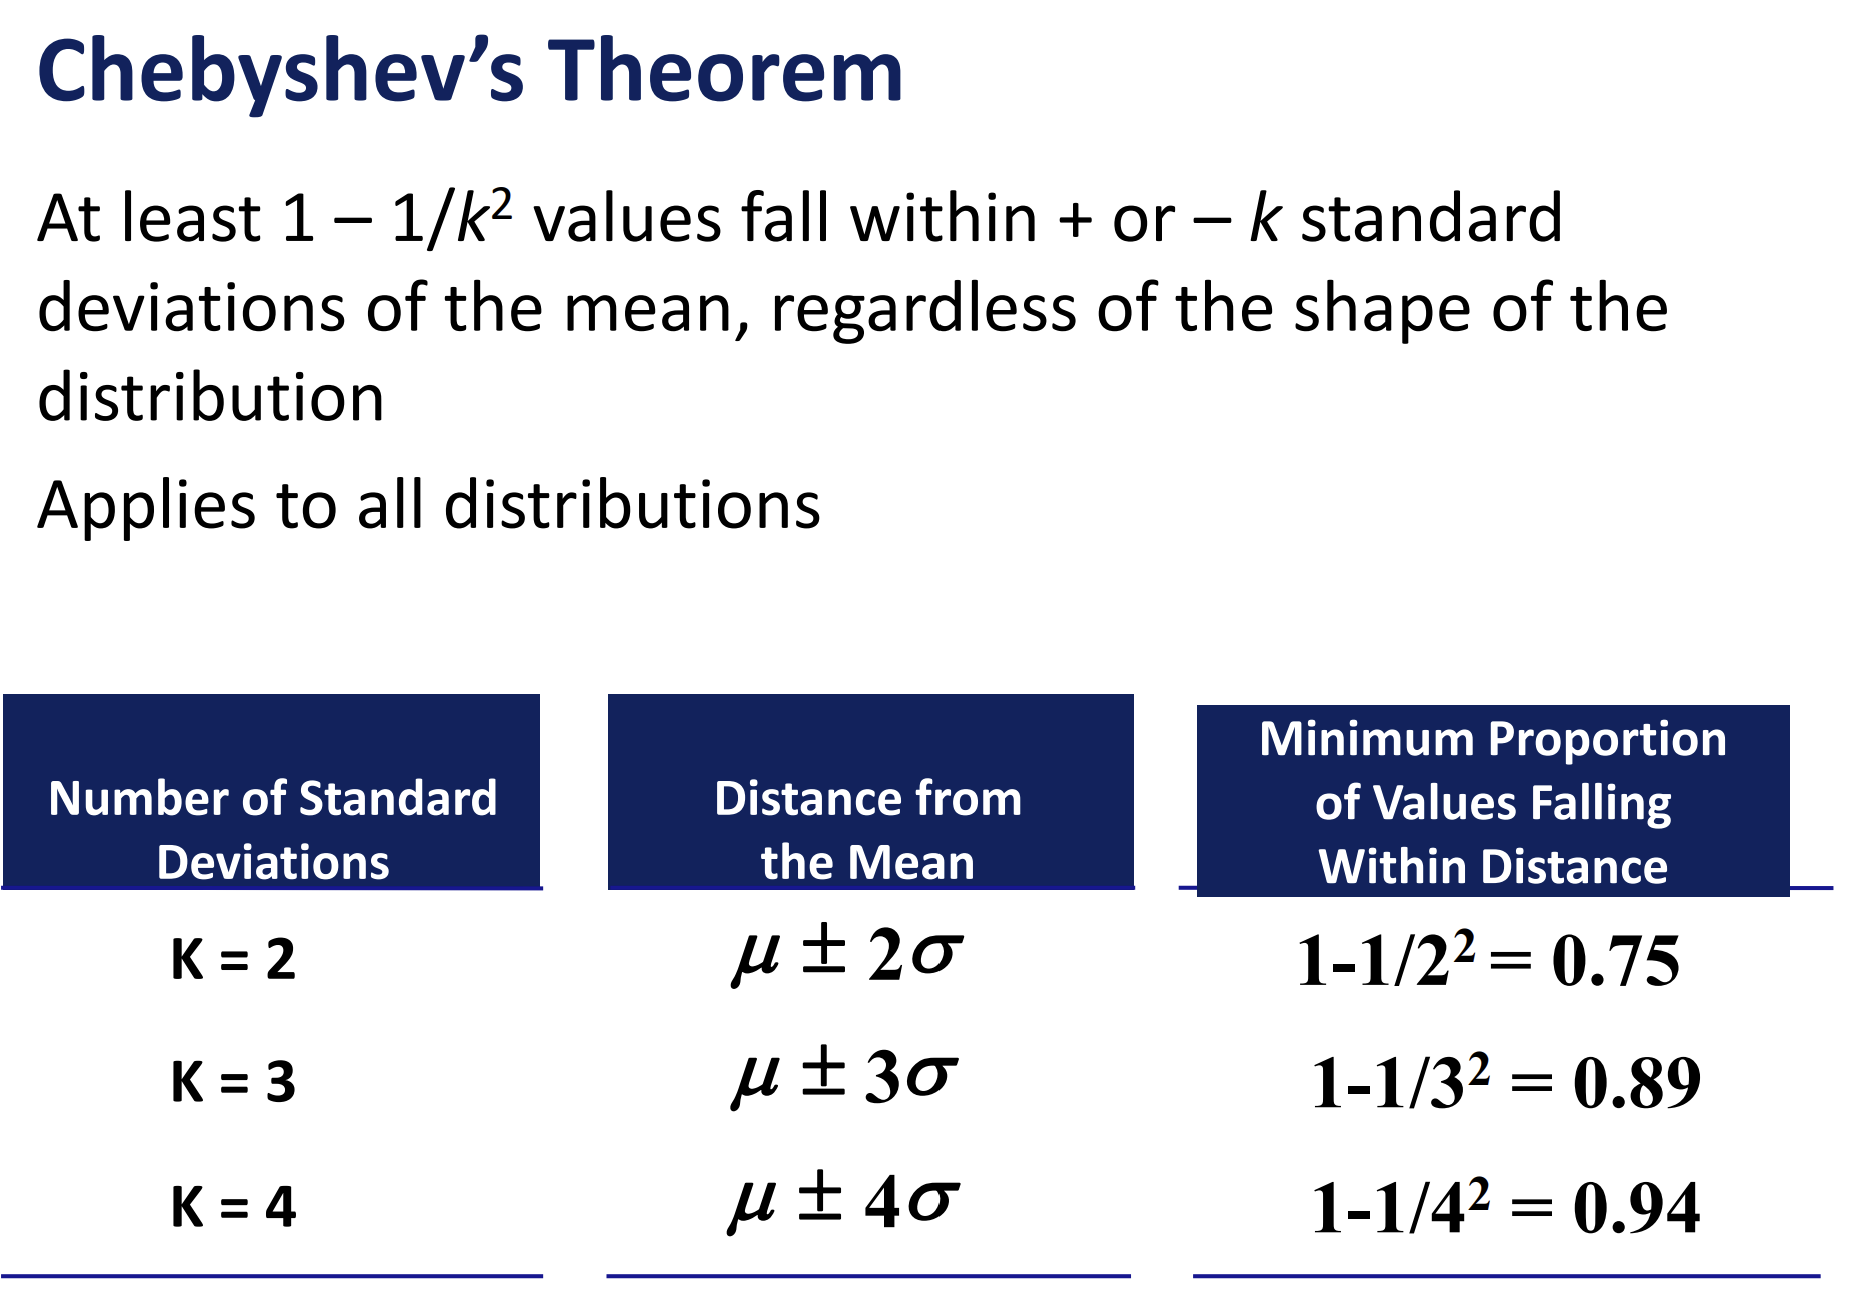
Chebyshev’s Theorem
When to use Empirical Vs. Chebyshev
Empirical Rule
Use when the data is approximately normal (bell-shaped).
It tells you that:
68% of data is within 1 SD
95% within 2 SD
99.7% within 3 SD
Chebyshev’s Theorem
Use when the data is not normal or when you don’t know the shape.
It gives a minimum percentage of data within a number of standard deviations (works for any distribution).
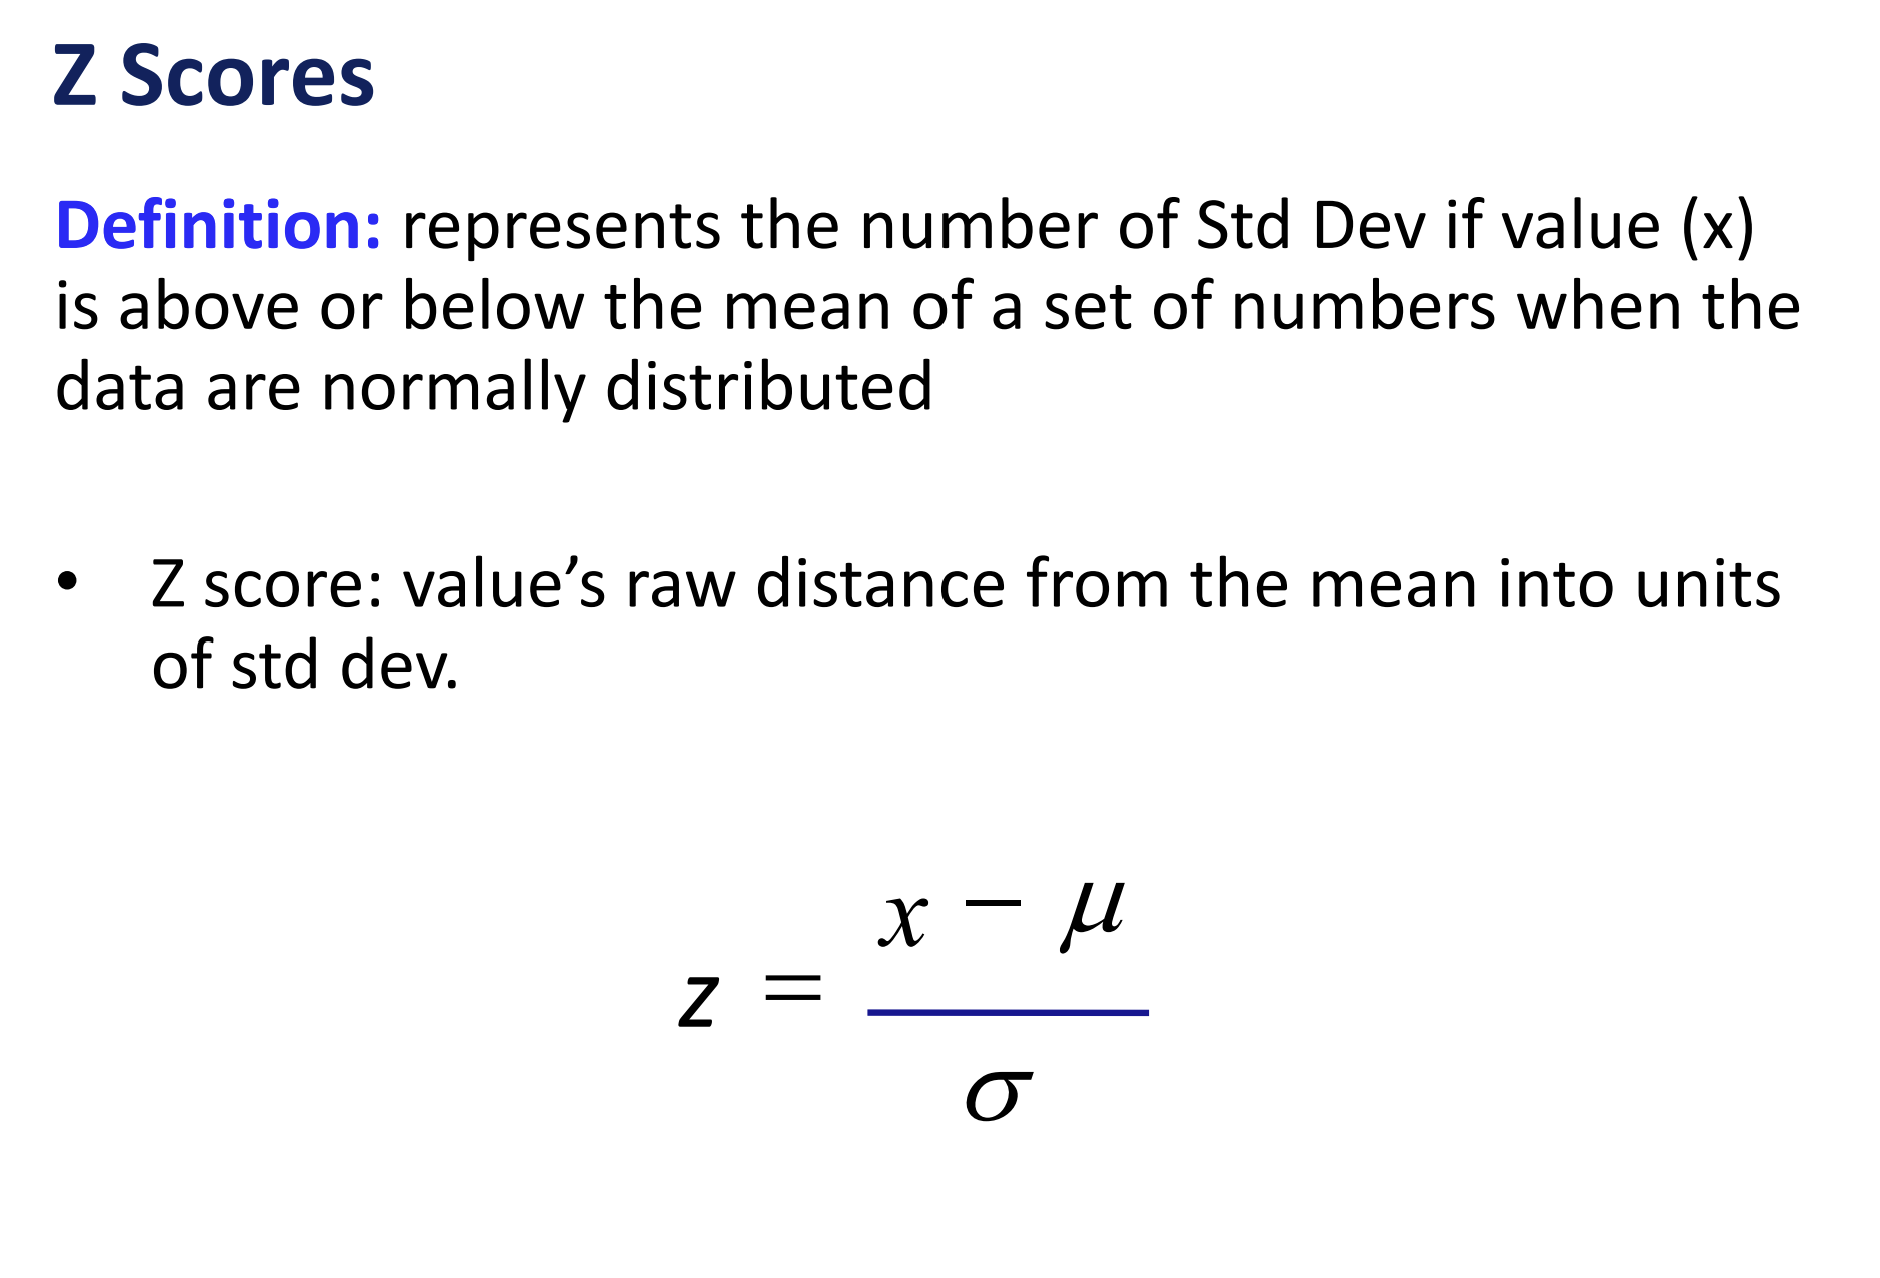
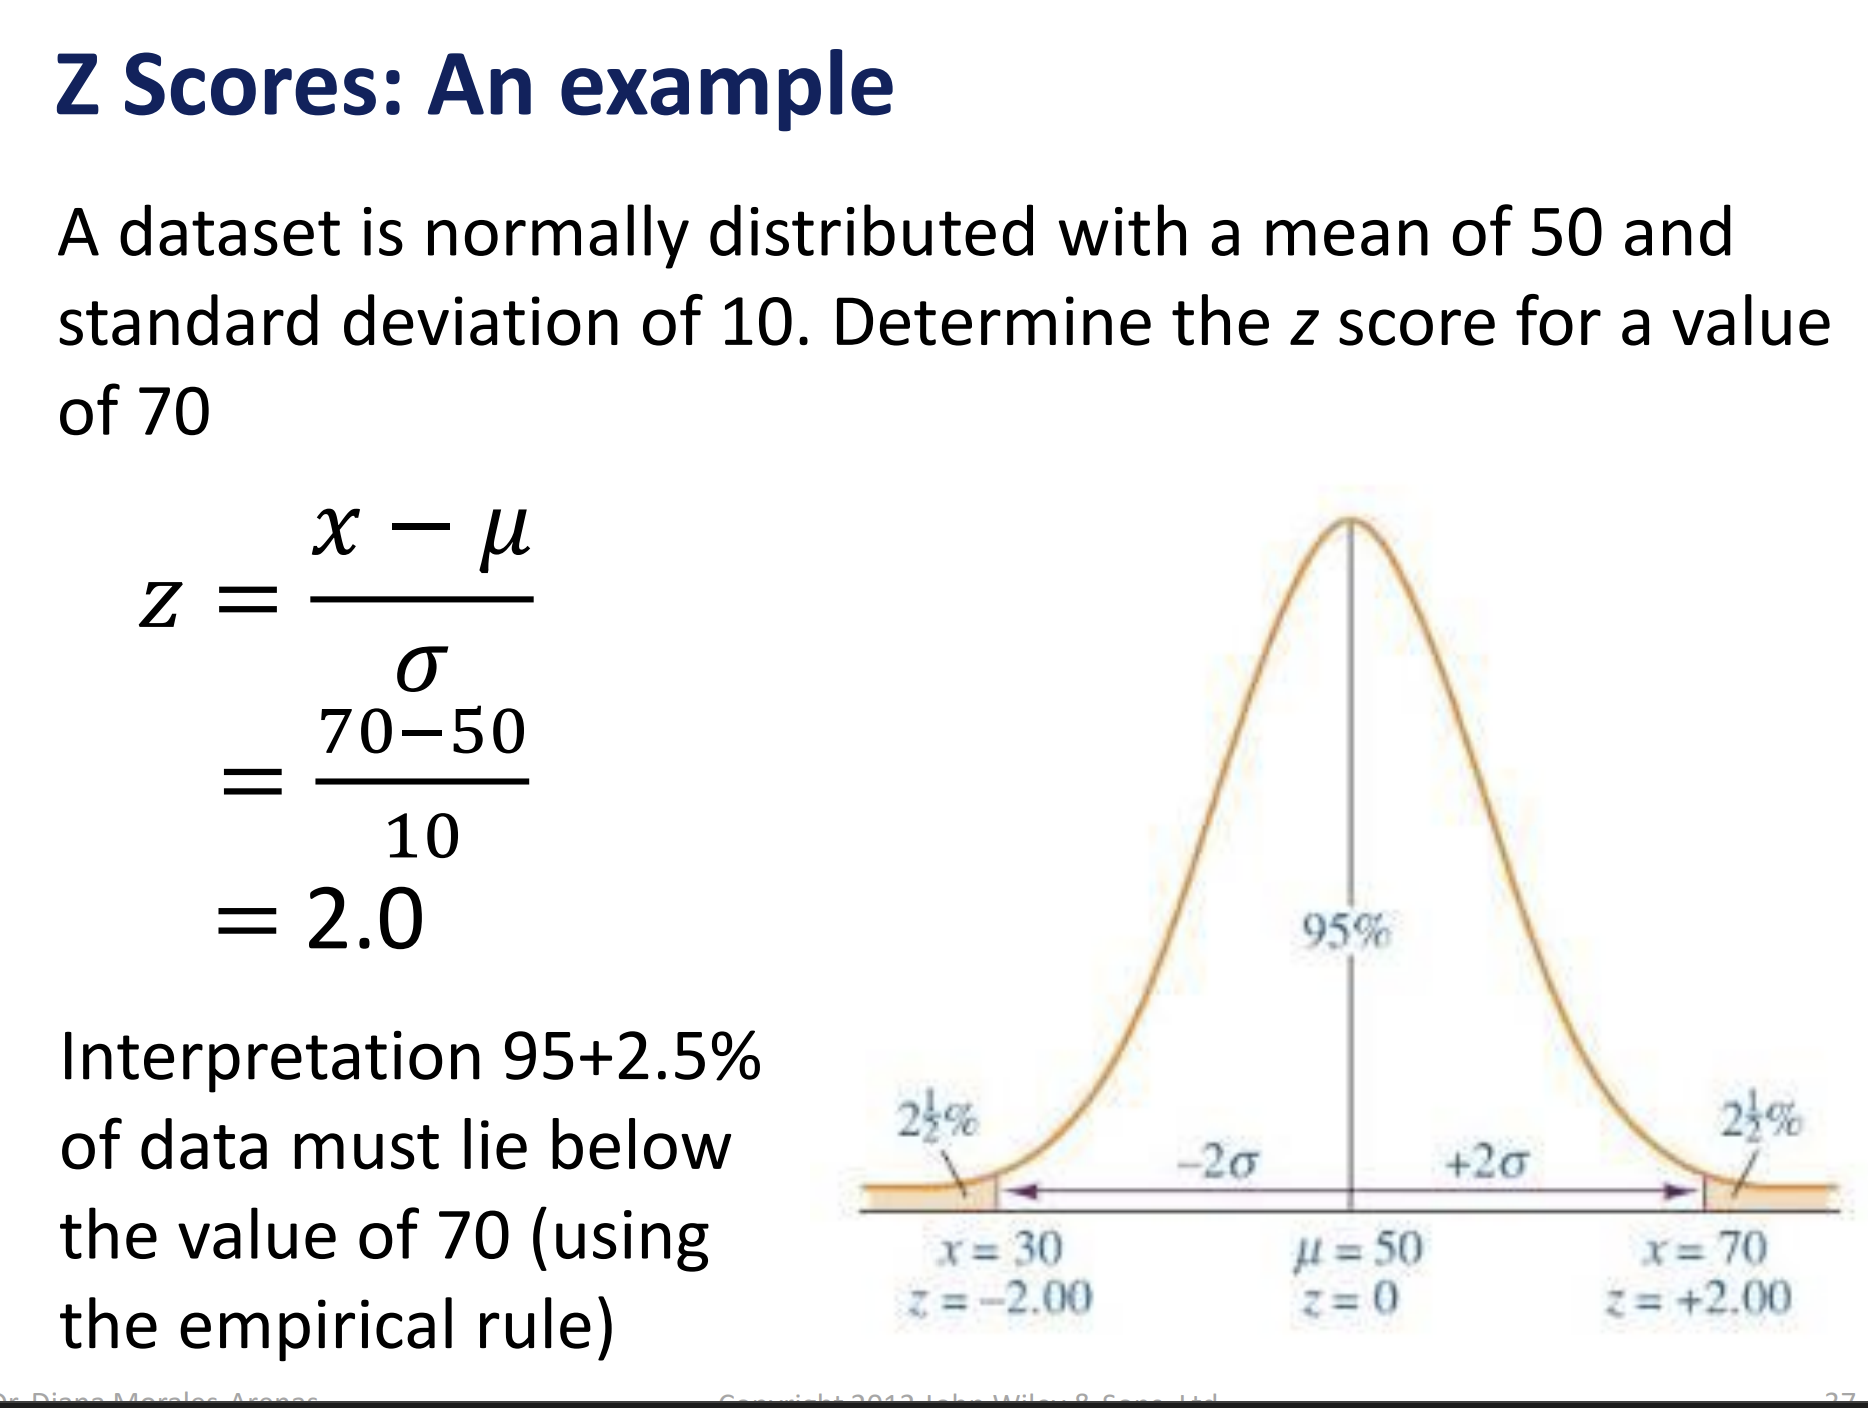
Z scores
Z score example
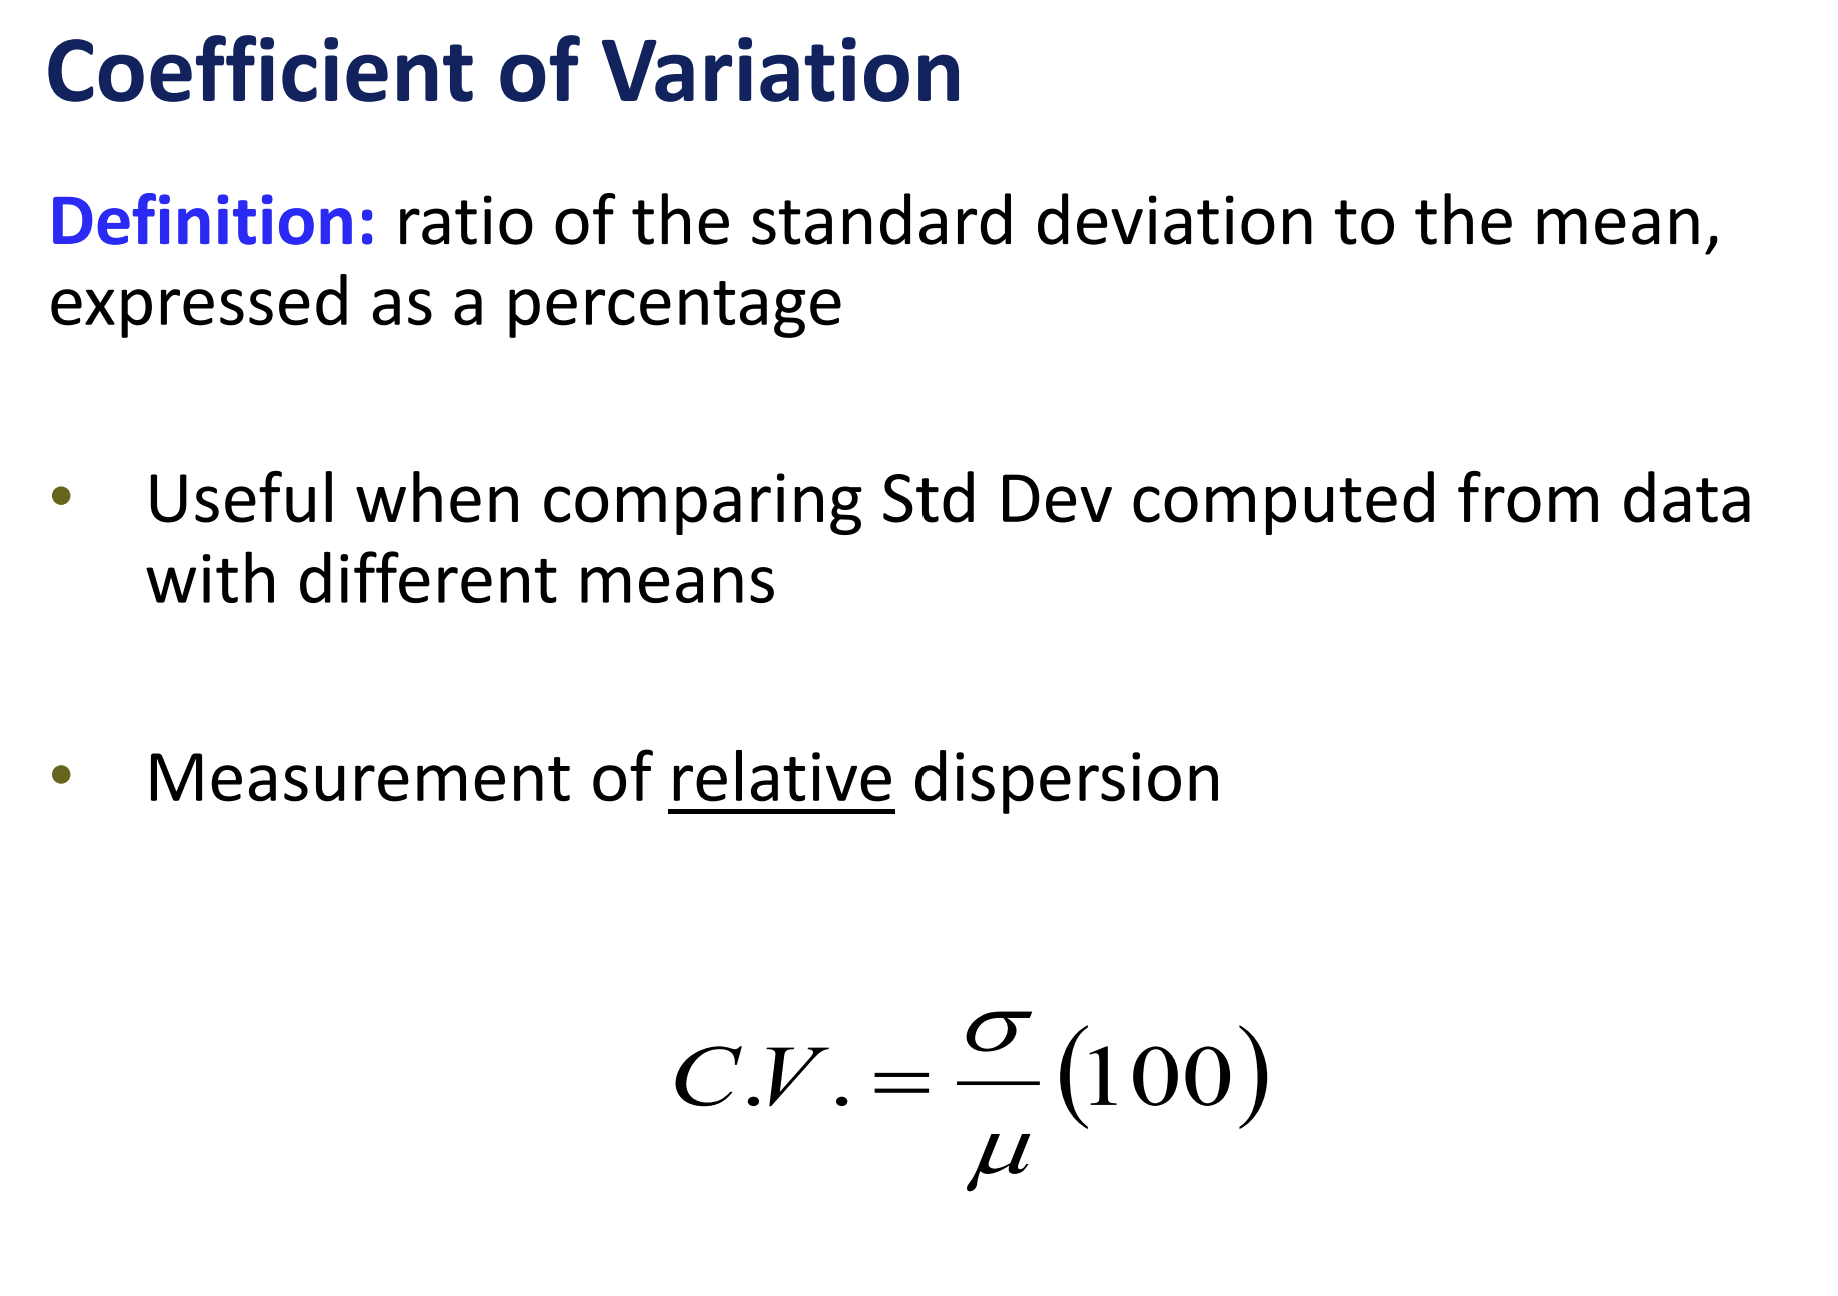
Coefficient of Variation
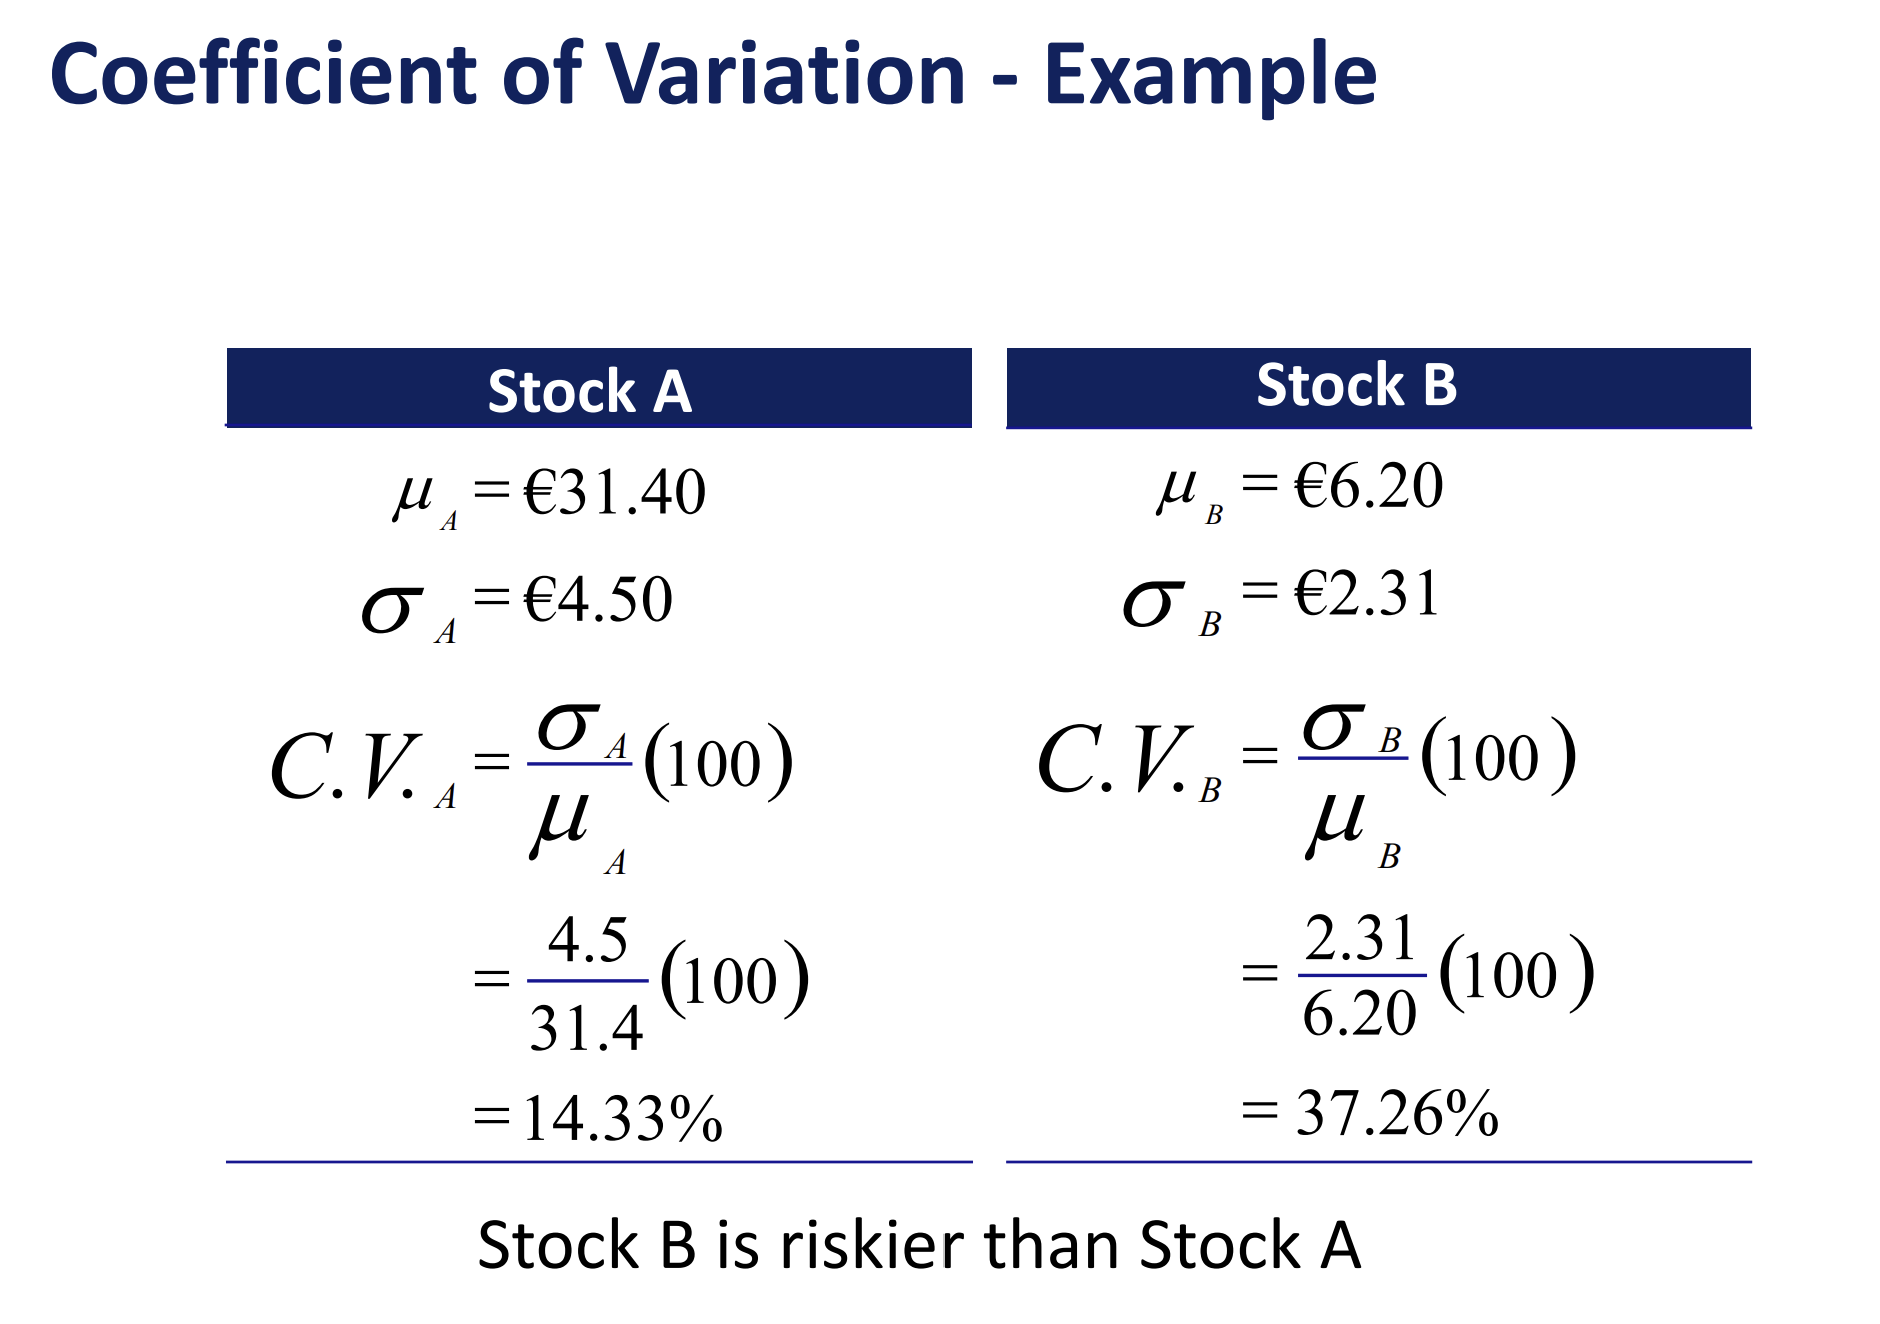
Coefficient of Variation Example
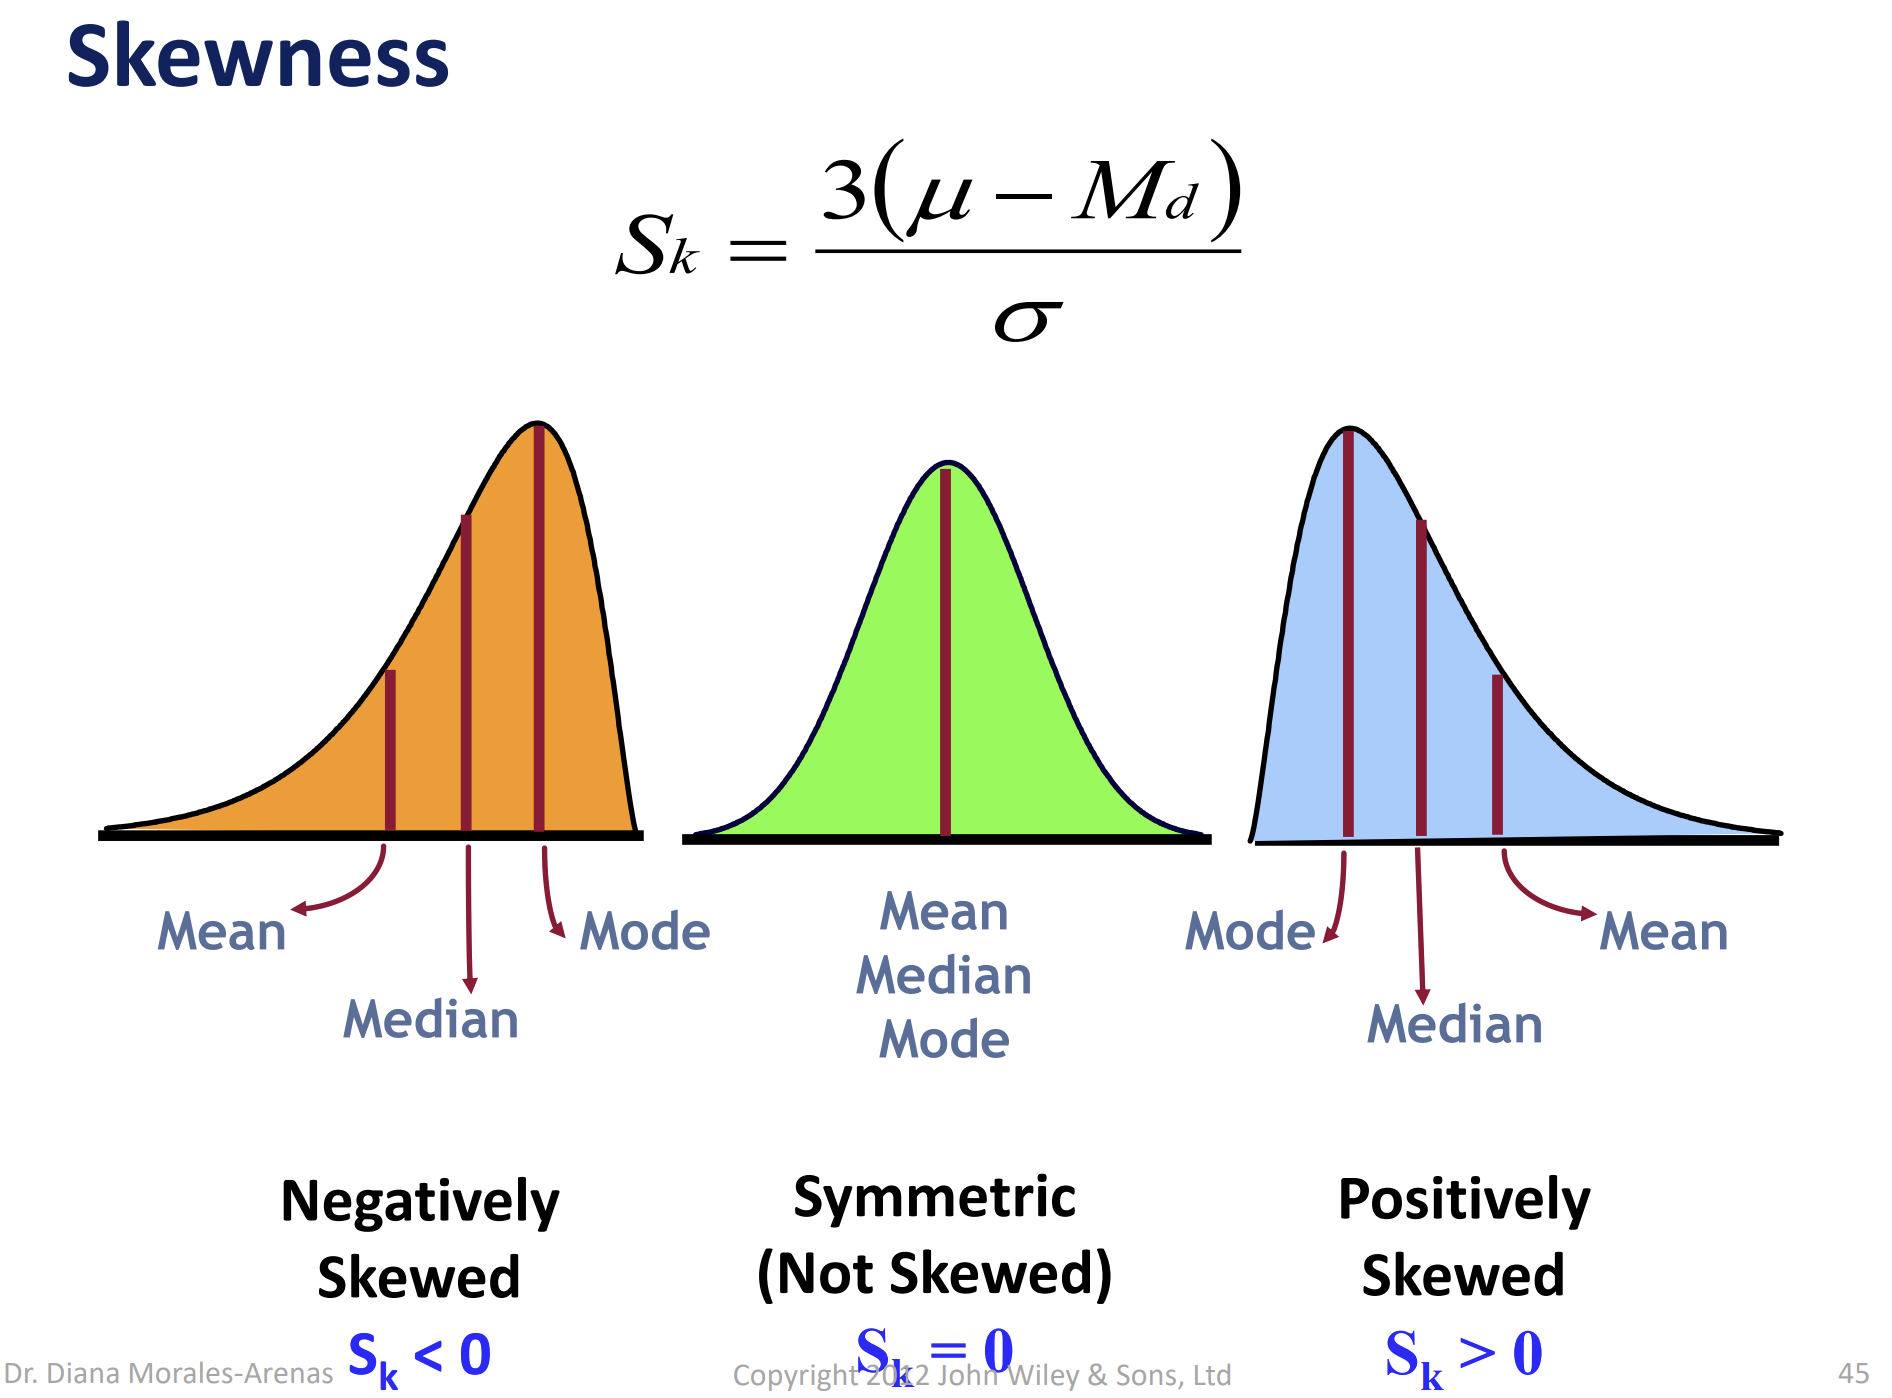
Skewness
Shows that the distribution lacks symmetry; used to denote the data is sparse at one end, and piled at the other end

Coefficient of Skewness
If Sk < 0, the distribution is negatively skewed (skewed to the left)
If Sk = 0, the distribution is symmetric (not skewed)
If Sk > 0, the distribution is positively skewed (skewed to the right)
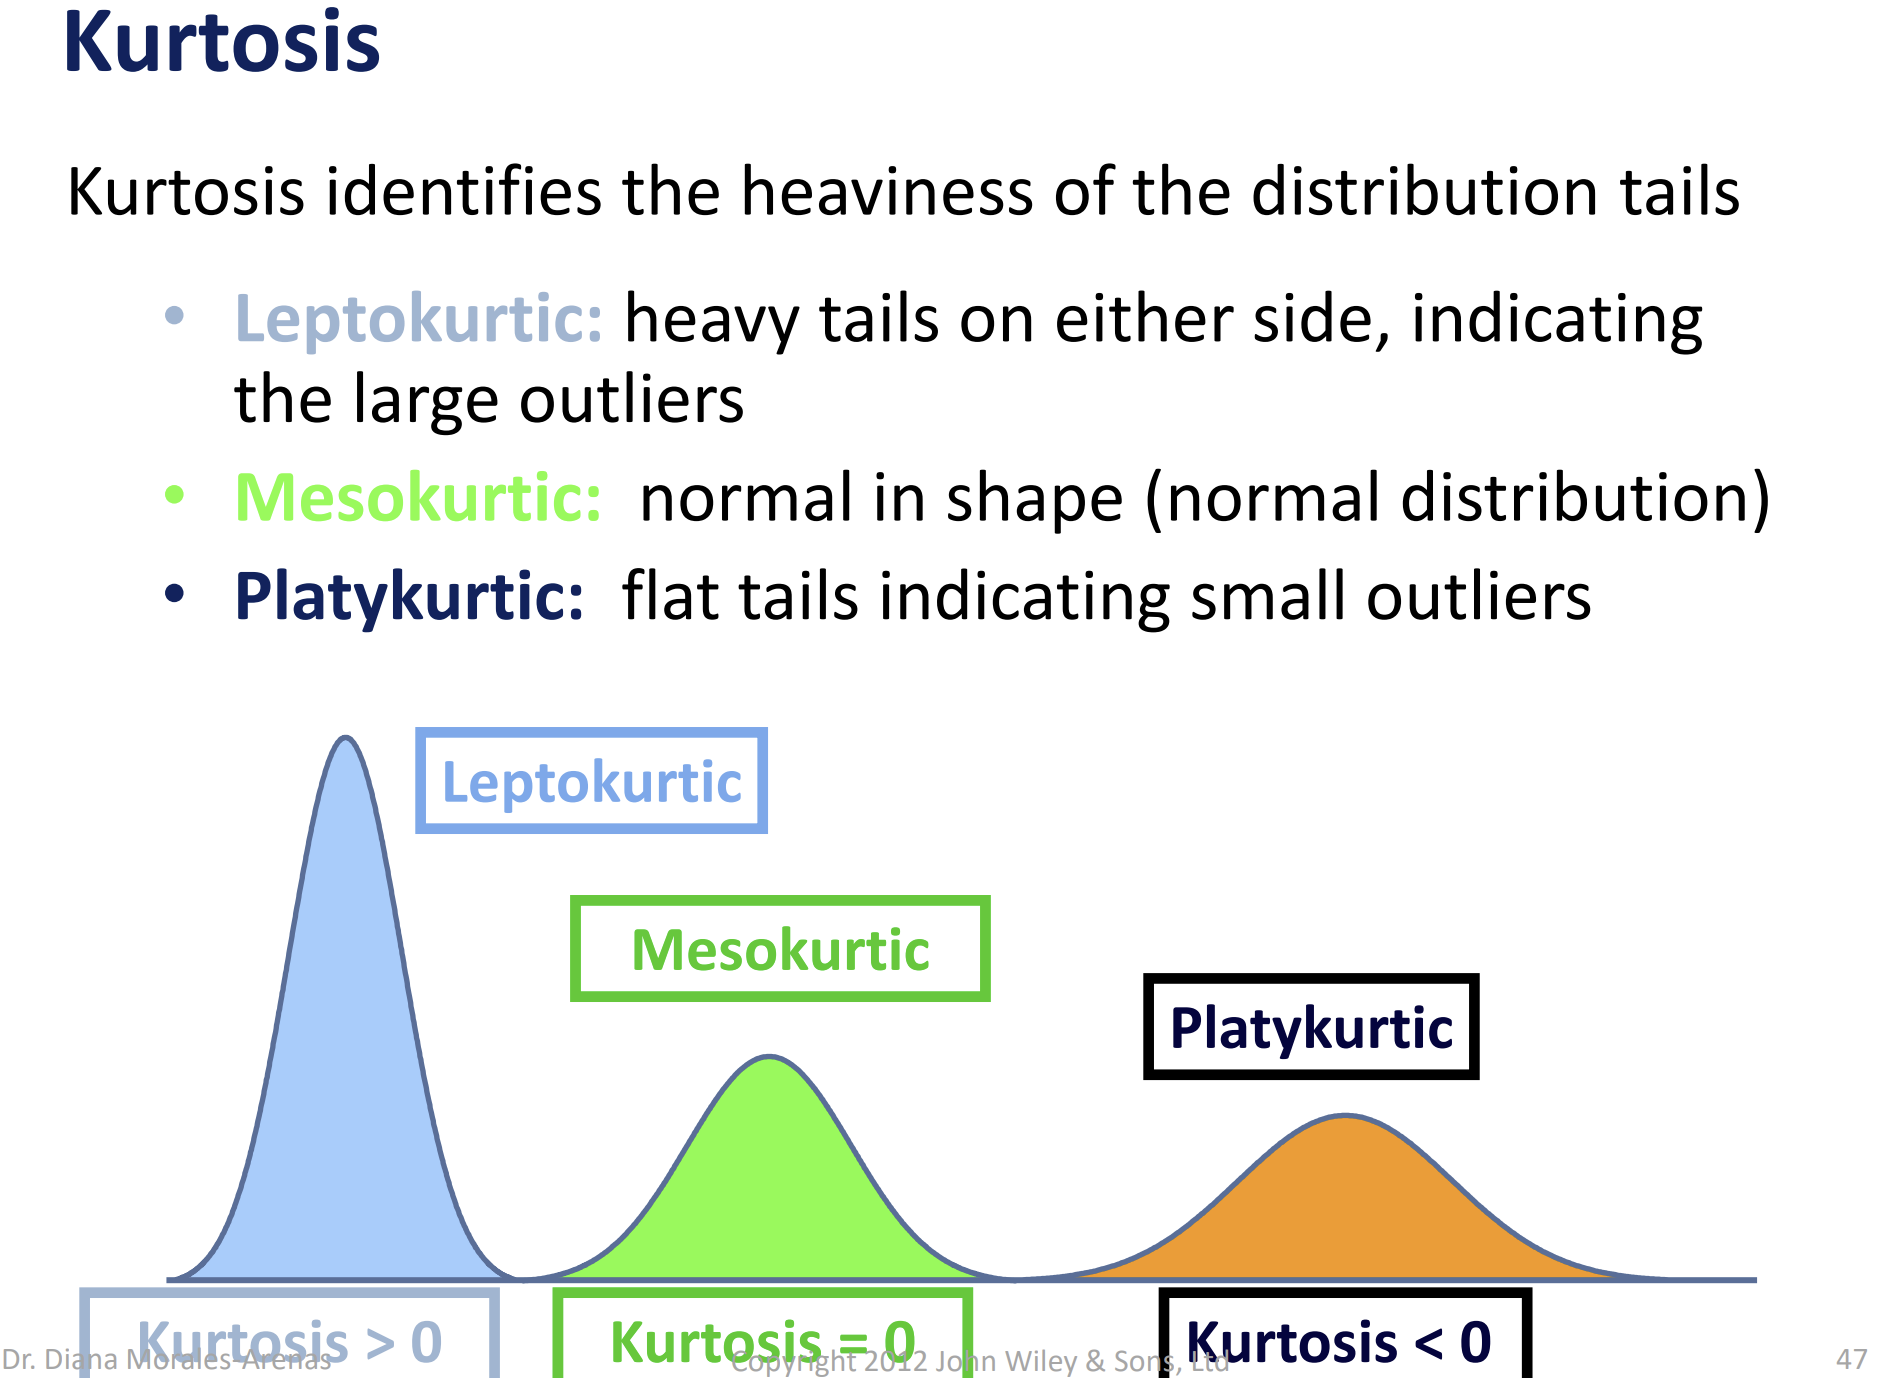
Kurtosis
Peakedness of a distribution.
Defines how heavily the tails of a distribution differ from the tails of a normal distribution. In other words, kurtosis identifies whether the tails of a given distribution contain extreme values. (heaviness of the distribution tails.)
Leptokurtic: high and thin
Mesokurtic: normal in shape (normal distribution)
Platykurtic: flat and spread out