Break-Even Analysis
1/24
Earn XP
Description and Tags
Business Management Chapter 32
Name | Mastery | Learn | Test | Matching | Spaced | Call with Kai | Chat |
|---|
No analytics yet
Send a link to your students to track their progress
25 Terms
Methods of Break-even Analysis
Table method
Graphical method
Calculation method
Table format
Quantity sold
Fixed costs
Variable costs
Total costs
Total revenue
Profit/Loss
Fixed Costs (FC)
Costs that do not vary with output or sales in the short term
Why are assets not part of fixed costs?
Fixed costs are constant whatever the amount of goods produced.
Also they are of recurring nature where business have to pay for these costs over the years.
Fixed costs and variable costs are also found in the statement of profit or loss.
Example includes rent, salaries, insurance and depreciation.
Technological investment and purchase of assets do not fulfil fixed costs because:
they are assets (and not expenses)
they are found in the statement of financial position (not profit or loss)
the "cost" is also once off and is not of recurring nature
they can also be "sold" so their value is not expensed away like all fixed costs
Their depreciation value are the true fixed costs.
Variable Costs (VC)
costs which vary with output (e.g. wages, materials per product)
VC = cost per unit x no. of products
Total Revenue (TR)
Total income from the sale of all units of a product during a given time period
TR = no. of products x price
Total Costs (TC)
TC = FC + VC
Profit
Profit = TR - TC
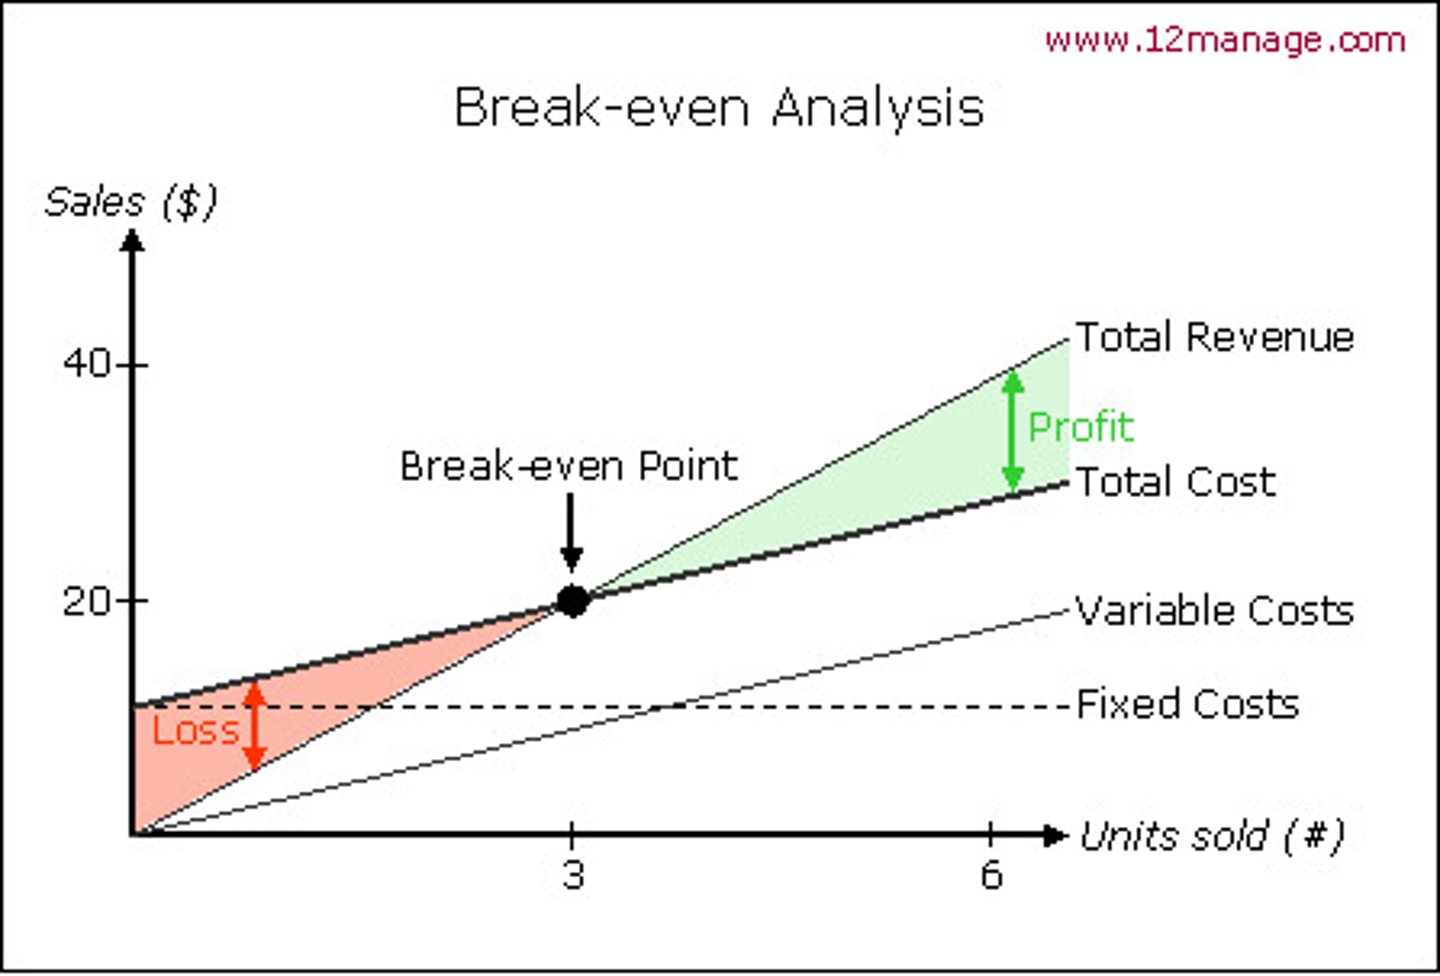
Break-even
Sales revenue of business covers all of its production costs
Profit = 0
Total revenue = Total cost
Break Even Quantity (BEQ)
Level of output where a business does not make either a profit or loss
BEQ = fixed costs / selling price - cost price (unique contribution)
Break-even point
Level of output at which total costs equals total revenue
remember to label with arrow!!! important to get marks
Margin of safety (MOS)
the amount by which the current output level exceeds the break-even level of output
MOS = total no. of products - BEQ
How to draw break even chart:
1) Title: Break even chart (underlined)
2) Axis: vertical - Sales/cost $ ('000), horizontal - Quantity '000
3) All lines
- FC: horizontal line
- VC: diagonal line from 0 to total VC
- TR: diagonal line from 0 to TR
- TC: diagonal line from FC to TC
4) BEP (MUST BE AT BEQ)
5) BEQ (dotted line)
6) Profit (bracket, TR - TC = P)
7) MOS (arrows, MOS = xx)
Total contribution
Unit contribution x Output
Contribution per unit
Contribution refers to the portion of unit sales revenue after per unit variable costs have been deducted. This portion is then available to be applied to fixed costs.
(Unique contribution)
selling price per unit - variable cost per unit
Target profit
value of profit that a firm aims to earn within a given time period
Target output
quantity of sales required for a firm to reach its target profit
Target profit output formula
Target output = (fixed costs + target profit) / contribution per unit
Revenue to achieve target profit formula
Target revenue = fixed costs + target profit / 1 - (variable cost per unit/price)
Target price
Amount customers need to pay per unit in order for the firm to break-even or reach a particular target profit
Break-even Target Price Formula
Break-even target price = (fixed costs/production level) + variable cost per unit
OR: (total cost + target profit)/quantity
Limitations of break even analysis
fully quantitative, ignores qualitative considerations, such as impact on employees who may need to work overtime in order to achieve break-even
doesn't take into account changes in external business environment which have direct impact on costs and revenues (e.g. inflation will increase production costs and wages)
prices are assumed to be constant but in real life they may not be constant (may change due to promotions and price discounts for loyal customers) costs are assumed to be constant but in real life they may not be constant (benefit from economies of scale as output increases → cheaper)
ideal for businesses that sell a single good or service (difficult for large range of goods as prices and production costs may differ)
relies on accuracy of cost and revenue data used to make predictions (inaccuracies and bias will invalidate results, difficult to allocate fixed costs accurately to various products in reality)
Graph issues:
TR may decrease
FC may not be entirely flat, incur additional costs
VC may fluctuate (economies of scale, diseconomies of scale)
there could be two BEQs (as TR decreases)
Qn: Explain how the introduction of new production methods will affect the total cost line in SSH's break-even chart.
The TC line will shift downwards (by $5000) [1].
The slope or gradient of the TC line will become flatter (less steep) [1].
Notes:
money and percentage should be in 2dp
dont assume the structure is fixed
read question carefully.
know the correct units. the units matter
Also please read the question very very carefully. For BE questions its very important that you know what figures are to be included and what not. In this case some students included the Fixed Asset costs and other made mistakes with the calculation of the Fixed Costs. Fixed Assets and Fixed Costs may sound the same but they are very different and needs to be treated very differently for your BEQ calculations. BEWARE!
Comment whether HH should outsource the production of meals to Meals Inc.
Based on the calculations above it may or may not be a good idea for HH to outsource to Meals Inc. Some of the reasons the students could comment on includes:
-The new BEQ at 14,400 does give the company a slightly larger margin of safety of 3600 (18,000-14400). And this might be a positive point. They would also own a higher profit of 14,400 (3600x4) an increase from 9000 before.
- There are however concerns about the quality of the meals being produced by Meal Inc and the increase in profits and MOS may not be considerable enough for HH to consider the decision to outsource. It should be also noted that outsourcing is not meant for the core activities of the business which in the case of HH would be the production of the meals.
Students can take either stand as long as they give an answer linking to HH and a discussion on outsourcing. They are highly encouraged to include the financial calculations in their answer.
[2 marks] for a comprehensive answer using the calculations similar to above
[1 mark] for an answer that is theoretical but shows some understanding of outsourcing.
Once again there were many who decided not to use the calculations from the previous section and that would have cost you marks. Also please be mindful that the question says ‘oursource’ so there must be something to do with that in your answer. Comment questions should not be treated like your definitions and be very brief.