population density
 Call Kai
 Learn
Learn Practice Test
 Spaced Repetition
 Match
Match Flashcards
 Knowt Play
1/31

There's no tags or description
Looks like no tags are added yet.
Name | Mastery | Learn | Test | Matching | Spaced | Call with Kai | Chat |
|---|
No analytics yet
Send a link to your students to track their progress
32 Terms
what is population density ?
individuals per unit area/volume
what factors effects population size ?
Natality (birth rate)
Mortality (death rate)
Immigration – individuals entering a population
Emigration – individuals leaving a population
Population increases when:
Births + Immigration > Deaths + Emigration
Population decreases when:
Deaths + Emigration > Births + Immigration
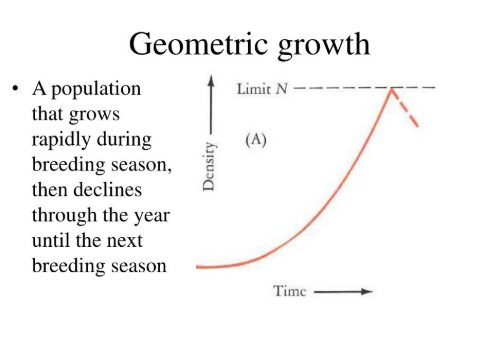
what is the geometric growth model
Geometric Growth
Also called exponential growth.
Characteristics:
Unlimited resources
Rapid growth
J-shaped curve
Keywords:
Exponential growth
Geometric growth
J-curve
Ideal conditions
Exponential growth (J-curve): Unlimited resources → rapid population increase.
what is the logistic growth model?
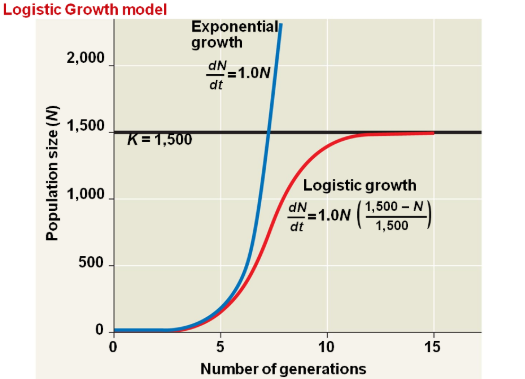
Logistic Growth
Characteristics:
Resources become limited
Growth slows over time
S-shaped curve
Keywords:
Logistic growth
S-curve
Carrying capacity
Environmental resistance
Logistic growth (S-curve): Limited resources → growth slows and levels off at carrying capacity.
what is carrying capacity?
Maximum population size an environment can sustainably support.
Symbol:
K
what are density dependent factors?
Density-Dependent Factors
Effects become stronger as population density increases.
Examples:
Competition
Disease
Predation
Parasitism
what are density independant factors?
Affect populations regardless of density.
Examples:
Drought
Floods
Fires
Extreme temperatures
what is clumped dispersion and why does it occur?
Clumped Distribution
Definition: Individuals are grouped together in patches.
Examples
Herds of deer
Schools of fish
Colonies of penguins
Trees growing around a water source
Why does it occur?
Resources (food, water, shelter) are concentrated in certain areas.
Protection from predators.
Social behaviour (living in groups).
Increased mating opportunities.
Exam answer:
Clumped distribution occurs when resources are unevenly distributed or when organisms benefit from living together.
what is uniform dispersion and why does it occur?
Uniform Distribution
Definition: Individuals are evenly spaced apart.
Examples
Nesting penguins keeping a fixed distance
Desert shrubs spaced apart
Territorial wolves or birds
Why does it occur?
Competition for resources.
Territorial behaviour.
Aggression between individuals.
Exam answer:
Uniform distribution occurs because competition or territorial behaviour keeps individuals evenly spaced.
what is random dispersion and why does it occur?
Random Distribution
Definition: Individuals are scattered with no predictable pattern.
Examples
Dandelions in a field
Wildflowers in a meadow
Trees in some natural forests (where resources are abundant)
Why does it occur?
Resources are plentiful and evenly available.
Individuals do not strongly attract or repel each other.
Seeds or spores are dispersed randomly by wind or animals.
Exam answer:
Random distribution occurs when resources are abundant and individuals do not interact strongly with one another.
what is fecundity?
Fecundity
Definition:
Fecundity is the reproductive capacity of an organism, or the number of offspring it can produce.
There is usually a trade-off:
High fecundity → many offspring, but fewer survive.
Low fecundity → fewer offspring, but more parental care and higher survival.
give me the characteristics of the type 1 survivorship curve?
Type I Survivorship
Pattern:
High survival during early and middle life.
Most individuals die at old age.
Examples:
Humans
Elephants
Whales
lots of parental care
give me the characteristics of the type 2 survivorship curve?
Type II species have a relatively constant mortality rate throughout their lives and moderate fecundity.
ex.) squirrels
mod perental care
give me the characteristics of the type 3 survivorship curve?
Type III species have very high fecundity and produce many offspring, but most die at a young age due to predation, disease, or competition.
ex.) flies
high fecundity no parental care, frogs,plants
Why do Type III species have high fecundity?
They produce many offspring because only a small proportion survive to adulthood, increasing the chance that some will reproduce.
birth rate is synonymous with what term?
natality
what is a limiting factor?
A limiting factor is any environmental factor that restricts the size or growth of a population.
density dependant and density independant factors are limiting factors
what is population sampling?
when Scientists estimate population size because counting every organism is impractical.
what is quadrate sampling and when is it used?
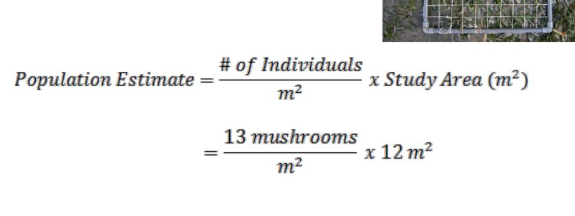
Quadrat Sampling Used for
Organisms that do not move.
Examples:
Grass
Flowers
Moss
Seaweed
Method:
Place a square frame (quadrat) randomly.
Count organisms inside.
Repeat several times.
Calculate average density.
✅ Best for plants and sessile organisms.
what is the mark and recapture method when is it used?
Used for
Animals that move around.
Examples:
Fish
Rabbits
Birds
Insects
Method:
1.Capture animals.
Mark them safely.
Release them.
Capture another sample later.
Count how many are marked.
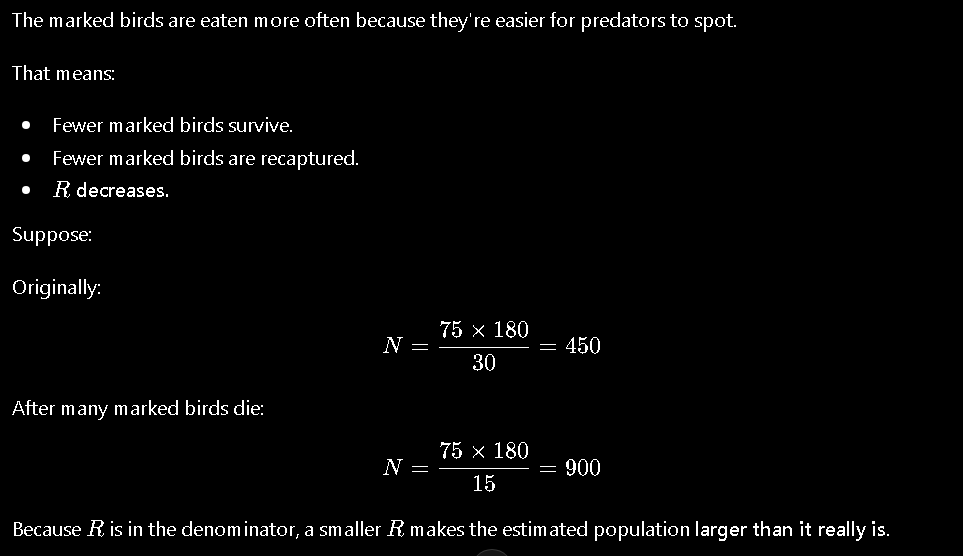
N = estimated population
M = number marked first
C = total caught second
R = marked individuals recaptured
Assumptions
Marks stay on.
Marks don't affect survival.
Population doesn't change much between samples.
Marked individuals mix randomly.

name all community interactions?
competition
predation
mutualism
commensalism
parisitism
what is competition?
Both species are negatively affected because they compete for the same limited resources.
what is predation?
One organism benefits by killing and eating another.
Examples:
Fox → rabbit
Hawk → mouse
Predator benefits.
Prey is harmed.
what is mutualism?
Mutualism (+ / +)
Both species benefit.
Examples:
Bees and flowers
Clownfish and sea anemones
what is commensalism?
Commensalism (+ / 0)
One species benefits.
The other is unaffected.
Examples:
Barnacles on whales
Birds nesting in trees
what is parasitsm?
Parasitism (+ / -)
One organism benefits while the host is harmed, usually without being killed immediately.
Examples:
Tick on a deer
Tapeworm in humans
Fleas on dogs
what are the 4 levels of ecological organization?
Organism – A single individual living thing.
Example: One wolf.
Population – A group of individuals of the same species living in the same area.
Example: All the wolves in a forest.
Community – All the different populations (different species) living and interacting in an area.
Example: Wolves, deer, rabbits, birds, trees, and insects in the same forest.
Ecosystem – The community plus the non-living (abiotic) environment.
Includes sunlight, water, soil, temperature, rocks, and air.
Example: A forest ecosystem.
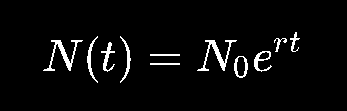
what is the exponential growth rate formula?
type growth rate
type e^x on calc
multiply by time
multiply by start organsism
if population were to double would it be exponential or logistic growth?
The population doubles, meaning the increase gets larger over time rather than increasing by a fixed amount.

a population follows logistic growth . Explain what happens to :
birth rate
death rate
resources
as it approaches carrying capacity.
As a population approaches carrying capacity, the birth rate decreases while the death rate increases due to limited resources and increased competition. Resources become scarce, causing population growth to slow and eventually stabilize at carrying capacity.
what is the difference between a food chain and food web?
A food chain shows a single pathway of energy transfer from one organism to another. A food web consists of many interconnected food chains, showing multiple feeding relationships and providing a more accurate representation of an ecosystem.
In a mark–recapture experiment, researchers estimate a population of 500 birds.
Several weeks later they discover that the paint used for marking made the birds easier for predators to catch.
The estimated population is most likely:
A. Too high
B. Too low
C. Accurate
D. Impossible to determine
smaller r larger population