Econ Macroeconomics Measurement 1
1/28
Earn XP
Description and Tags
Name | Mastery | Learn | Test | Matching | Spaced | Call with Kai |
|---|
No analytics yet
Send a link to your students to track their progress
29 Terms
leakages
Taxes paid to the government, spending on imports from abroad, and money saved in banks are all considered leakages from the circular flow of income. Any income earned but NOT spent on goods and services does not contribute to the nation’s total output, and is therefore leaked from the nation’s economy. However, these three leakages allow for the three following injections
Injections
Government spending, export revenues and investments are all enabled by the three leakages above.
Because households and firms pay taxes, government has money to provide the nation with valuable infrastructure, education, defense, support for health care and so on, all public or quasi-public goods that would be under-provided by the free market. These contribute to national output and are thus injections into the circular flow.
Because domestic households buy imports, foreigners have access to the money the need to buy the nation’s exports. The spending by foreigners on domestically produced goods contributes to national output and is therefore an injection.
Because households save some percentage of their income, capital is available for others to borrow and spend. Spending on capital goods by firms or on homes by households (both considered investments) contributes to the nation’s output and is thus an injection into the circular flow.
GDP (
Gross Domestic Product): Measures the total value of goods and services produced within a country’s borders.
GNI
(Gross National Income): Measures the total income earned by a country's residents and businesses, including net income from abroad (such as profits from businesses operating overseas) and excluding income earned by foreign businesses operating domestically.
Nominal GDP
The market value at current price of a nation's output of goods and services.
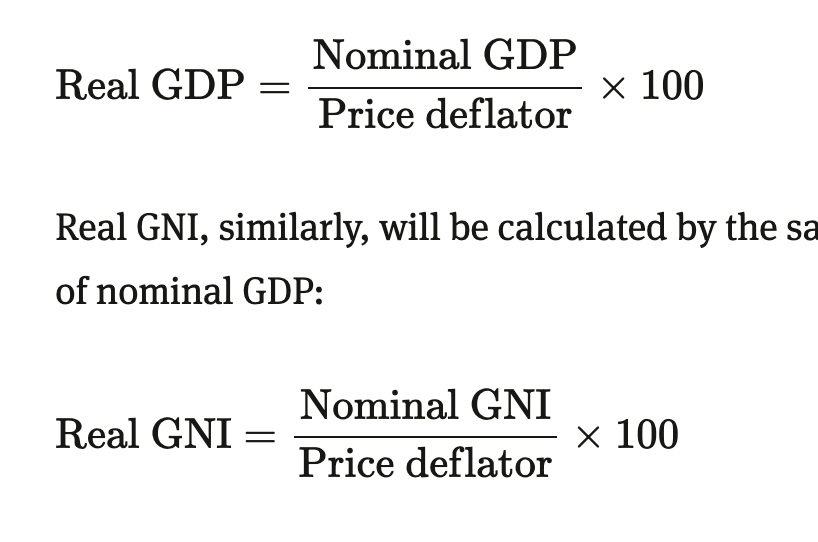
Real GDP
The value of a nation's output of goods and services in a particular adjusted for changes in the prices of goods and services from a base year.
PPP
compares economic productivity and standards of living between countries on the basis of relative costs of goods and services.
busines cycle
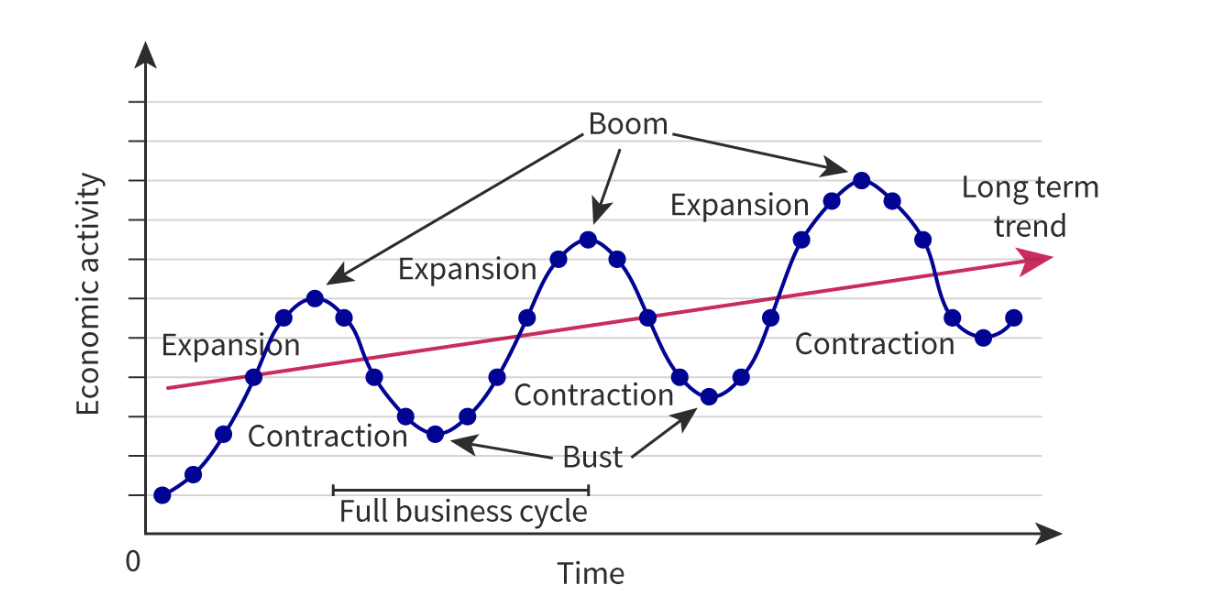
recession
decline in total output, income, employment and trade lasting 6+ months or two or more quarters - unemployment increases and there is a downward pressure on price level
recovery
recession ended, national output begins to increase until it has caught the long term growth trend
expansion
economy growing at a rate beyond the long-run growth trend
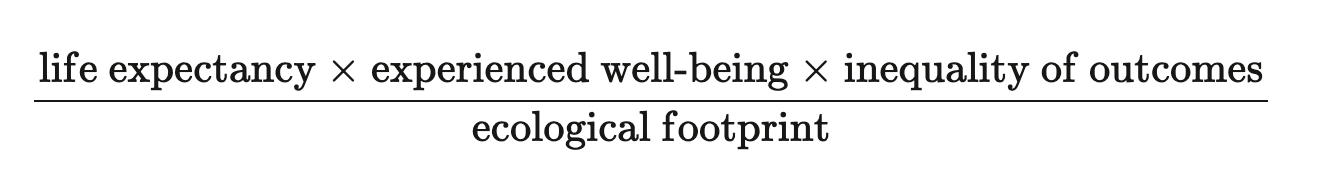
different methods of measuring well-being
World Happiness Report , OECD Better Life Index , Happy Planet Index, Gross National Happiness
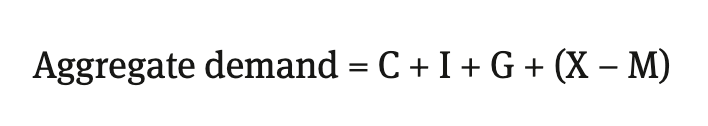
Aggregate Demand def + formula
is the total demand for goods and services produced in an economy and consists of consumption expenditure, government expenditure, investment spending and spending on net exports within a given time period
what factors explain the shape of the AD curve, and what does it look like
W - wealth effect, I- interest rate effect, N - net export effect
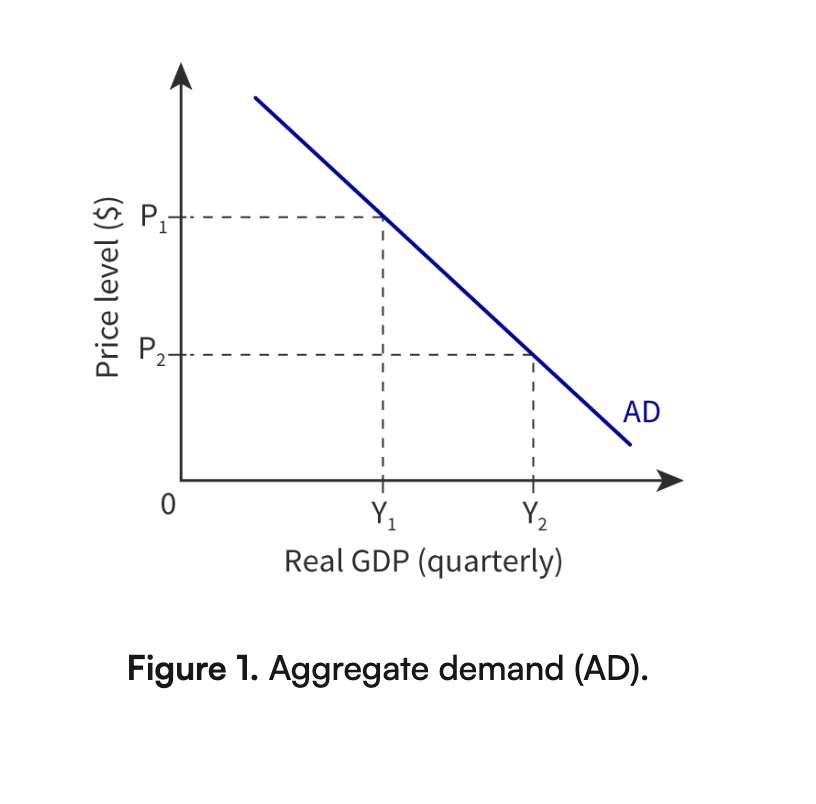
Wealth effect
As the average price level falls, the wealth of participants in the economy increases in real terms as their ability to purchase goods and services improves. The real value of assets, like property or stock, is now higher.
The interest rate effect
At lower price levels, interest rates are lower too, giving people more disposable income to spend and with which to demand higher volumes of output. The incentive to save is also lower.
The net balance effect
A lower price level makes goods and services relatively cheaper for foreign countries to buy. Therefore, the demand for exports rises and the demand for imports from abroad falls, increasing the net trade balance and leaving it in an overall better position.
AD consumption determinants
Confidence ↑ AD ↑/right
Unemployment ↑ AD ↓
Real interest rates ↑ AD ↓
Wealth refers to assets and includes ownership of property, bonds, shares of a company, and so on. ↑ AD ↑
Personal taxes ↑ AD ↓
Household debt/borrowing ↑ SR = AD ↑, LR= AD ↓
future expectations of inflation ↑, current AD ↑
AD Investments determinants
Interest rates ↑ AD ↓
Confidence ↑ AD ↑
Technology improvements ↑ AD ↑
Business taxes ↑ AD ↓
Debt ↑ AD ↓
AD Government determinants
AD Net exports determinants
Income of trading partners ↑ AD ↑
Exchange rates ↑ (your currency is more valuable) AD ↓
Trade policies - tariffs, impose restrictions on volumes of goods imported, known as quotas or voluntary export restrictions (VER), support their own industries with subsidies.
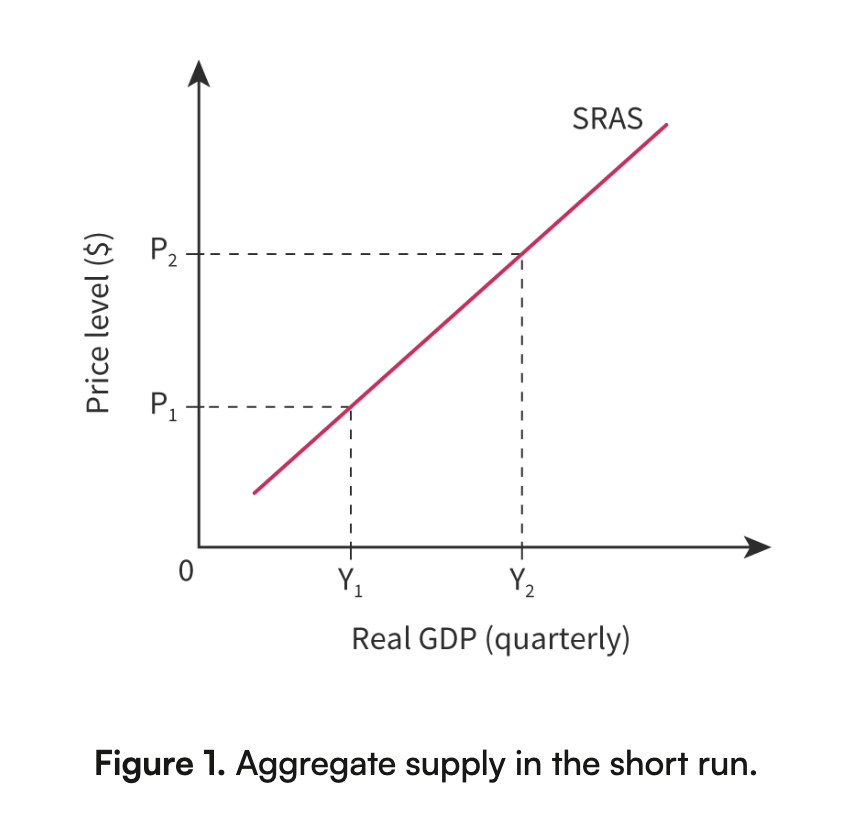
Aggregate Supply
refers to the total output that all firms in a country are able to produce at any given price level.
Graph and determinants of AS in short run
resource prices ↑ SRAS ↓
government intervention
regulation meant to keep workers safe but can slow economic growth
Business taxes ↓ - can invest more and AS ↑
government subsidies on - an industry that holds a large share of the nation's economic capacity, rarely shifting AS in developing countries. Or an energy provider
supply shocks.
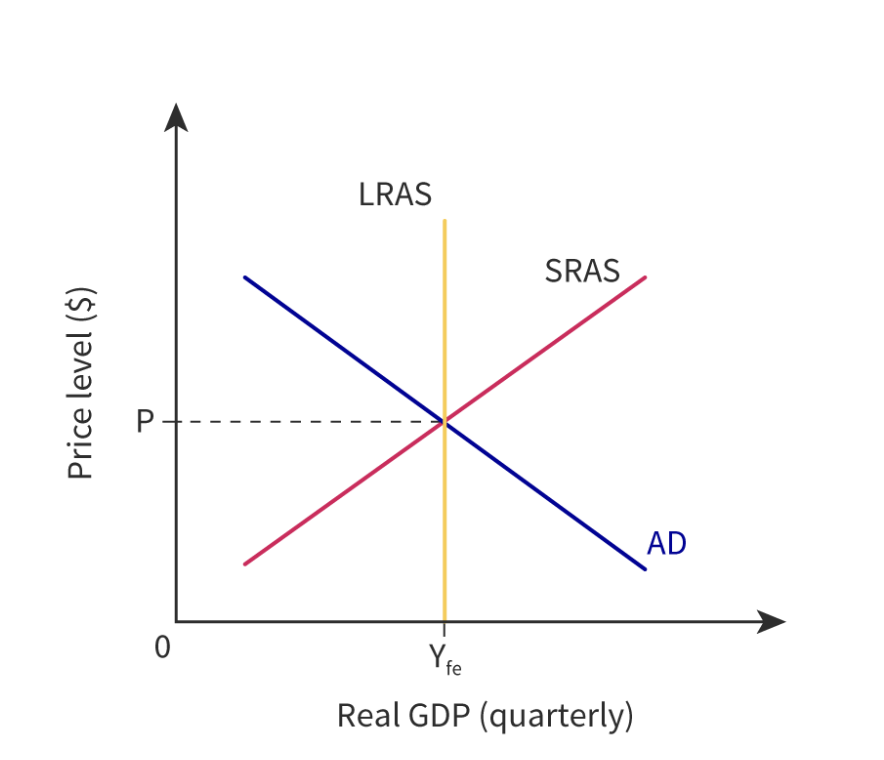
classical school AS
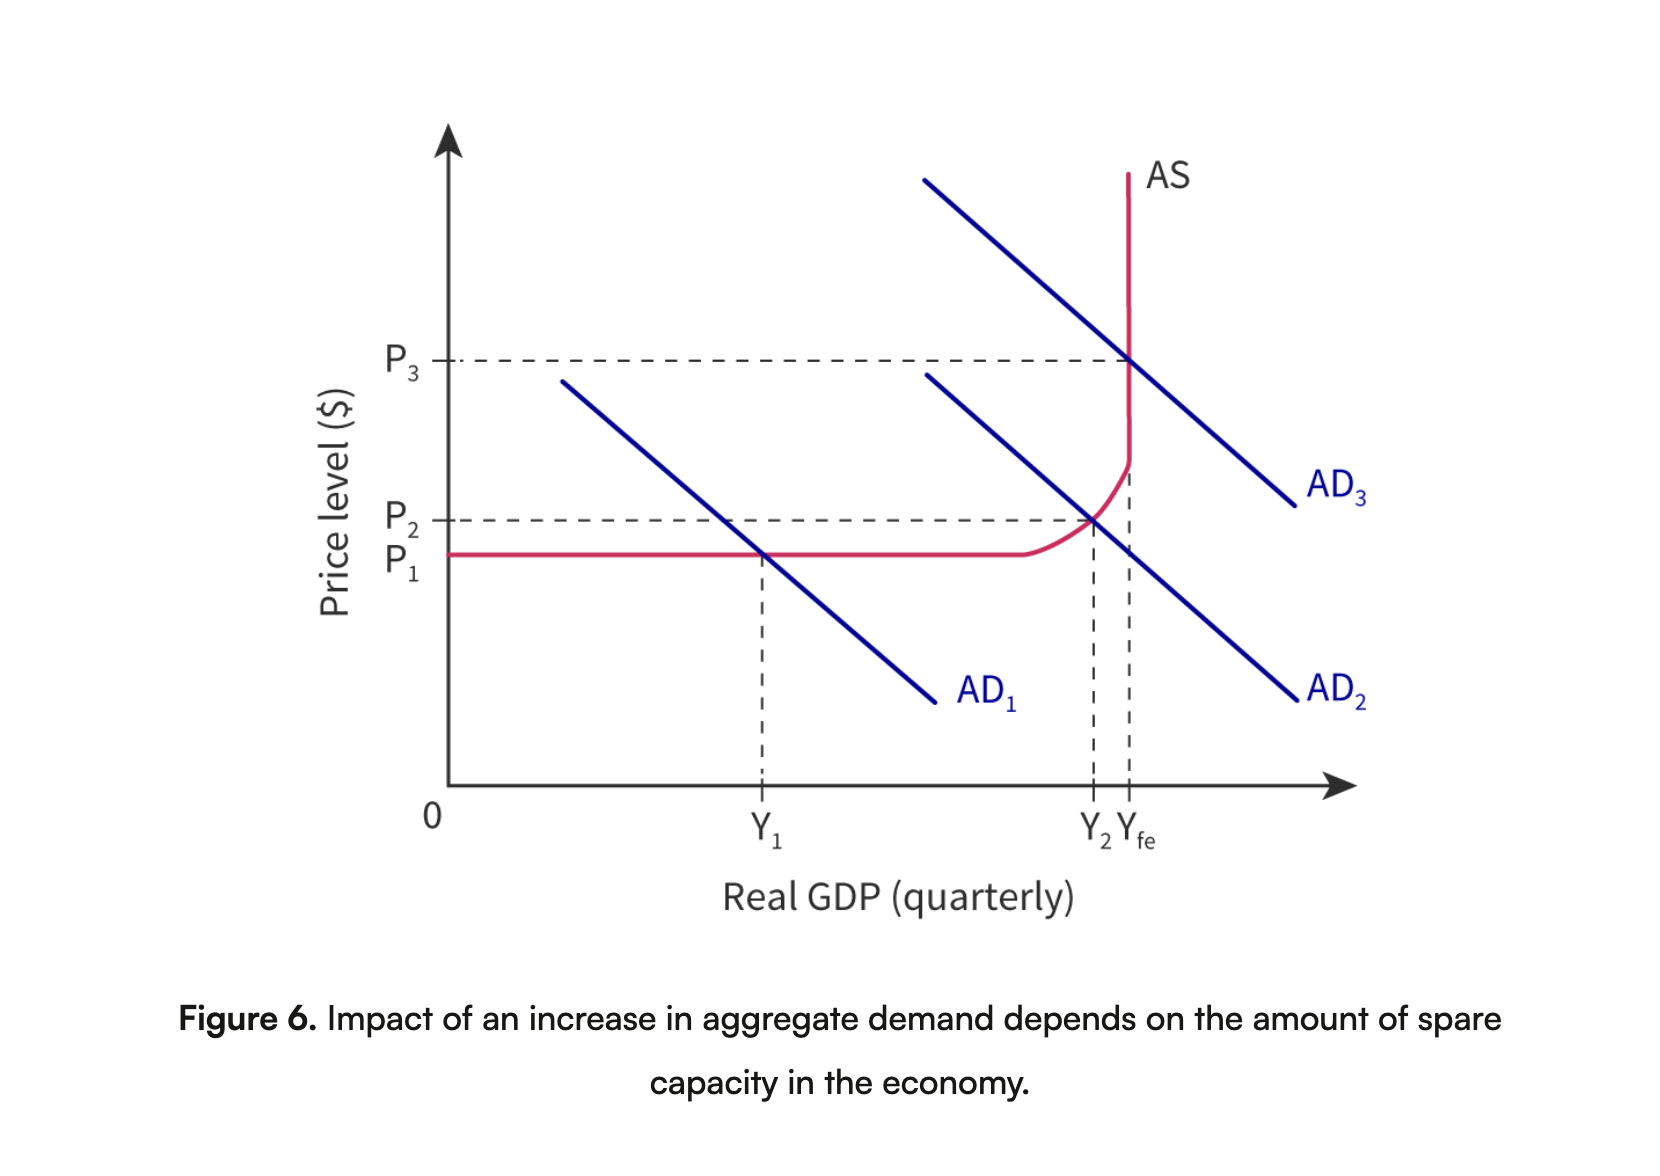
Keynesian model
The horizontal section, where there is a good deal of spare capacity in the economy
The upward sloping section, where there is some spare capacity but we are beginning to see some competition for scarce resources
The vertical section, where full employment is reached
fiscal policy
can shift SRAS, changes in taxation and government spending meant to increase or decrease the level of AD in a nation to promote macroeconomic objectives, such as full employment, price stability and economic growth.
government budget
contractionary fiscal policy, ad left
expansionary fiscal policy, ad right
budget deficit, if expenditure> tax revenue, AD right
budget surplus