INTROPSYTATS (marj)
1/74
There's no tags or description
Looks like no tags are added yet.
Name | Mastery | Learn | Test | Matching | Spaced |
|---|
No study sessions yet.
75 Terms
Statistics
It defines to the body of principles and procedures developed for the collection, organization, summarization, presentation and analysis of numerical data
Statistical Analysis in Psychology
It involves collecting and analyzing data to discover patterns and trends
Why psychologists use statistical analysis?
- to find ways to interpret and draw conclusions from their data
- to test whether the data from an experiment supports or rejects their hypothesis
Descriptive Statistics
Inferential Statistics
TYPES OF STATISTICAL ANALYSIS
Descriptive Statistics
It refers to the methods employed in summarizing the obtained data into frequency distribution,percentage distribution, measures of central tendency, etc. Its objective is to summarize some of the important features of a set of test scores.
Imferential Statistics
It refers to the methods utilized in making and evaluation generalization from the obtained test scores. It includes interval estimation and hypothesis testing such as t-test, z-test, chi square test, and analysis of variance (ANOVA). - CAUSE AND EFFECTS
Discrete Scale
Continuous Scale
What are the Scales of Measurement?
Measurement
the act of assigning numbers or symbols to characteristics of things according to rules.
Scale
A set of numbers whose properties model empirical properties of the objects to which the numbers are assigned
Discrete Scale
It contains numeric data that have a finite number of possible values and can only be whole numbers.
Continuous Scale
These are numerical data that can theoretically be measured in infinitely small units
Error
It is the collective influence of all of the factors on a test score or measurement beyond those specifically measured by the test or measurement
Independent Variables
Dependent Variables
What are the types of variables?
Independent Variable
Sometimes called as the predictor, is a variable that can be manipulated in an experiment.
Dependent Variable
Sometimes called as the outcome, is a variable that measures the effect of the independent variable.
Manifest Variable
These are variables that can be directly measured or observe
Latent Variables
These are variables that cannot be directly measured and needs a manifest variable assigned to it as an indicator
Research
It involves the systematic and scientific gathering, analysis, classification, organization, presentation, and interpretation of data. This rigorous approach serves to address problems, make predictions, discover truths, and ultimately contribute to the advancement and preservation of human well-being.
1. Statistics helps the researcher in making his research design
2. Statistical techniques help the researcher in determining the validity and reliability of his research instruments.
3. Statistical manipulations organize raw data systematically to make them appropriate for study.
4. Statistical treatments give meaning and interpretation to raw data hence, are used test the hypotheses.
5. Statistical methods determine the level of significance of he research findings.
Role of Statistics in Research
Primary Data
Secondary Data
What are the classification of data?
Primary Data
These are gathered from original sources and direct or first-hand experiences.
Secondary Data
These are gathered from secondary sources such as books, dictionaries, encyclopedias, published articles, magazines, newspapers, unpublished theses and dissertations, manuscripts etc.
1. Questionnaire/ Tests
2. Interview
3. Observation
4. Registration
5. Experiment
6. Library
7. Other mechanical tools
WHAT ARE THE INSTRUMENTS FOR COLLECTING DATA?
1. Must be valid and reliable
2. Must be based upon the conceptual framework
3. Must gather data that would test the hypotheses or answer the questions or problems under investigation
4. Must be as objective as possible
5. Must be unequivocal
6. The directions to accomplish the instrument must be clear and definite.
7. If the instrument is a mechanical device, it must be the best brand and the latest design.
CHARACTERISTICS OF A GOOD RESEARCH INSTRUMENT
Questionnaire
An instrument composed of carefully formulated questions intended to elicit information from a designated group of respondents, known as the target population, for the purpose of gathering data relevant to a specific research objective.
Selected-response format
a. Multiple-choice format
✓stem
✓correct alternative
✓distractors or foils
b.Matching Item
✓Premise
✓Responses
c. True-False Item
Constructed-Response Format
a. Completion Item
b. Short-answer item
c. Essay Item
Types of Questionnaire
MIMWERPF
1. Making research in the library
2. Interviewing knowledgeable people
3. Mastering the guidelines
4. Writing the questionnaire
5. Editing the questionnaire
6. Rewriting the questionnaire
7. Pretesting the questionnaire
8. Writing the questionnaire in its final form
Advantages:
1. Easy to construct
2. Easy distribution and inexpensive
3. Respondent’s replies are of his own
4. Confidential information may be given free
5. Tabulation of responses is easy
6. Respondents can fill out the questionnaire at their own convenience
7. More accurate replies may be given
Advantages of Questionnaire
1. It cannot be used with illiterates
2. Some or many respondents may not return the questionnaire
3. A respondent may give a wrong information
4. Respondents may leave some or many items unanswered
5. Some questions or items may be vague to the respondents
6. Number of choices may be very limited
Disadvantages of Questionnaire
Interview
It is verbal interaction between two or more persons
Interviewer
They asks questions to gather information
Interviewee
They supplies the information asked for
Structured
Unstructured
Semi-structured
Types of Classes of Interview
Struct
The interviewer is not allowed to change the specific wordings of the questions in the interview instruments.
Unstructured
The interviewer may revise or explain the questions as he sees fit depending upon the situation.
Semi-structured
There are listed major questions to be asked and once they are asked and answered, the interviewer is free to ask any question as he sees fit depending upon the situation.
1. One on One Interview
2. Group Interview
3. Panel Interview
4. Serial Interview
Types of Classes of Interview (depending on the number of people)
1. Preparatory step
2. Making a survey of the specific places of interviews
3. Establishing rapport
4. Carrying out the interview
5. Recording the interview
6. Closing the interview
Steps in conducting interview
1. Avoid forcing an interview upon a respondent
2. Avoid arguing
3. Avoid pressing unduly the respondent for a reply
4. Avoid using unfamiliar language to the interviewee
5. Avoid talking about things not related to the topic of the interview
6. Avoid embarrassing the interviewee
7. Avoid appearing too high in social status
8. Avoid conducting the interview in an unholy hour
What to avoid in interviews?
1. It yields a more complete and valid information
2. It can be used with all kinds of people
3. Any vague point can be clarified at once
4. Only the interviewee can make a reply
5. Subliminal cues may be observed by the interviewer
6. There is flexibility
Advantages of Interview
1. Some respondents are hard to contact
2. It is expensive
3. Some responses may be inaccurate
4. It is time consuming
5. Important data may be withheld
6. Some bias may be introduced
7. Standardization of questions and responses may be lessened.
Disadvantages of Interview
Observation
It is gathering data by means of the senses: sight, hearing, taste, touch, and smell. It is much used in studying overt behavior.
1. To gather empirical data difficult to gather by other means
2. To gather data to supplement or to verify data gathered by other means
3. To gather data which can be obtained only thru observation
4. To gather directly primary or first-hand information
5. To gather data thru experimentation
Purposes of Observation
1. Participant and nonparticipant observation
2. Structured and unstructured observation
3. Controlled and uncontrolled observation
Types of Observation
Nonparticipant Observation
The observer is a bystander using his five senses in gathering data
Participant Observation
The observer engages himself in the activities of the group observed.
Structured Observation
The items of a variable to be observed are specified and listed down
Unstructured Observation
Any object, condition, situation, or behavior that is relevant to the research investigation is included in the observation.
Controlled Observation
It is used in experimental studies, in which the experimental and nonexperimental variables are manipulated and controlled by the experimenter.
Uncontrolled Observation
No attempt is made to control the variables to be observed.
1. The information gathered is more accurate, valid and reliable.
2. Observation can be made as long and as many times it is needed.
3. Observation is the only technique of collecting data from inanimate objects and nonverbal behavior.
4. The subjects of the inquiry can be observed in their natural setting.
5. Observation results can be checked and verified.
Advantages of Observation
Controlled
It is the process of listing down data of the same kind in some systematic manner for record purposes.
1. Nominal
2. Ordinal
3. Interval
4. Ratio
Scales of Measurement (N.O.I.R)
Nominal Scales
Scales of measurement that involves classification or categorization based on one or more distinguishing characteristics, where all things must be placed into mutually exclusive and exhaustive categories
Ordinal Scales
Scales of measurement that involves classification and rank ordering on some characteristics
Interval Scales
Scales of measurement that each unit on the scale is equal to any other unit on the scale.
Ratio Scales
Scales of measurement that all mathematical operations can be performed.
Identity
Property of Nominal Scales
Identity, Magnitude and Equal Interval
Properties of Interval Scales
Identity and Magnitude
Properties of Ordinal Scales
Identity, Magnitude, Equal Interval and Absolute Zero
Properties of Ratio Scales
Distribution
It refers to as a set of test scores arrayed for recording or study
Raw score
It is a straightforward, unmodified counting of performance that is usually numerical.
Ex. Number of items responded correctly on an achievement test
Frequency Distribution
All scores are listed alongside the number of times each score occurred. Scores might be listed in a tabular or graphic form.
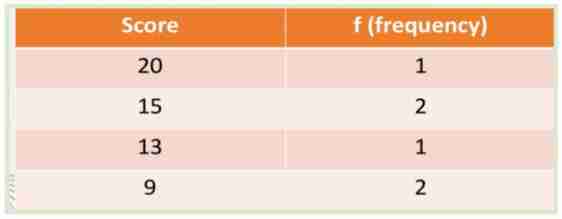
Simple Frequency Distribution
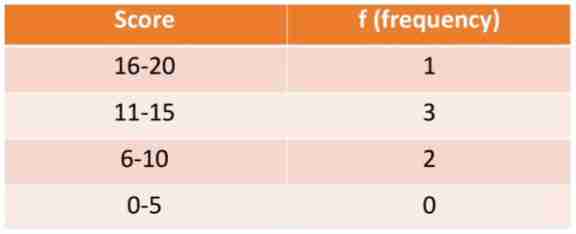
Grouped Frequency Distribution
Types of Frequency Distribution
Simple Frequency Distribution
What type of Frequency Distribution is this?
Grouped Frequency Distribution
What type of Frequency Distribution is this?
Graph
It is a diagram or chart composed of lines, points, bars, or other symbols that describe and illustrate data
Histogram
Bar Graph
Frequency Polygon
3 Types of Graph
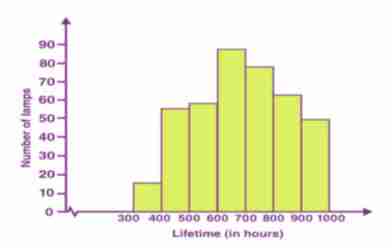
Histogram
It is a graph with vertical lines drawn at the true limits of each test score (or class interval, forming a series of contiguous rectangles.
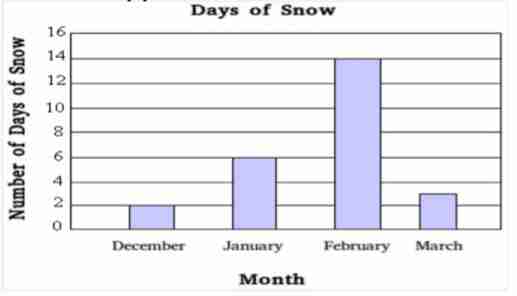
Bar Graph
A graph that numbers indicative of frequency appear on the y-axis, and reference to some categorization appears on the x-axis.
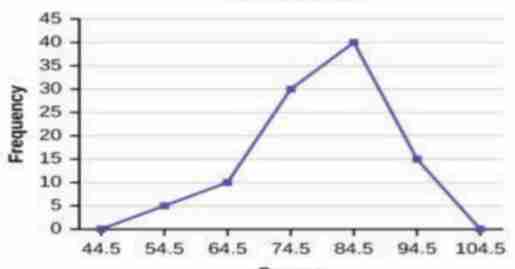
Frequency Polygon
It is a continuous line connecting the points where test scores or class intervals meet frequencies.
Histogram
What type of graph is this?
Frequency Polygon
What type of graph is this?
Bar Graph
What type of graph is this?