IB Microecon Notes Demand/Supply (2.5, 2.6)
1/67
Earn XP
Description and Tags
Demand/Supply/Markets
Name | Mastery | Learn | Test | Matching | Spaced | Call with Kai | Chat |
|---|
No analytics yet
Send a link to your students to track their progress
68 Terms
Non-price determinant of Demand - Income
For normal economic goods, when real consumer income rises, consumers will demand a greater quantity of goods
Real income could be affected by increase in income, price decreases etc.
Law of diminishing marginal utility
As an individual consumers additional units of a good, the additional satisfaction decreases
Substitution effect
When the price of a product falls relative to other products, there is an incentive to purchase more of the product, since marginal utility/price ratio has been improved.
Conversely, as the price of a good increases, the substitution effect increases as consumers are more inclined to purchase cheaper substitutes to maximize utility.
Difference between demand and quantity demanded
Quantity demanded is the willingness and ability to purchase a quantity of good/service at a certain price over a given time period (a specific point)
Quantity demanded changes when price changes, and is shown by movement along the same demand curve
A shift in the demand curve is attributed to non-price factors where the whole relationship between price and quantity demanded is changes
Law of diminishing marginal returns
A short run law of production stating that as more and more units of the variable factor (usually labor) are added to a fixed factor (usually capital), there is a point beyond which total product continues to rise but at a diminishing rate (and marginal cost starts to increase)
Change in Equilibrium and Market forces
equilibrium is affected by any non-price determinant of demand of demand or supply
This leads to a shift of either curve and excess demand/excess supply
In order to eliminate excess demand/supply, it is necessary for price to rise/fall until the quantity demanded once again equals quantity supplied
Price Mechanism of markets
The price mechanism of markets has 3 significant functions (1) signalling (2) rationing (3) incentivizing
1- prices are set by the actions of consumers and producers, and reflect changing circumstances in market. Signalling those in the market to act in a certain way
2- if there is excess demand, prices will become relatively high, so the low supply will be rationed to those willing/able to pay the higher price
3- manages demand and supply through opposing and balancing incentives. High price acts as a disincentive for consumers and incentive for producers, and vice versa
Consumer Surplus
difference between how much a consumer is able and willing to pay for a good and how much they actually pay
Producer surplus
Difference between how much a producer is able and willing to sell a good for and how much they actually sell it for
Allocative efficiency
Achieved when just the right amount of goods and services are produced from society’s point of view so that scarce resources are allocated in the best possible way. It is achieved when, for the last unit produced, price (P) is equal to marginal cost (MC) or more generally, if marginal social benefit (MSB) = Marginal social cost (MSC)
Inelastic PED
0<PED<1 , a change in the price of a good or service leads to a proportionately smaller change in the quantity demanded of the good or service in the opposite direction
Elastic PED
PED>1, a change in the price of a good or service leads to a proportionately larger change in the quantity demanded of the good or service in the opposite direction
PED non price determinants
Degree of Necessity (and how broadly it is defined
Absolute value of product and how much income consumer uses to purchase good
Availability and degree of substitutes
Time frame purchase decision has to be made in
Primary VS manufactured commdity
Impacts of Indirect tax on market
1- indirect tax causes supply curve to shift up
2 - higher price causes excess supply
3 - price has to fall until new equilibrium
(Note that the equilibrium price ≠ original price + tax)
Indirect tax when PED = PES
Burden of tax imposed is shared equally between consumers and producers
Indirect Tax when PED > PES
burden of tax will be greater on producers than consumers
Producers cannot pass on a lot of the burden of the tax because demand is very elastic and too many consumers would stop buying the product
Therefore, producers bear most of the burden of the tax, and the price for consumers only rises a little
Indirect tax when PED<PES
Burden of tax imposed will be greater on consumers of the product than on producers
Producers can pass on a lot of the burden of the tax, because demand is fairly inelastic and so consumers are not very responsive to the increase in price
Price Elasticity of Supply (PES)
A measure of the responsiveness of the quantity supplied of a good or service to a change in its price.
%∆QTY supplied ÷ %∆ Price
Elastic PES
PES > 1, change in the price of a good or service leads to a proportionally larger change in the quantity supplied of the good or service (in the same direction)
Price Inelastic Supply
PES<1 Where a change in the price of a good or service leads to a proportionately smaller change in the quantity supplied of the good or service in the same direction.
PED Formula
%∆Quantity Demanded ÷ %∆Price
Price Elasticity of Demand
a measure of the responsiveness of the quantity demanded of a good or service to a change in its price.
PED = 0
vertical line; perfectly inelastic demand
a change in price will lead to no change in Quantity Demanded. (this means there are no substitutes of the good, and it is necessary)
PED = ∞
horizontal; perfectly elastic demand
any change in price would lead to 0 demand for the product (because there is an abundance of perfect substitutes)
Factors of PED
number and closeness of substitutes
Necessity of good
Proportion of income spent on product
Time period
PED affected by Number & Closeness of substitutes
if consumers can easily exchange one product for another similar one, quantity demanded will be more elastic.
PED affected by Necessity of Good
For goods and services that are essential, quantity demanded will be inelastic. As price goes up, consumers cannot change the amount of the good they purchase by too much.
PED affected by proportion of income spent on product
If consumers spend a large proportion of their income on a product, it is more likely to be elastic.
PED affected by time period
In the short run, demand will be more inelastic as i takes time for consumers to find an alternative. However, in the long term, as consumers change their buying and consumption habits, PED tends to become more elastic.
PED of Primary Commodities
More inelastic
PED of Primary Commodities explained
Primary commodities have little to no substitutes
they are essential for production
Large amount of time needed to grow/extract primary commodities
PED of Manufactured Products
More elastic
PED of Manufactured Products explained
many close substitutes
Lower necessity
Proportion of income spent is relatively high
Revenue
Price x Quantity
Revenue for PED inelastic demand
When price is increased, quantity demanded falls by a proportionally smaller amount. So, a small increase in price raises total revenue.
Revenue for PED elastic
When price is decreased, quantity demanded increases proportionally more. Therefore, small increases in price will raise total revenue.
Unitary PED
PED= 1 for every point on the graph
Shape of the graph looks like a rational function 1/x
PED use for government
allows governments to assess the impacts of indirect taxes on the market
Tax on PED elastic —> too much burden passed on to firms, leading to implications such as firing workers
Tax on PED inelastic —> generate large amounts of revenue, and most of the tax burden is on consumers
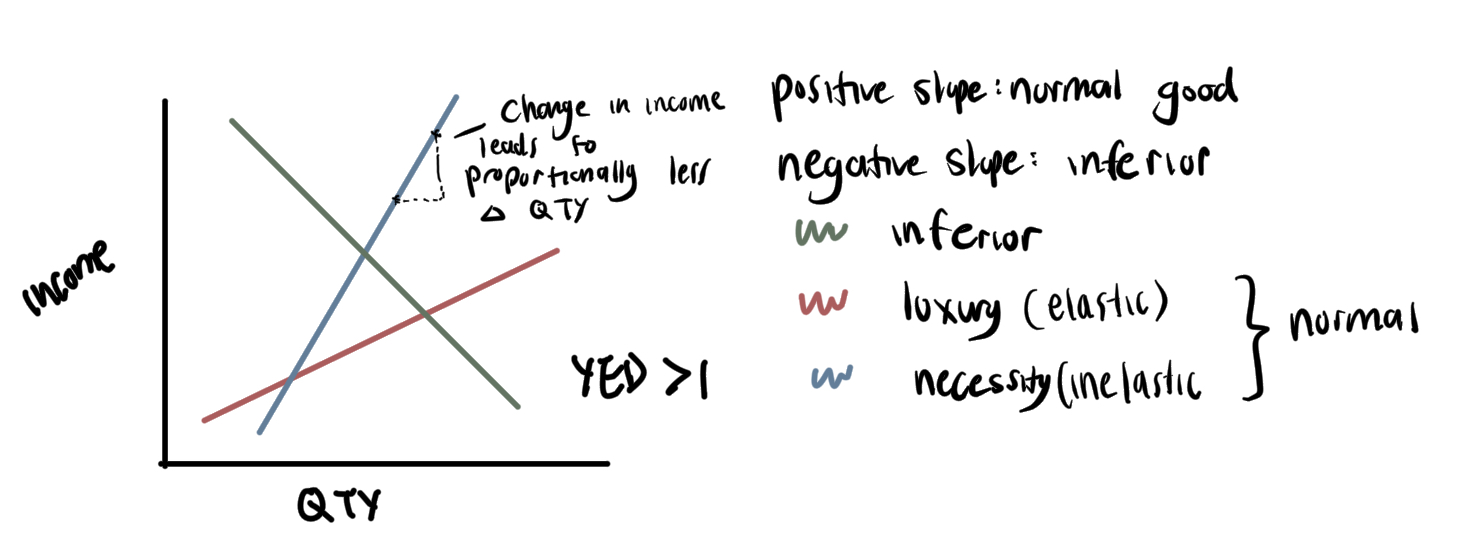
Income elasticity of demand (YED)
%∆Quantity / %∆Income
Negative YED
inferior good
With rise in income, consumers start using superior goods, which they can now afford
Positive YED
normal good
|YED| < 1
YED is inelastic and means the good is a necessity. A change in income of consumer leads to a less than proportional change in quantity demanded.
|YED|>1
Elastic YED and means the good is luxury. Change in income of a consumer leads to a more than proportional change in quantity demanded.
Factors of YED
Necessity of good
Degree of Luxury
How degree of Necessity affects YED
The more necessary a good is to a consumer, the more inelastic the demand will be. While these goods are more necessary in life, consumers also don’t need to purchase more than they consume.
How degree of Luxury affects YED
Goods that have higher degree of luxury have m ore elastic YED. Once consumers have more income and have satisfied their needs, they begin to purchase more expensive goods of superior quality. However, conversely, if income decreases, quantity demanded of these goods will fall by a larger than proportional amount, as consumers will cut on non essential spending first.
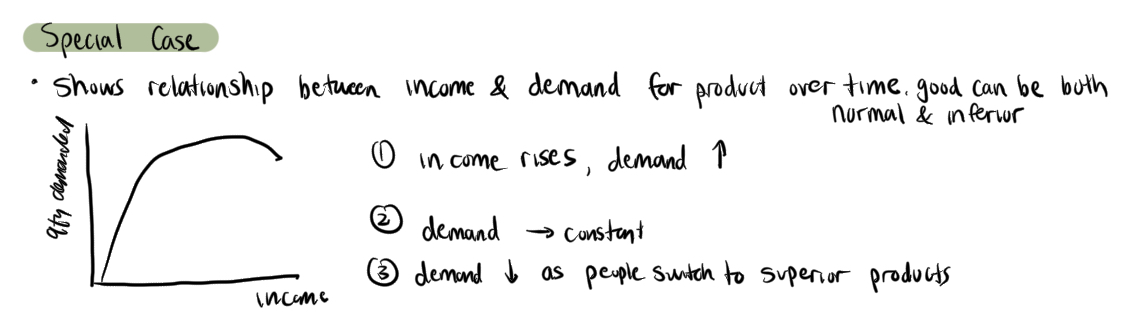
Engel curve for YEDs
YED can change over time
Application of YED (firms)
firms can use YED to estimate the impact of changes in real income on different products. If possible, they can switch production accordingly
E.g. during a depression, income falls, and so goods with large YED will be more negatively affected
Application of YED (government planning)
governments can use YED to estimate the impacts changes in gross national income (GNi) has on different markets.
This will allow them to plan ahead in eras of the need for welfare, subsidies, and other support schemes.
Applications of YED (sectoral changes)
The primary, secondary, and tertiary sector each produce products that have a different YED
A government looking to develop and grow its economy needs to understand the YED of the products it produces and reflect on which sectors they are mostly comprised of
To gain more profit, countries should move towards producing in the tertiary sector, as those products have the highest YED.
Price elasticity of Supply (PES)
%∆Quantity Supplied / %∆Price
Elastic PES
PES > 1, a change in price leads to a proportionally larger change in quantity supplied.
Inelastic PES
PES < 1, a change in price leads to a proportionally smaller change in quantity supplied.
Perfectly elastic supply
PES = ∞ (no possible IRL), refers to a situation where the supply of a good or service is infinitely responsive to changes in price
Perfectly inelastic supply
a change in price does not affect the quantity supplied
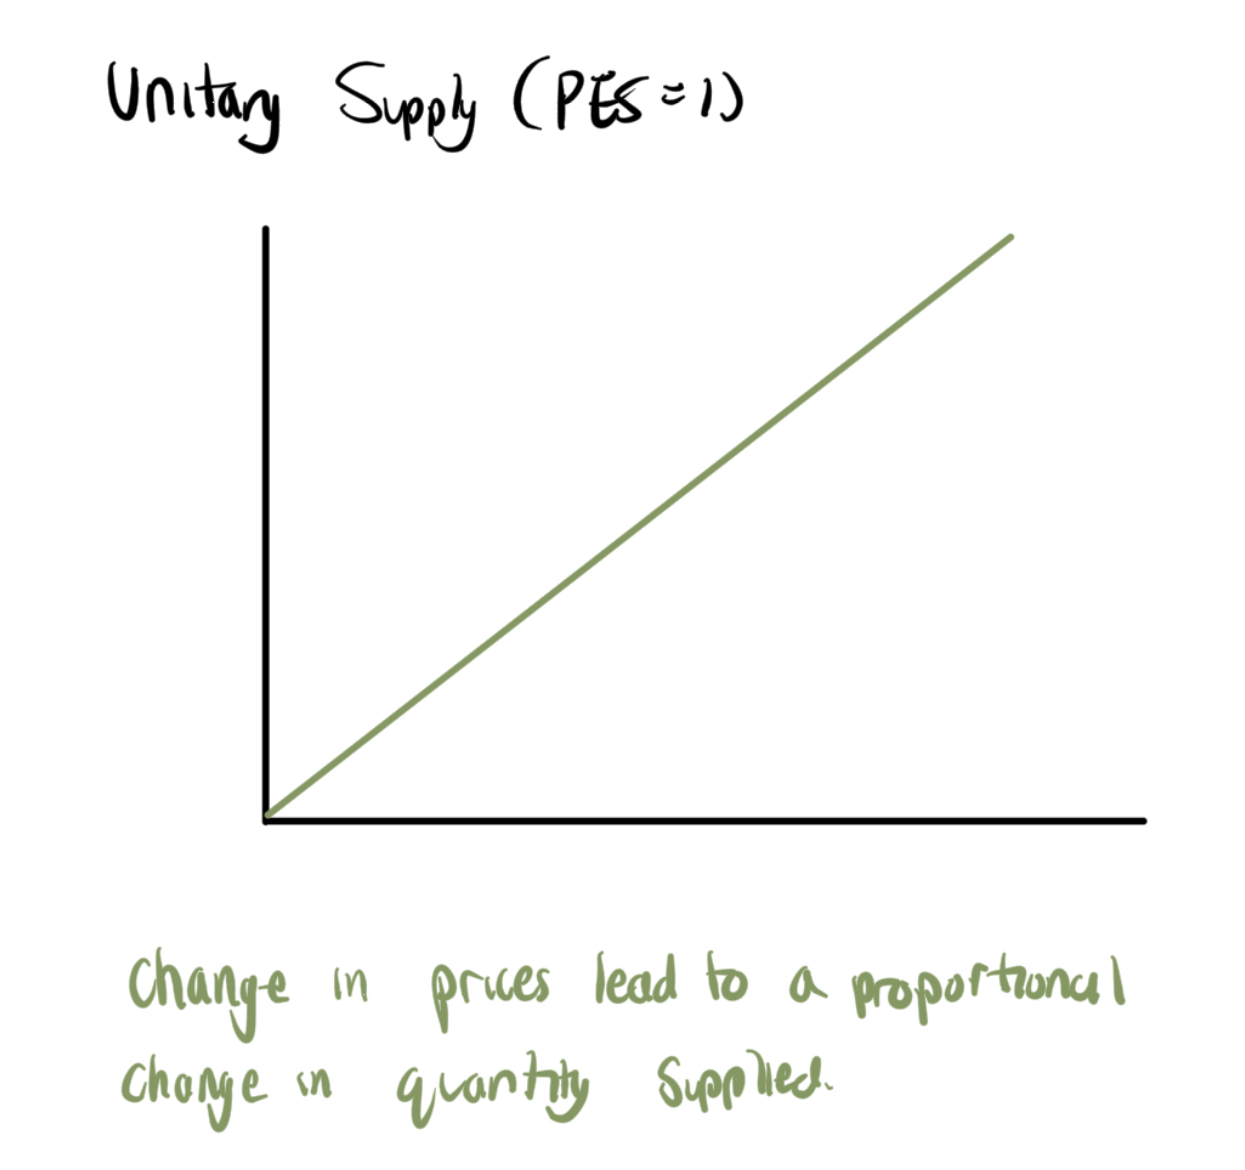
Unitary PES
PES = 1 at every point
Determinants of PES
mobility of factors of production
rate at which marginal cost/cost of production increases
ability to store goods
spare capacity to increase production
time period
Mobility of factors of production affecting PES
if producers can switch resources between products, PES will be more elastic.
Rate at which cost of production increases affecting PES
if the marginal cost increases at a slow rate, supply will be more elastic, as producers will be willing to produce more in response to increased prices. However, if it incurs too much additional cost to produce more, quantity supplied will be more inelastic.
Ability to store goods affecting PES
If products can be easily stored, PES is more elastic as producers can quickly increase supply by releasing goods from inventory or vice versa
Spare Capacity affecting PES
Spare capacity exists when the current level of production is below that max output possible in the short run. This means there are spare labour and capital inputs available.
If there is spare capacity then a business can increase output without a rise in unit costs and thus supply will be price elastic.
Time Period affecting PES
In the short run, quantity supplied will tend to be more inelastic, as producers may find it harder to respond to an increase in prices, especially because it takes time to produce the product. However, in the long run, they can change any of their factors of production.
PES of Primary VS Secondary Goods
the PES of primary goods is generally more inelastic compared to secondary goods. This is because of four primary reasons:
Time
Inventory
Marginal Cost
Spare Capacity
How time affects Primary VS Secondary Goods
Primary goods: it takes longer to grow and harvest primary goods. If there were to be an increase in the demand of a primary product, producers would be unable to respond with a proportionate increase in quantity as it takes time to grow/harvest goods. Similarly, they will not be able to decrease supply easily.
Secondary goods: with a supply chain set up and resources readily available, it takes a much shorter period to create an additional unit of good.
How Inventory affects Primary VS Secondary Goods
Primary: as primary goods as usually easily perishable and damaged, producers cannot keep extensive inventory of primary products.
Secondary: can be stored for longer periods of time
How Marginal Costs affect Primary VS Secondary Goods
primary: producing 1 extra unit is harder (e.g. to get 1 more apple, you need a new tree)
secondary: large amounts of identical objects can be mass produced in the same, established, supply chain. So the marginal cost of 1 additional unit is low.
How Spare Capacities affect Primary VS Secondary goods
primary: land is fixed in supply, so there is very little spare capacity and new primary products can’t be grown within a set amount of time
manufactured: capital and tech intensive output that can be mobil